

Key Insights
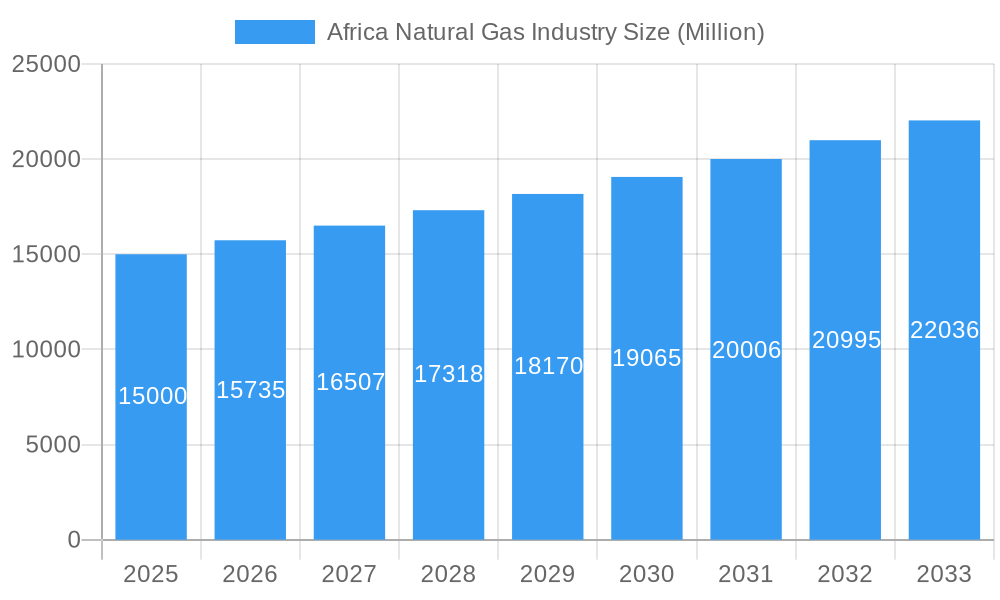
The African natural gas industry is experiencing robust growth, projected to maintain a Compound Annual Growth Rate (CAGR) exceeding 4.50% from 2025 to 2033. This expansion is fueled by several key drivers. Increased industrialization across the continent is creating significant demand for energy, with natural gas emerging as a cleaner and more efficient alternative to traditional fuels. Furthermore, significant investments in power generation infrastructure, particularly in regions like North Africa and East Africa, are bolstering market growth. Government initiatives promoting energy diversification and energy security are also playing a crucial role. The residential sector, while currently smaller, is expected to witness notable growth as access to cleaner cooking fuels expands. The market is segmented geographically across North, West, Central, East, and Southern Africa, with South Africa, Sudan, Uganda, Tanzania, and Kenya representing significant regional hubs. Market participants include major international players like Shell, TotalEnergies, and Chevron, alongside national oil companies such as Sonatrach and Nigerian National Petroleum Corporation. While the industry faces challenges such as infrastructure limitations and geopolitical instability in certain regions, the overall outlook remains positive. The long-term forecast indicates continued expansion, driven by sustained economic growth, population increases, and rising energy needs.
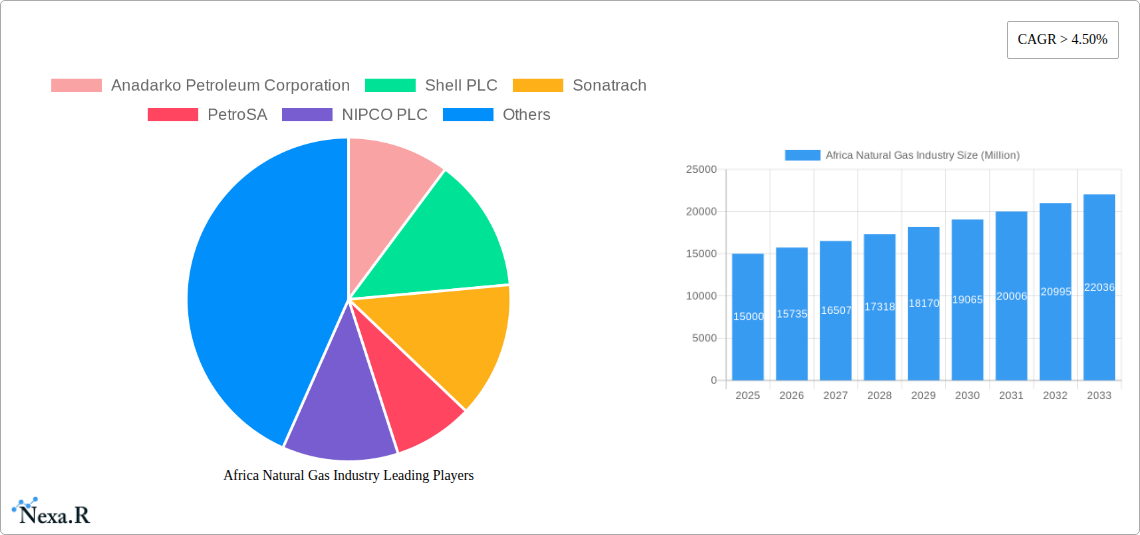
Africa Natural Gas Industry Market Size (In Billion)
The competitive landscape is characterized by a mix of large multinational corporations and national oil companies, leading to strategic partnerships and collaborations to unlock the continent's vast natural gas reserves. Small and medium-sized enterprises (SMEs) primarily operate within the downstream sectors, such as distribution and retail. The ongoing exploration and development of new gas fields, coupled with advancements in gas processing and transportation technologies, are further enhancing the industry's prospects. However, factors such as regulatory hurdles, environmental concerns, and the need for substantial investment in infrastructure remain potential restraints. Strategic partnerships between governments, private companies, and international organizations will be critical to successfully navigating these challenges and maximizing the industry's growth potential. Future projections indicate a significant increase in natural gas consumption across all segments, further solidifying Africa's position as a key player in the global energy market.
Africa Natural Gas Industry Company Market Share
Africa Natural Gas Industry: A Comprehensive Market Report (2019-2033)
This in-depth report provides a comprehensive analysis of the Africa Natural Gas Industry, covering market dynamics, growth trends, dominant players, and future outlook. The study period spans from 2019 to 2033, with a base year of 2025 and a forecast period from 2025 to 2033. The report utilizes both quantitative and qualitative data to offer a holistic understanding of this vital sector, crucial for industry professionals, investors, and policymakers.
Africa Natural Gas Industry Market Dynamics & Structure
This section analyzes the structure and dynamics of the African natural gas market, encompassing market concentration, technological innovation, regulatory landscapes, competitive substitutes, end-user demographics, and merger & acquisition (M&A) activities.
Market Concentration: The African natural gas market exhibits a moderately concentrated structure, with a few large multinational corporations such as Shell PLC, TotalEnergies SE, and Eni SpA holding significant market share. However, national oil companies (NOCs) like Sonatrach and the Nigerian National Petroleum Corporation (NNPC) also play a crucial role. The market share of these key players is estimated at xx% in 2025.
Technological Innovation: Technological advancements are driving efficiency gains in exploration, extraction, and processing. However, barriers to innovation include limited infrastructure investment, lack of skilled workforce, and political instability in certain regions.
Regulatory Frameworks: Varying regulatory frameworks across African nations influence market access and investment decisions. Harmonization of regulations and increased transparency are needed to attract further investment.
Competitive Product Substitutes: Renewable energy sources like solar and wind pose a growing competitive threat, particularly in the power generation sector.
End-User Demographics: The primary end-users include the power generation sector (xx Million units in 2025), followed by industrial (xx Million units in 2025) and residential sectors (xx Million units in 2025). The growth of these sectors directly impacts the demand for natural gas.
M&A Trends: The past five years have seen a moderate number of M&A deals, primarily focused on exploration and production assets (xx deals in the period 2019-2024). Future activity is expected to be driven by consolidation and the search for new reserves.
- Market Share (2025): Shell PLC (xx%), TotalEnergies SE (xx%), Eni SpA (xx%), Sonatrach (xx%), NNPC (xx%), Others (xx%).
- M&A Deal Volume (2019-2024): xx deals.
Africa Natural Gas Industry Growth Trends & Insights
The African natural gas market exhibits significant growth potential driven by increasing energy demand, industrialization, and urbanization. The historical period (2019-2024) saw a Compound Annual Growth Rate (CAGR) of xx%, while the forecast period (2025-2033) projects a CAGR of xx%. This growth is fueled by rising energy consumption across various sectors. The penetration rate of natural gas in the power generation sector is expected to reach xx% by 2033, compared to xx% in 2025. Technological advancements, such as improved exploration techniques and liquefied natural gas (LNG) infrastructure development, are also contributing factors. Consumer behavior shifts towards more reliable and affordable energy sources support this expansion. However, challenges remain in terms of infrastructure development and regulatory hurdles, potentially slowing the pace of growth in certain regions.
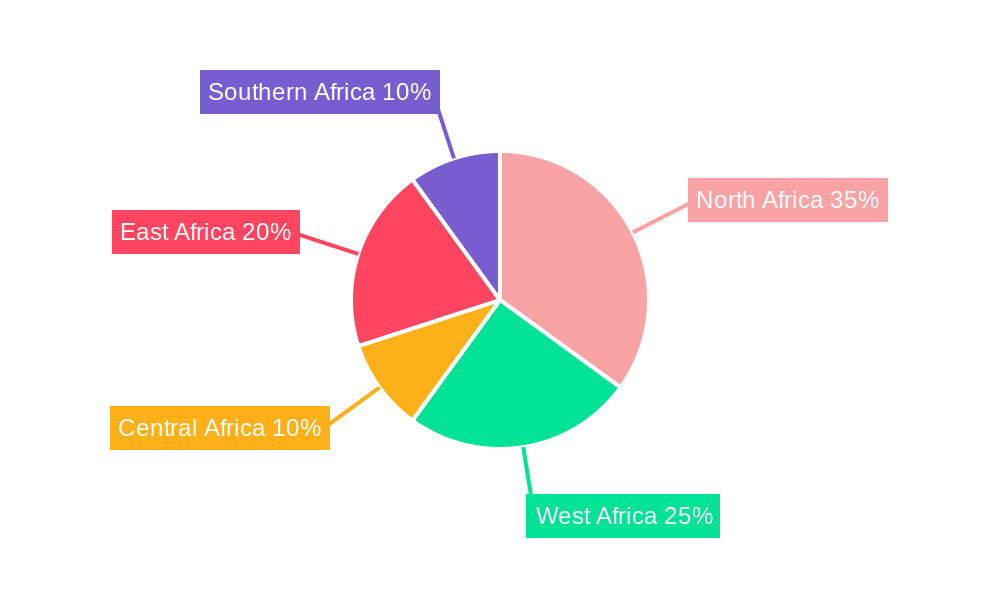
Dominant Regions, Countries, or Segments in Africa Natural Gas Industry
North Africa, particularly Algeria and Egypt, currently dominate the African natural gas market due to established reserves and infrastructure. However, West Africa shows significant growth potential fueled by increasing energy demand and large gas reserves. The power generation segment is the largest consumer of natural gas, with a projected xx% market share in 2025.
- Dominant Region: North Africa (Market Share in 2025: xx%)
- Key Countries: Algeria, Egypt, Nigeria
- Dominant Segment: Power Generation (Market Share in 2025: xx%)
North Africa: Established production and export infrastructure, coupled with substantial reserves, makes North Africa the leading region. However, political stability and regulatory frameworks influence market expansion.
West Africa: Significant gas reserves and a growing energy-demanding population drive growth, despite some infrastructure constraints. The Nigeria-Morocco gas pipeline project signals substantial future market expansion.
Central Africa: Underdeveloped infrastructure and exploration challenges limit growth. However, substantial untapped potential exists.
East Africa: Large gas reserves have been discovered in recent years, with ongoing exploration activities expected to lead to market growth in the coming decade.
Southern Africa: Relatively low consumption and limited gas production hamper regional growth.
Africa Natural Gas Industry Product Landscape
The African natural gas market primarily focuses on natural gas itself, in both pipeline and LNG forms. Product innovations center around improving efficiency in gas processing and transport, reducing methane emissions, and developing technologies for gas-to-power generation. The unique selling propositions focus on reliable supply, competitive pricing, and environmentally friendly practices. Technological advancements include advanced exploration techniques, enhanced gas recovery methods, and more efficient pipeline technologies.
Key Drivers, Barriers & Challenges in Africa Natural Gas Industry
Key Drivers:
- Growing Energy Demand: Rapid population growth and industrialization fuel the increasing demand for energy, boosting natural gas consumption.
- Infrastructure Development: Investments in new pipelines and LNG terminals are improving gas accessibility.
- Government Support: Supportive policies and regulations are encouraging investments in the sector.
Challenges & Restraints:
- Infrastructure Deficiencies: Significant investment is required to expand and modernize the gas infrastructure. The estimated investment required for infrastructure development is xx Million units over the next decade.
- Regulatory Uncertainty: Inconsistent regulatory frameworks across different countries create investment risks.
- Geopolitical Instability: Political instability and conflicts in several regions pose a challenge to exploration and production activities.
Emerging Opportunities in Africa Natural Gas Industry
- Untapped Reserves: Significant unexplored gas reserves across the continent offer vast potential for future growth.
- Gas-to-Power Initiatives: Growing power shortages create substantial opportunities for gas-powered electricity generation.
- LNG Exports: Increasing LNG production and export capabilities will open up new markets and revenue streams.
Growth Accelerators in the Africa Natural Gas Industry Industry
Technological advancements, such as enhanced recovery techniques, improving efficiency and reducing environmental impact, will play a pivotal role. Strategic partnerships between international oil companies and African NOCs are accelerating infrastructure development and knowledge transfer. Focused government policies and supportive regulations encourage private sector participation.
Key Players Shaping the Africa Natural Gas Industry Market
- Anadarko Petroleum Corporation
- Shell PLC
- Sonatrach
- PetroSA
- NIPCO PLC
- TotalEnergies SE
- Egyptian Natural Gas Holding Company
- Eni SpA
- Nigerian National Petroleum Corporation
- Chevron Corporation
Notable Milestones in Africa Natural Gas Industry Sector
- September 2022: Announcement of the Nigeria-Morocco gas pipeline project, aiming to supply 3 billion standard cubic feet of gas to Europe annually.
- May 2022: Sonatrach and Eni signed an MoU to accelerate gas field development in Algeria, targeting an additional 3 billion cubic meters of annual gas exports.
In-Depth Africa Natural Gas Industry Market Outlook
The African natural gas market is poised for substantial growth over the next decade. Continued investment in infrastructure, supportive government policies, and technological advancements will unlock the vast potential of the continent's gas resources. Strategic partnerships and regional cooperation will be crucial for realizing this potential and maximizing the economic benefits for African nations. The focus on gas-to-power initiatives will support sustainable development goals.
Africa Natural Gas Industry Segmentation
-
1. Geography
- 1.1. Nigeria
- 1.2. Algeria
- 1.3. Egypt
- 1.4. South Africa
- 1.5. Rest of Africa
Africa Natural Gas Industry Segmentation By Geography
- 1. Nigeria
- 2. Algeria
- 3. Egypt
- 4. South Africa
- 5. Rest of Africa
Africa Natural Gas Industry Regional Market Share
Geographic Coverage of Africa Natural Gas Industry
Africa Natural Gas Industry REPORT HIGHLIGHTS
| Aspects | Details |
|---|---|
| Study Period | 2020-2034 |
| Base Year | 2025 |
| Estimated Year | 2026 |
| Forecast Period | 2026-2034 |
| Historical Period | 2020-2025 |
| Growth Rate | CAGR of > 4.50% from 2020-2034 |
| Segmentation |
|
Table of Contents
- 1. Introduction
- 1.1. Research Scope
- 1.2. Market Segmentation
- 1.3. Research Objective
- 1.4. Definitions and Assumptions
- 2. Executive Summary
- 2.1. Market Snapshot
- 3. Market Dynamics
- 3.1. Market Drivers
- 3.2. Market Restrains
- 3.3. Market Trends
- 3.4. Market Opportunities
- 4. Market Factor Analysis
- 4.1. Porters Five Forces
- 4.1.1. Bargaining Power of Suppliers
- 4.1.2. Bargaining Power of Buyers
- 4.1.3. Threat of New Entrants
- 4.1.4. Threat of Substitutes
- 4.1.5. Competitive Rivalry
- 4.2. PESTEL analysis
- 4.3. BCG Analysis
- 4.3.1. Stars (High Growth, High Market Share)
- 4.3.2. Cash Cows (Low Growth, High Market Share)
- 4.3.3. Question Mark (High Growth, Low Market Share)
- 4.3.4. Dogs (Low Growth, Low Market Share)
- 4.4. Ansoff Matrix Analysis
- 4.5. Supply Chain Analysis
- 4.6. Regulatory Landscape
- 4.7. Current Market Potential and Opportunity Assessment (TAM–SAM–SOM Framework)
- 4.8. NRP Analyst Note
- 4.1. Porters Five Forces
- 5. Market Analysis, Insights and Forecast 2021-2033
- 5.1. Market Analysis, Insights and Forecast - by Geography
- 5.1.1. Nigeria
- 5.1.2. Algeria
- 5.1.3. Egypt
- 5.1.4. South Africa
- 5.1.5. Rest of Africa
- 5.2. Market Analysis, Insights and Forecast - by Region
- 5.2.1. Nigeria
- 5.2.2. Algeria
- 5.2.3. Egypt
- 5.2.4. South Africa
- 5.2.5. Rest of Africa
- 5.1. Market Analysis, Insights and Forecast - by Geography
- 6. Africa Natural Gas Industry Analysis, Insights and Forecast, 2021-2033
- 6.1. Market Analysis, Insights and Forecast - by Geography
- 6.1.1. Nigeria
- 6.1.2. Algeria
- 6.1.3. Egypt
- 6.1.4. South Africa
- 6.1.5. Rest of Africa
- 6.1. Market Analysis, Insights and Forecast - by Geography
- 7. Nigeria Africa Natural Gas Industry Analysis, Insights and Forecast, 2020-2032
- 7.1. Market Analysis, Insights and Forecast - by Geography
- 7.1.1. Nigeria
- 7.1.2. Algeria
- 7.1.3. Egypt
- 7.1.4. South Africa
- 7.1.5. Rest of Africa
- 7.1. Market Analysis, Insights and Forecast - by Geography
- 8. Algeria Africa Natural Gas Industry Analysis, Insights and Forecast, 2020-2032
- 8.1. Market Analysis, Insights and Forecast - by Geography
- 8.1.1. Nigeria
- 8.1.2. Algeria
- 8.1.3. Egypt
- 8.1.4. South Africa
- 8.1.5. Rest of Africa
- 8.1. Market Analysis, Insights and Forecast - by Geography
- 9. Egypt Africa Natural Gas Industry Analysis, Insights and Forecast, 2020-2032
- 9.1. Market Analysis, Insights and Forecast - by Geography
- 9.1.1. Nigeria
- 9.1.2. Algeria
- 9.1.3. Egypt
- 9.1.4. South Africa
- 9.1.5. Rest of Africa
- 9.1. Market Analysis, Insights and Forecast - by Geography
- 10. South Africa Africa Natural Gas Industry Analysis, Insights and Forecast, 2020-2032
- 10.1. Market Analysis, Insights and Forecast - by Geography
- 10.1.1. Nigeria
- 10.1.2. Algeria
- 10.1.3. Egypt
- 10.1.4. South Africa
- 10.1.5. Rest of Africa
- 10.1. Market Analysis, Insights and Forecast - by Geography
- 11. Rest of Africa Africa Natural Gas Industry Analysis, Insights and Forecast, 2020-2032
- 11.1. Market Analysis, Insights and Forecast - by Geography
- 11.1.1. Nigeria
- 11.1.2. Algeria
- 11.1.3. Egypt
- 11.1.4. South Africa
- 11.1.5. Rest of Africa
- 11.1. Market Analysis, Insights and Forecast - by Geography
- 12. Competitive Analysis
- 12.1. Company Profiles
- 12.1.1 Anadarko Petroleum Corporation
- 12.1.1.1. Company Overview
- 12.1.1.2. Products
- 12.1.1.3. Company Financials
- 12.1.1.4. SWOT Analysis
- 12.1.2 Shell PLC
- 12.1.2.1. Company Overview
- 12.1.2.2. Products
- 12.1.2.3. Company Financials
- 12.1.2.4. SWOT Analysis
- 12.1.3 Sonatrach
- 12.1.3.1. Company Overview
- 12.1.3.2. Products
- 12.1.3.3. Company Financials
- 12.1.3.4. SWOT Analysis
- 12.1.4 PetroSA
- 12.1.4.1. Company Overview
- 12.1.4.2. Products
- 12.1.4.3. Company Financials
- 12.1.4.4. SWOT Analysis
- 12.1.5 NIPCO PLC
- 12.1.5.1. Company Overview
- 12.1.5.2. Products
- 12.1.5.3. Company Financials
- 12.1.5.4. SWOT Analysis
- 12.1.6 TotalEnergies SE
- 12.1.6.1. Company Overview
- 12.1.6.2. Products
- 12.1.6.3. Company Financials
- 12.1.6.4. SWOT Analysis
- 12.1.7 Egyptian Natural Gas Holding Company
- 12.1.7.1. Company Overview
- 12.1.7.2. Products
- 12.1.7.3. Company Financials
- 12.1.7.4. SWOT Analysis
- 12.1.8 Eni SpA
- 12.1.8.1. Company Overview
- 12.1.8.2. Products
- 12.1.8.3. Company Financials
- 12.1.8.4. SWOT Analysis
- 12.1.9 Nigerian National Petroleum Corporation
- 12.1.9.1. Company Overview
- 12.1.9.2. Products
- 12.1.9.3. Company Financials
- 12.1.9.4. SWOT Analysis
- 12.1.10 Chevron Corporation
- 12.1.10.1. Company Overview
- 12.1.10.2. Products
- 12.1.10.3. Company Financials
- 12.1.10.4. SWOT Analysis
- 12.1.1 Anadarko Petroleum Corporation
- 12.2. Market Entropy
- 12.2.1 Company's Key Areas Served
- 12.2.2 Recent Developments
- 12.3. Company Market Share Analysis 2025
- 12.3.1 Top 5 Companies Market Share Analysis
- 12.3.2 Top 3 Companies Market Share Analysis
- 12.4. List of Potential Customers
- 13. Research Methodology
List of Figures
- Figure 1: Africa Natural Gas Industry Revenue Breakdown (Million, %) by Product 2025 & 2033
- Figure 2: Africa Natural Gas Industry Share (%) by Company 2025
List of Tables
- Table 1: Africa Natural Gas Industry Revenue Million Forecast, by Geography 2020 & 2033
- Table 2: Africa Natural Gas Industry Volume Tonnes Forecast, by Geography 2020 & 2033
- Table 3: Africa Natural Gas Industry Revenue Million Forecast, by Region 2020 & 2033
- Table 4: Africa Natural Gas Industry Volume Tonnes Forecast, by Region 2020 & 2033
- Table 5: Africa Natural Gas Industry Revenue Million Forecast, by Geography 2020 & 2033
- Table 6: Africa Natural Gas Industry Volume Tonnes Forecast, by Geography 2020 & 2033
- Table 7: Africa Natural Gas Industry Revenue Million Forecast, by Country 2020 & 2033
- Table 8: Africa Natural Gas Industry Volume Tonnes Forecast, by Country 2020 & 2033
- Table 9: Africa Natural Gas Industry Revenue Million Forecast, by Geography 2020 & 2033
- Table 10: Africa Natural Gas Industry Volume Tonnes Forecast, by Geography 2020 & 2033
- Table 11: Africa Natural Gas Industry Revenue Million Forecast, by Country 2020 & 2033
- Table 12: Africa Natural Gas Industry Volume Tonnes Forecast, by Country 2020 & 2033
- Table 13: Africa Natural Gas Industry Revenue Million Forecast, by Geography 2020 & 2033
- Table 14: Africa Natural Gas Industry Volume Tonnes Forecast, by Geography 2020 & 2033
- Table 15: Africa Natural Gas Industry Revenue Million Forecast, by Country 2020 & 2033
- Table 16: Africa Natural Gas Industry Volume Tonnes Forecast, by Country 2020 & 2033
- Table 17: Africa Natural Gas Industry Revenue Million Forecast, by Geography 2020 & 2033
- Table 18: Africa Natural Gas Industry Volume Tonnes Forecast, by Geography 2020 & 2033
- Table 19: Africa Natural Gas Industry Revenue Million Forecast, by Country 2020 & 2033
- Table 20: Africa Natural Gas Industry Volume Tonnes Forecast, by Country 2020 & 2033
- Table 21: Africa Natural Gas Industry Revenue Million Forecast, by Geography 2020 & 2033
- Table 22: Africa Natural Gas Industry Volume Tonnes Forecast, by Geography 2020 & 2033
- Table 23: Africa Natural Gas Industry Revenue Million Forecast, by Country 2020 & 2033
- Table 24: Africa Natural Gas Industry Volume Tonnes Forecast, by Country 2020 & 2033
Frequently Asked Questions
1. What is the projected Compound Annual Growth Rate (CAGR) of the Africa Natural Gas Industry?
The projected CAGR is approximately > 4.50%.
2. Which companies are prominent players in the Africa Natural Gas Industry?
Key companies in the market include Anadarko Petroleum Corporation, Shell PLC, Sonatrach, PetroSA, NIPCO PLC, TotalEnergies SE, Egyptian Natural Gas Holding Company, Eni SpA, Nigerian National Petroleum Corporation, Chevron Corporation.
3. What are the main segments of the Africa Natural Gas Industry?
The market segments include Geography.
4. Can you provide details about the market size?
The market size is estimated to be USD XX Million as of 2022.
5. What are some drivers contributing to market growth?
4.; Increasing Amount of Waste Generation. Growing Concern for Waste Management to Meet the Needs for Sustainable Urban Living4.; Increasing Focus on Non-fossil Fuel Sources of Energy.
6. What are the notable trends driving market growth?
Governments Moving Towards the Cleaner Energy Sources is Driving the Market.
7. Are there any restraints impacting market growth?
4.; Expensive Nature of Incinerators.
8. Can you provide examples of recent developments in the market?
In September 2022, The Nigerian National Petroleum Company Limited (NNPCL) announced its intention to sign a Memorandum of Understanding (MoU) on developing a gas pipeline with Morocco's National Office of Hydrocarbons and Mines and the commission of the Economic Community of West African States (ECOWAS). As a result of the MoU, the 7,000-kilometre Nigeria-Morocco gas pipeline project is expected to ramp up gas supply to Europe. Upon the project completion, 3 billion standard cubic feet of gas is expected to be supplied along the coast of West Africa from Nigeria, Benin, Togo, Ghana, Cote d'Ivoire, Liberia, Sierra Leone, Guinea, Guinea Bissau, Gambia, Senegal, Mauritania to Morocco.
9. What pricing options are available for accessing the report?
Pricing options include single-user, multi-user, and enterprise licenses priced at USD 4750, USD 5250, and USD 8750 respectively.
10. Is the market size provided in terms of value or volume?
The market size is provided in terms of value, measured in Million and volume, measured in Tonnes.
11. Are there any specific market keywords associated with the report?
Yes, the market keyword associated with the report is "Africa Natural Gas Industry," which aids in identifying and referencing the specific market segment covered.
12. How do I determine which pricing option suits my needs best?
The pricing options vary based on user requirements and access needs. Individual users may opt for single-user licenses, while businesses requiring broader access may choose multi-user or enterprise licenses for cost-effective access to the report.
13. Are there any additional resources or data provided in the Africa Natural Gas Industry report?
While the report offers comprehensive insights, it's advisable to review the specific contents or supplementary materials provided to ascertain if additional resources or data are available.
14. How can I stay updated on further developments or reports in the Africa Natural Gas Industry?
To stay informed about further developments, trends, and reports in the Africa Natural Gas Industry, consider subscribing to industry newsletters, following relevant companies and organizations, or regularly checking reputable industry news sources and publications.
Methodology
Step 1 - Identification of Relevant Samples Size from Population Database


Step 2 - Approaches for Defining Global Market Size (Value, Volume* & Price*)

Note*: In applicable scenarios
Step 3 - Data Sources
Primary Research
- Web Analytics
- Survey Reports
- Research Institute
- Latest Research Reports
- Opinion Leaders
Secondary Research
- Annual Reports
- White Paper
- Latest Press Release
- Industry Association
- Paid Database
- Investor Presentations

Step 4 - Data Triangulation
Involves using different sources of information in order to increase the validity of a study
These sources are likely to be stakeholders in a program - participants, other researchers, program staff, other community members, and so on.
Then we put all data in single framework & apply various statistical tools to find out the dynamic on the market.
During the analysis stage, feedback from the stakeholder groups would be compared to determine areas of agreement as well as areas of divergence