

Key Insights
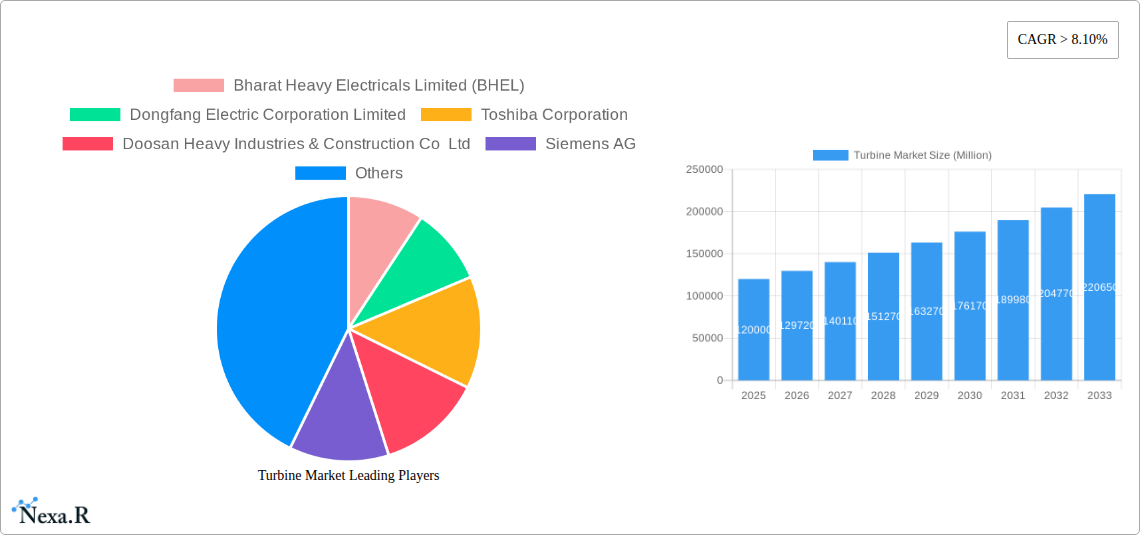
The global turbine market is experiencing robust expansion, driven by escalating demand for clean and renewable energy sources, coupled with advancements in power generation technologies. With a projected Compound Annual Growth Rate (CAGR) exceeding 8.10%, the market is poised for substantial growth, reaching an estimated market size in the billions of dollars by 2033. Key drivers include government initiatives promoting renewable energy adoption, the increasing need for efficient and reliable power generation solutions, and significant investments in upgrading existing power infrastructure. The ongoing energy transition is a pivotal factor, pushing for a shift away from fossil fuels towards cleaner alternatives, where turbines play a central role in harnessing wind, steam, gas, and hydro power. This growth trajectory is further bolstered by technological innovations that enhance turbine efficiency, reduce operational costs, and improve environmental performance, making them increasingly attractive for utility-scale power generation.
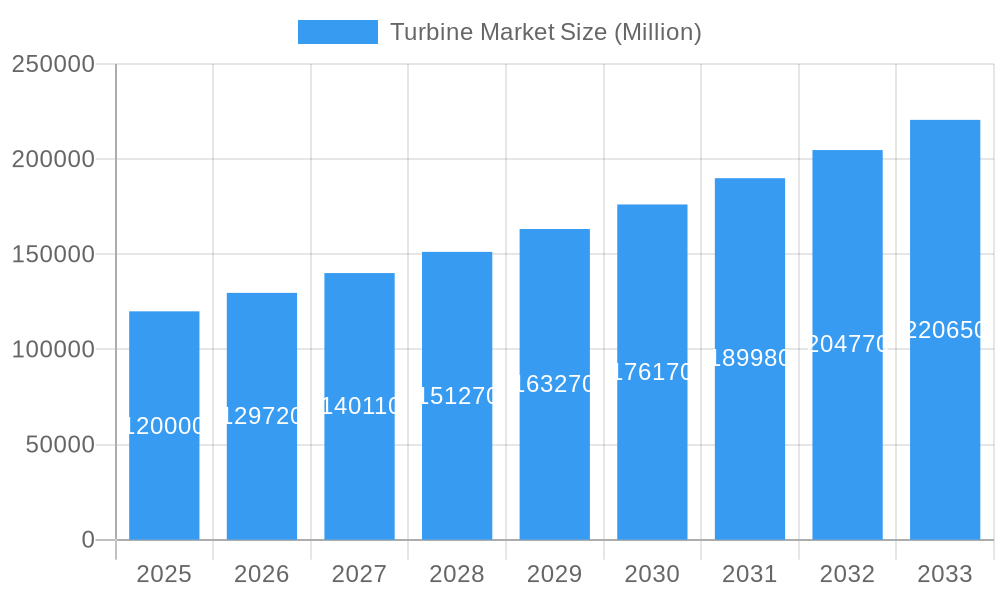
Turbine Market Market Size (In Billion)
The market segmentation reveals a dynamic landscape with wind turbines, particularly offshore variants, leading the charge due to their immense potential for large-scale clean energy production. Steam turbines, vital for combined and steam cycle power plants, and gas turbines for open-cycle applications, continue to be significant contributors, especially in regions with established thermal power infrastructure. Hydro turbines remain a cornerstone of renewable energy in areas with abundant water resources. Geographically, the Asia Pacific region is expected to dominate, fueled by rapid industrialization, growing energy consumption, and aggressive renewable energy targets. North America and Europe are also substantial markets, driven by strong regulatory frameworks and a commitment to decarbonization. Major industry players like Siemens AG, Vestas Wind System A/S, and General Electric Company are at the forefront, investing heavily in research and development to innovate and expand their product portfolios, thereby shaping the competitive and technological evolution of the global turbine market.
Turbine Market Company Market Share
Turbine Market Report Description: Powering the Future of Energy Generation (2019–2033)
Unlock critical insights into the global Turbine Market, a rapidly evolving sector vital for sustainable energy solutions. This comprehensive report, spanning the historical period (2019-2024), base year (2025), and forecast period (2025-2033), provides an in-depth analysis of market dynamics, growth trends, regional dominance, and key players shaping the future of power generation. With a focus on wind turbines, steam turbines, gas turbines, and hydro turbines, this report leverages high-traffic keywords to maximize SEO visibility and deliver actionable intelligence for industry professionals. Explore market segmentation by type, including Onshore and Offshore Wind Turbines, Combined Cycle and Steam Cycle Steam Turbines, Open Cycle Gas Turbines, and Reaction and Impulse Hydro Turbines.
Turbine Market Market Dynamics & Structure
The global Turbine Market is characterized by a dynamic interplay of technological innovation, regulatory shifts, and evolving end-user demands. Market concentration varies across segments, with established giants like General Electric Company, Siemens AG, and Vestas Wind System A/S holding significant shares, particularly in renewable energy. Technological innovation remains a primary driver, fueled by advancements in materials science, aerodynamic efficiency, and digital control systems, enabling higher power outputs and reduced operational costs. Regulatory frameworks, including renewable energy mandates, carbon emission targets, and grid modernization initiatives, significantly influence investment decisions and market expansion. Competitive product substitutes, such as advancements in energy storage and distributed generation, present a growing challenge, necessitating continuous innovation from turbine manufacturers. End-user demographics are shifting towards a greater demand for clean and reliable energy, driving the adoption of advanced turbine technologies. Mergers and acquisitions (M&A) activity is a notable trend, as companies seek to consolidate market positions, acquire new technologies, and expand their global footprint.
- Market Concentration: Moderate to High in established segments (wind, gas), varying by region.
- Technological Innovation Drivers: Increased efficiency, reduced Levelized Cost of Energy (LCOE), enhanced grid integration, digitalization.
- Regulatory Frameworks: Renewable Portfolio Standards (RPS), carbon pricing mechanisms, energy transition policies.
- Competitive Product Substitutes: Advanced battery storage, smart grid technologies, alternative renewable sources.
- End-User Demographics: Growing demand for sustainable energy, industrial expansion, and utility-scale projects.
- M&A Trends: Strategic acquisitions for technology integration and market access.
Turbine Market Growth Trends & Insights
The Turbine Market is poised for substantial growth, propelled by the global imperative for decarbonization and the increasing demand for reliable energy infrastructure. The market size is projected to expand significantly over the forecast period, driven by robust adoption rates of renewable energy technologies, particularly wind and solar. Technological disruptions, such as the development of larger and more efficient wind turbine blades, advancements in combined-cycle gas turbine (CCGT) technology for improved thermal efficiency, and innovations in hydro turbine design for optimal energy capture, are key growth enablers. Consumer behavior shifts, influenced by rising environmental awareness and a preference for sustainable energy solutions, are further bolstering market demand. The integration of smart grid technologies and digital solutions, including AI-powered predictive maintenance and remote monitoring, is enhancing turbine performance and operational reliability, contributing to higher market penetration across various regions. The continuous evolution of hybrid power systems and the increasing investment in offshore wind farms are expected to be significant catalysts for sustained market expansion. The increasing focus on energy security and the desire to reduce reliance on fossil fuels will also play a crucial role in shaping the growth trajectory of the turbine market. The report predicts a Compound Annual Growth Rate (CAGR) of approximately 5.8% for the overall Turbine Market during the forecast period (2025-2033).
Dominant Regions, Countries, or Segments in Turbine Market
The global Turbine Market is witnessing dynamic growth across various regions and segments, with Asia Pacific emerging as the dominant region, largely driven by its rapid industrialization and insatiable demand for electricity. Within this region, China stands out as a pivotal country, leading in the installation of wind turbines, particularly onshore and increasingly offshore, owing to supportive government policies and substantial investments in renewable energy infrastructure. The wind turbine segment, encompassing both onshore and offshore installations, is the primary growth engine, fueled by falling costs, technological advancements, and ambitious renewable energy targets. Europe also plays a significant role, with countries like Germany and Denmark at the forefront of offshore wind development, benefiting from established grids and favorable regulatory environments. In contrast, North America is experiencing robust growth in gas turbines for power generation and a burgeoning wind energy sector, with the United States leading in installed capacity. The steam turbine segment, crucial for thermal power plants, continues to be vital for baseload power, with combined cycle configurations gaining prominence for their efficiency. Hydro turbines, though mature, remain critical in regions with abundant water resources, with reaction and impulse types tailored to specific site conditions. Key drivers for regional dominance include strong economic policies promoting renewable energy, extensive infrastructure development, and favorable government incentives. The market share within these dominant regions is substantial, with Asia Pacific estimated to hold over 40% of the global market share by 2025, and China alone contributing a significant portion of this. The growth potential in these regions is further amplified by ongoing investments in grid modernization and the increasing integration of smart technologies.
Turbine Market Product Landscape
The turbine market is characterized by a relentless pursuit of enhanced efficiency, reduced environmental impact, and improved reliability. Wind turbines are witnessing advancements in blade design, with longer and more aerodynamically optimized structures enabling higher energy capture even at lower wind speeds, while offshore wind turbines are scaling up significantly with enhanced foundation technologies and grid integration solutions. Steam turbines, particularly in combined cycle configurations, are achieving higher thermal efficiencies through advanced metallurgy and sophisticated control systems, minimizing fuel consumption. Gas turbines are evolving with higher firing temperatures and more sophisticated blade cooling techniques, leading to improved performance and lower emissions in open cycle applications. Hydro turbines, both reaction and impulse, are benefiting from advancements in computational fluid dynamics (CFD) for optimized runner designs, leading to increased power output and operational flexibility. The unique selling propositions of these evolving products lie in their increased energy yield, extended lifespan, reduced maintenance requirements, and enhanced compatibility with grid demands.
Key Drivers, Barriers & Challenges in Turbine Market
Key Drivers: The global shift towards renewable energy sources, driven by climate change concerns and government mandates, is the primary growth accelerator for the turbine market. Technological advancements in turbine efficiency, reduced manufacturing costs, and favorable government policies, including tax incentives and subsidies, further propel market expansion. The increasing demand for electricity to support industrial growth and population expansion, coupled with the need for grid stability and energy security, also fuels demand.
Key Barriers & Challenges: Supply chain disruptions, particularly for critical components and raw materials, pose a significant challenge, impacting production timelines and costs. Stringent environmental regulations and permitting processes can lead to project delays. Intense competition among manufacturers and the threat of alternative energy technologies, such as advanced battery storage, can exert downward pressure on pricing. Furthermore, the high upfront investment required for large-scale turbine installations and the need for grid infrastructure upgrades present financial hurdles.
Emerging Opportunities in Turbine Market
Emerging opportunities in the Turbine Market are predominantly centered around the expansion of offshore wind power, driven by technological advancements and the pursuit of higher capacity factors. The growing interest in hybrid energy systems, combining wind, solar, and energy storage, presents a new avenue for turbine manufacturers to offer integrated solutions. Furthermore, the retrofitting and repowering of aging turbine installations, particularly in established onshore wind farms, offer significant market potential. The increasing adoption of distributed energy generation and microgrids in remote or developing regions also opens up niche opportunities for smaller, more adaptable turbine solutions. The development of advanced materials and additive manufacturing techniques is also paving the way for more cost-effective and efficient turbine components.
Growth Accelerators in the Turbine Market Industry
Technological breakthroughs in blade design for wind turbines, leading to enhanced energy capture and reduced noise pollution, are significant growth accelerators. The increasing deployment of offshore wind farms, facilitated by innovations in floating platform technology and subsea transmission, is expanding the addressable market. Strategic partnerships and collaborations between turbine manufacturers, energy developers, and grid operators are crucial for accelerating project development and deployment. Market expansion strategies, including entry into emerging economies with growing energy demands and supportive policies, are also key growth drivers. The ongoing digitalization of the energy sector, enabling smart grid integration and predictive maintenance, further enhances the value proposition of turbine technologies.
Key Players Shaping the Turbine Market Market
- Bharat Heavy Electricals Limited (BHEL)
- Dongfang Electric Corporation Limited
- Toshiba Corporation
- Doosan Heavy Industries & Construction Co Ltd
- Siemens AG
- Vestas Wind System A/S
- Mitsubishi Hitachi Power Systems Ltd (MHPS)
- General Electric Company
- Enercon GmbH
- Harbin Electric Company Limited
Notable Milestones in Turbine Market Sector
- 2019: Launch of GE's Haliade-X offshore wind turbine prototype, setting a new benchmark for power output.
- 2020: Vestas surpasses 100 GW of installed wind capacity globally.
- 2021: Siemens Gamesa announces plans for the SG 14-222 DD offshore wind turbine, further pushing power capacity limits.
- 2022: China’s Dongfang Electric Corporation achieves significant advancements in high-efficiency steam turbine technology.
- 2023: Mitsubishi Hitachi Power Systems (MHPS) introduces advanced gas turbine technology for reduced emissions and enhanced efficiency.
- 2024: Increased investment and policy support for green hydrogen production, driving demand for electrolysis-powered turbines.
In-Depth Turbine Market Market Outlook
The Turbine Market is set for robust expansion, driven by the global transition to sustainable energy and significant technological advancements. Growth accelerators such as the burgeoning offshore wind sector, coupled with innovative hybrid energy solutions and the retrofitting of existing assets, will define the market's trajectory. Strategic partnerships and expansion into emerging economies will further fuel this growth. The outlook is characterized by increasing efficiency, reduced environmental impact, and enhanced grid integration, positioning turbines as pivotal components of a cleaner and more secure energy future. The estimated market value for 2025 is approximately $65,000 Million units, with a projected CAGR of 5.8% through 2033, indicating substantial future potential.
Turbine Market Segmentation
-
1. Type
-
1.1. Wind Turbines
- 1.1.1. Onshore
- 1.1.2. Offshore
-
1.2. Steam Turbines
- 1.2.1. Combined Cycle
- 1.2.2. Steam Cycle
-
1.3. Gas Turbines
- 1.3.1. Open Cycle
-
1.4. Hydro Turbines
- 1.4.1. Reaction
- 1.4.2. Impulse
-
1.1. Wind Turbines
Turbine Market Segmentation By Geography
- 1. North America
- 2. Europe
- 3. Asia Pacific
- 4. South America
- 5. Middle East and Africa
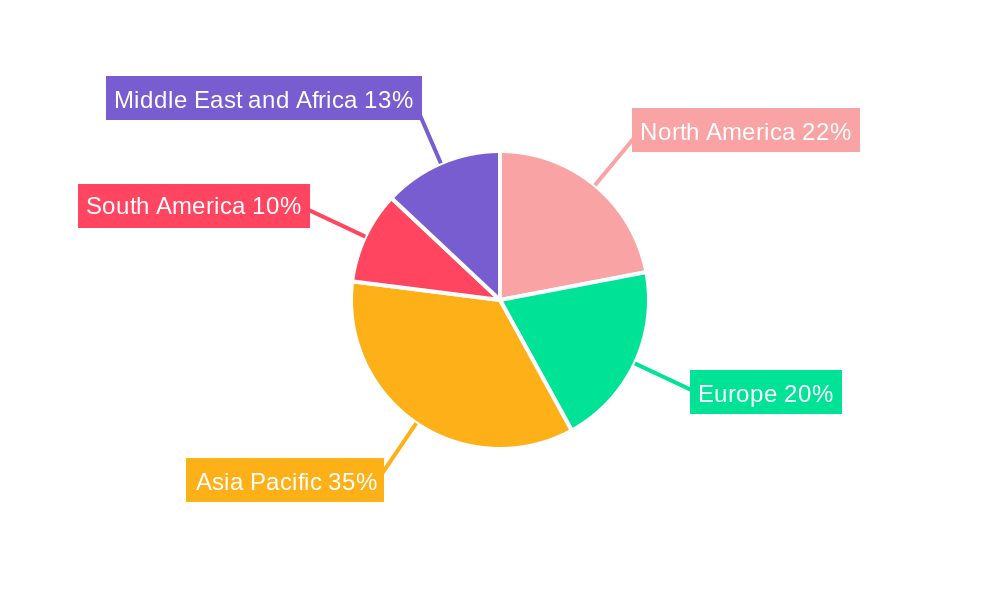
Turbine Market Regional Market Share
Geographic Coverage of Turbine Market
Turbine Market REPORT HIGHLIGHTS
| Aspects | Details |
|---|---|
| Study Period | 2020-2034 |
| Base Year | 2025 |
| Estimated Year | 2026 |
| Forecast Period | 2026-2034 |
| Historical Period | 2020-2025 |
| Growth Rate | CAGR of 6.7% from 2020-2034 |
| Segmentation |
|
Table of Contents
- 1. Introduction
- 1.1. Research Scope
- 1.2. Market Segmentation
- 1.3. Research Objective
- 1.4. Definitions and Assumptions
- 2. Executive Summary
- 2.1. Market Snapshot
- 3. Market Dynamics
- 3.1. Market Drivers
- 3.2. Market Restrains
- 3.3. Market Trends
- 3.4. Market Opportunities
- 4. Market Factor Analysis
- 4.1. Porters Five Forces
- 4.1.1. Bargaining Power of Suppliers
- 4.1.2. Bargaining Power of Buyers
- 4.1.3. Threat of New Entrants
- 4.1.4. Threat of Substitutes
- 4.1.5. Competitive Rivalry
- 4.2. PESTEL analysis
- 4.3. BCG Analysis
- 4.3.1. Stars (High Growth, High Market Share)
- 4.3.2. Cash Cows (Low Growth, High Market Share)
- 4.3.3. Question Mark (High Growth, Low Market Share)
- 4.3.4. Dogs (Low Growth, Low Market Share)
- 4.4. Ansoff Matrix Analysis
- 4.5. Supply Chain Analysis
- 4.6. Regulatory Landscape
- 4.7. Current Market Potential and Opportunity Assessment (TAM–SAM–SOM Framework)
- 4.8. NRP Analyst Note
- 4.1. Porters Five Forces
- 5. Market Analysis, Insights and Forecast 2021-2033
- 5.1. Market Analysis, Insights and Forecast - by Type
- 5.1.1. Wind Turbines
- 5.1.1.1. Onshore
- 5.1.1.2. Offshore
- 5.1.2. Steam Turbines
- 5.1.2.1. Combined Cycle
- 5.1.2.2. Steam Cycle
- 5.1.3. Gas Turbines
- 5.1.3.1. Open Cycle
- 5.1.4. Hydro Turbines
- 5.1.4.1. Reaction
- 5.1.4.2. Impulse
- 5.1.1. Wind Turbines
- 5.2. Market Analysis, Insights and Forecast - by Region
- 5.2.1. North America
- 5.2.2. Europe
- 5.2.3. Asia Pacific
- 5.2.4. South America
- 5.2.5. Middle East and Africa
- 5.1. Market Analysis, Insights and Forecast - by Type
- 6. Global Turbine Market Analysis, Insights and Forecast, 2021-2033
- 6.1. Market Analysis, Insights and Forecast - by Type
- 6.1.1. Wind Turbines
- 6.1.1.1. Onshore
- 6.1.1.2. Offshore
- 6.1.2. Steam Turbines
- 6.1.2.1. Combined Cycle
- 6.1.2.2. Steam Cycle
- 6.1.3. Gas Turbines
- 6.1.3.1. Open Cycle
- 6.1.4. Hydro Turbines
- 6.1.4.1. Reaction
- 6.1.4.2. Impulse
- 6.1.1. Wind Turbines
- 6.1. Market Analysis, Insights and Forecast - by Type
- 7. North America Turbine Market Analysis, Insights and Forecast, 2020-2032
- 7.1. Market Analysis, Insights and Forecast - by Type
- 7.1.1. Wind Turbines
- 7.1.1.1. Onshore
- 7.1.1.2. Offshore
- 7.1.2. Steam Turbines
- 7.1.2.1. Combined Cycle
- 7.1.2.2. Steam Cycle
- 7.1.3. Gas Turbines
- 7.1.3.1. Open Cycle
- 7.1.4. Hydro Turbines
- 7.1.4.1. Reaction
- 7.1.4.2. Impulse
- 7.1.1. Wind Turbines
- 7.1. Market Analysis, Insights and Forecast - by Type
- 8. Europe Turbine Market Analysis, Insights and Forecast, 2020-2032
- 8.1. Market Analysis, Insights and Forecast - by Type
- 8.1.1. Wind Turbines
- 8.1.1.1. Onshore
- 8.1.1.2. Offshore
- 8.1.2. Steam Turbines
- 8.1.2.1. Combined Cycle
- 8.1.2.2. Steam Cycle
- 8.1.3. Gas Turbines
- 8.1.3.1. Open Cycle
- 8.1.4. Hydro Turbines
- 8.1.4.1. Reaction
- 8.1.4.2. Impulse
- 8.1.1. Wind Turbines
- 8.1. Market Analysis, Insights and Forecast - by Type
- 9. Asia Pacific Turbine Market Analysis, Insights and Forecast, 2020-2032
- 9.1. Market Analysis, Insights and Forecast - by Type
- 9.1.1. Wind Turbines
- 9.1.1.1. Onshore
- 9.1.1.2. Offshore
- 9.1.2. Steam Turbines
- 9.1.2.1. Combined Cycle
- 9.1.2.2. Steam Cycle
- 9.1.3. Gas Turbines
- 9.1.3.1. Open Cycle
- 9.1.4. Hydro Turbines
- 9.1.4.1. Reaction
- 9.1.4.2. Impulse
- 9.1.1. Wind Turbines
- 9.1. Market Analysis, Insights and Forecast - by Type
- 10. South America Turbine Market Analysis, Insights and Forecast, 2020-2032
- 10.1. Market Analysis, Insights and Forecast - by Type
- 10.1.1. Wind Turbines
- 10.1.1.1. Onshore
- 10.1.1.2. Offshore
- 10.1.2. Steam Turbines
- 10.1.2.1. Combined Cycle
- 10.1.2.2. Steam Cycle
- 10.1.3. Gas Turbines
- 10.1.3.1. Open Cycle
- 10.1.4. Hydro Turbines
- 10.1.4.1. Reaction
- 10.1.4.2. Impulse
- 10.1.1. Wind Turbines
- 10.1. Market Analysis, Insights and Forecast - by Type
- 11. Middle East and Africa Turbine Market Analysis, Insights and Forecast, 2020-2032
- 11.1. Market Analysis, Insights and Forecast - by Type
- 11.1.1. Wind Turbines
- 11.1.1.1. Onshore
- 11.1.1.2. Offshore
- 11.1.2. Steam Turbines
- 11.1.2.1. Combined Cycle
- 11.1.2.2. Steam Cycle
- 11.1.3. Gas Turbines
- 11.1.3.1. Open Cycle
- 11.1.4. Hydro Turbines
- 11.1.4.1. Reaction
- 11.1.4.2. Impulse
- 11.1.1. Wind Turbines
- 11.1. Market Analysis, Insights and Forecast - by Type
- 12. Competitive Analysis
- 12.1. Company Profiles
- 12.1.1 Bharat Heavy Electricals Limited (BHEL)
- 12.1.1.1. Company Overview
- 12.1.1.2. Products
- 12.1.1.3. Company Financials
- 12.1.1.4. SWOT Analysis
- 12.1.2 Dongfang Electric Corporation Limited
- 12.1.2.1. Company Overview
- 12.1.2.2. Products
- 12.1.2.3. Company Financials
- 12.1.2.4. SWOT Analysis
- 12.1.3 Toshiba Corporation
- 12.1.3.1. Company Overview
- 12.1.3.2. Products
- 12.1.3.3. Company Financials
- 12.1.3.4. SWOT Analysis
- 12.1.4 Doosan Heavy Industries & Construction Co Ltd
- 12.1.4.1. Company Overview
- 12.1.4.2. Products
- 12.1.4.3. Company Financials
- 12.1.4.4. SWOT Analysis
- 12.1.5 Siemens AG
- 12.1.5.1. Company Overview
- 12.1.5.2. Products
- 12.1.5.3. Company Financials
- 12.1.5.4. SWOT Analysis
- 12.1.6 Vestas Wind System A/S*List Not Exhaustive
- 12.1.6.1. Company Overview
- 12.1.6.2. Products
- 12.1.6.3. Company Financials
- 12.1.6.4. SWOT Analysis
- 12.1.7 Mitsubishi Hitachi Power Systems Ltd (MHPS)
- 12.1.7.1. Company Overview
- 12.1.7.2. Products
- 12.1.7.3. Company Financials
- 12.1.7.4. SWOT Analysis
- 12.1.8 General Electric Company
- 12.1.8.1. Company Overview
- 12.1.8.2. Products
- 12.1.8.3. Company Financials
- 12.1.8.4. SWOT Analysis
- 12.1.9 Enercon GmbH
- 12.1.9.1. Company Overview
- 12.1.9.2. Products
- 12.1.9.3. Company Financials
- 12.1.9.4. SWOT Analysis
- 12.1.10 Harbin Electric Company Limited
- 12.1.10.1. Company Overview
- 12.1.10.2. Products
- 12.1.10.3. Company Financials
- 12.1.10.4. SWOT Analysis
- 12.1.1 Bharat Heavy Electricals Limited (BHEL)
- 12.2. Market Entropy
- 12.2.1 Company's Key Areas Served
- 12.2.2 Recent Developments
- 12.3. Company Market Share Analysis 2025
- 12.3.1 Top 5 Companies Market Share Analysis
- 12.3.2 Top 3 Companies Market Share Analysis
- 12.4. List of Potential Customers
- 13. Research Methodology
List of Figures
- Figure 1: Global Turbine Market Revenue Breakdown (billion, %) by Region 2025 & 2033
- Figure 2: Global Turbine Market Volume Breakdown (Megawatt, %) by Region 2025 & 2033
- Figure 3: North America Turbine Market Revenue (billion), by Type 2025 & 2033
- Figure 4: North America Turbine Market Volume (Megawatt), by Type 2025 & 2033
- Figure 5: North America Turbine Market Revenue Share (%), by Type 2025 & 2033
- Figure 6: North America Turbine Market Volume Share (%), by Type 2025 & 2033
- Figure 7: North America Turbine Market Revenue (billion), by Country 2025 & 2033
- Figure 8: North America Turbine Market Volume (Megawatt), by Country 2025 & 2033
- Figure 9: North America Turbine Market Revenue Share (%), by Country 2025 & 2033
- Figure 10: North America Turbine Market Volume Share (%), by Country 2025 & 2033
- Figure 11: Europe Turbine Market Revenue (billion), by Type 2025 & 2033
- Figure 12: Europe Turbine Market Volume (Megawatt), by Type 2025 & 2033
- Figure 13: Europe Turbine Market Revenue Share (%), by Type 2025 & 2033
- Figure 14: Europe Turbine Market Volume Share (%), by Type 2025 & 2033
- Figure 15: Europe Turbine Market Revenue (billion), by Country 2025 & 2033
- Figure 16: Europe Turbine Market Volume (Megawatt), by Country 2025 & 2033
- Figure 17: Europe Turbine Market Revenue Share (%), by Country 2025 & 2033
- Figure 18: Europe Turbine Market Volume Share (%), by Country 2025 & 2033
- Figure 19: Asia Pacific Turbine Market Revenue (billion), by Type 2025 & 2033
- Figure 20: Asia Pacific Turbine Market Volume (Megawatt), by Type 2025 & 2033
- Figure 21: Asia Pacific Turbine Market Revenue Share (%), by Type 2025 & 2033
- Figure 22: Asia Pacific Turbine Market Volume Share (%), by Type 2025 & 2033
- Figure 23: Asia Pacific Turbine Market Revenue (billion), by Country 2025 & 2033
- Figure 24: Asia Pacific Turbine Market Volume (Megawatt), by Country 2025 & 2033
- Figure 25: Asia Pacific Turbine Market Revenue Share (%), by Country 2025 & 2033
- Figure 26: Asia Pacific Turbine Market Volume Share (%), by Country 2025 & 2033
- Figure 27: South America Turbine Market Revenue (billion), by Type 2025 & 2033
- Figure 28: South America Turbine Market Volume (Megawatt), by Type 2025 & 2033
- Figure 29: South America Turbine Market Revenue Share (%), by Type 2025 & 2033
- Figure 30: South America Turbine Market Volume Share (%), by Type 2025 & 2033
- Figure 31: South America Turbine Market Revenue (billion), by Country 2025 & 2033
- Figure 32: South America Turbine Market Volume (Megawatt), by Country 2025 & 2033
- Figure 33: South America Turbine Market Revenue Share (%), by Country 2025 & 2033
- Figure 34: South America Turbine Market Volume Share (%), by Country 2025 & 2033
- Figure 35: Middle East and Africa Turbine Market Revenue (billion), by Type 2025 & 2033
- Figure 36: Middle East and Africa Turbine Market Volume (Megawatt), by Type 2025 & 2033
- Figure 37: Middle East and Africa Turbine Market Revenue Share (%), by Type 2025 & 2033
- Figure 38: Middle East and Africa Turbine Market Volume Share (%), by Type 2025 & 2033
- Figure 39: Middle East and Africa Turbine Market Revenue (billion), by Country 2025 & 2033
- Figure 40: Middle East and Africa Turbine Market Volume (Megawatt), by Country 2025 & 2033
- Figure 41: Middle East and Africa Turbine Market Revenue Share (%), by Country 2025 & 2033
- Figure 42: Middle East and Africa Turbine Market Volume Share (%), by Country 2025 & 2033
List of Tables
- Table 1: Global Turbine Market Revenue billion Forecast, by Type 2020 & 2033
- Table 2: Global Turbine Market Volume Megawatt Forecast, by Type 2020 & 2033
- Table 3: Global Turbine Market Revenue billion Forecast, by Region 2020 & 2033
- Table 4: Global Turbine Market Volume Megawatt Forecast, by Region 2020 & 2033
- Table 5: Global Turbine Market Revenue billion Forecast, by Type 2020 & 2033
- Table 6: Global Turbine Market Volume Megawatt Forecast, by Type 2020 & 2033
- Table 7: Global Turbine Market Revenue billion Forecast, by Country 2020 & 2033
- Table 8: Global Turbine Market Volume Megawatt Forecast, by Country 2020 & 2033
- Table 9: Global Turbine Market Revenue billion Forecast, by Type 2020 & 2033
- Table 10: Global Turbine Market Volume Megawatt Forecast, by Type 2020 & 2033
- Table 11: Global Turbine Market Revenue billion Forecast, by Country 2020 & 2033
- Table 12: Global Turbine Market Volume Megawatt Forecast, by Country 2020 & 2033
- Table 13: Global Turbine Market Revenue billion Forecast, by Type 2020 & 2033
- Table 14: Global Turbine Market Volume Megawatt Forecast, by Type 2020 & 2033
- Table 15: Global Turbine Market Revenue billion Forecast, by Country 2020 & 2033
- Table 16: Global Turbine Market Volume Megawatt Forecast, by Country 2020 & 2033
- Table 17: Global Turbine Market Revenue billion Forecast, by Type 2020 & 2033
- Table 18: Global Turbine Market Volume Megawatt Forecast, by Type 2020 & 2033
- Table 19: Global Turbine Market Revenue billion Forecast, by Country 2020 & 2033
- Table 20: Global Turbine Market Volume Megawatt Forecast, by Country 2020 & 2033
- Table 21: Global Turbine Market Revenue billion Forecast, by Type 2020 & 2033
- Table 22: Global Turbine Market Volume Megawatt Forecast, by Type 2020 & 2033
- Table 23: Global Turbine Market Revenue billion Forecast, by Country 2020 & 2033
- Table 24: Global Turbine Market Volume Megawatt Forecast, by Country 2020 & 2033
Frequently Asked Questions
1. What is the projected Compound Annual Growth Rate (CAGR) of the Turbine Market?
The projected CAGR is approximately 6.7%.
2. Which companies are prominent players in the Turbine Market?
Key companies in the market include Bharat Heavy Electricals Limited (BHEL), Dongfang Electric Corporation Limited, Toshiba Corporation, Doosan Heavy Industries & Construction Co Ltd, Siemens AG, Vestas Wind System A/S*List Not Exhaustive, Mitsubishi Hitachi Power Systems Ltd (MHPS), General Electric Company, Enercon GmbH, Harbin Electric Company Limited.
3. What are the main segments of the Turbine Market?
The market segments include Type.
4. Can you provide details about the market size?
The market size is estimated to be USD 185 billion as of 2022.
5. What are some drivers contributing to market growth?
Declining Costs of Solar Technologies4.; Demand for Decentralized Solar Energy Systems.
6. What are the notable trends driving market growth?
Wind Turbine Segment to Grow at the Fastest Rate.
7. Are there any restraints impacting market growth?
Absence of Any New Initiatives in the Country.
8. Can you provide examples of recent developments in the market?
N/A
9. What pricing options are available for accessing the report?
Pricing options include single-user, multi-user, and enterprise licenses priced at USD 4750, USD 5250, and USD 8750 respectively.
10. Is the market size provided in terms of value or volume?
The market size is provided in terms of value, measured in billion and volume, measured in Megawatt.
11. Are there any specific market keywords associated with the report?
Yes, the market keyword associated with the report is "Turbine Market," which aids in identifying and referencing the specific market segment covered.
12. How do I determine which pricing option suits my needs best?
The pricing options vary based on user requirements and access needs. Individual users may opt for single-user licenses, while businesses requiring broader access may choose multi-user or enterprise licenses for cost-effective access to the report.
13. Are there any additional resources or data provided in the Turbine Market report?
While the report offers comprehensive insights, it's advisable to review the specific contents or supplementary materials provided to ascertain if additional resources or data are available.
14. How can I stay updated on further developments or reports in the Turbine Market?
To stay informed about further developments, trends, and reports in the Turbine Market, consider subscribing to industry newsletters, following relevant companies and organizations, or regularly checking reputable industry news sources and publications.
Methodology
Step 1 - Identification of Relevant Samples Size from Population Database


Step 2 - Approaches for Defining Global Market Size (Value, Volume* & Price*)

Note*: In applicable scenarios
Step 3 - Data Sources
Primary Research
- Web Analytics
- Survey Reports
- Research Institute
- Latest Research Reports
- Opinion Leaders
Secondary Research
- Annual Reports
- White Paper
- Latest Press Release
- Industry Association
- Paid Database
- Investor Presentations

Step 4 - Data Triangulation
Involves using different sources of information in order to increase the validity of a study
These sources are likely to be stakeholders in a program - participants, other researchers, program staff, other community members, and so on.
Then we put all data in single framework & apply various statistical tools to find out the dynamic on the market.
During the analysis stage, feedback from the stakeholder groups would be compared to determine areas of agreement as well as areas of divergence