

Key Insights
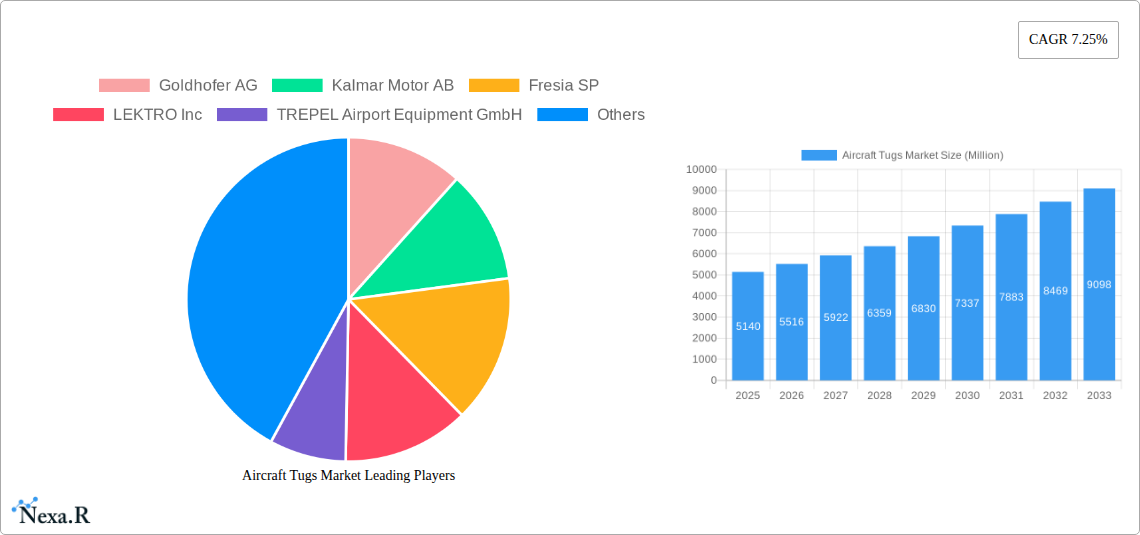
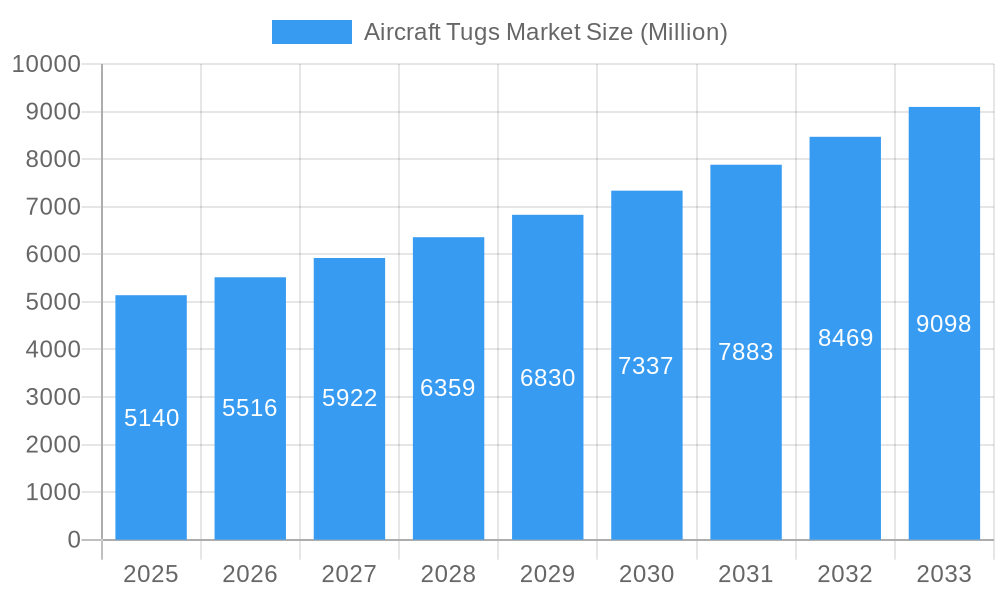
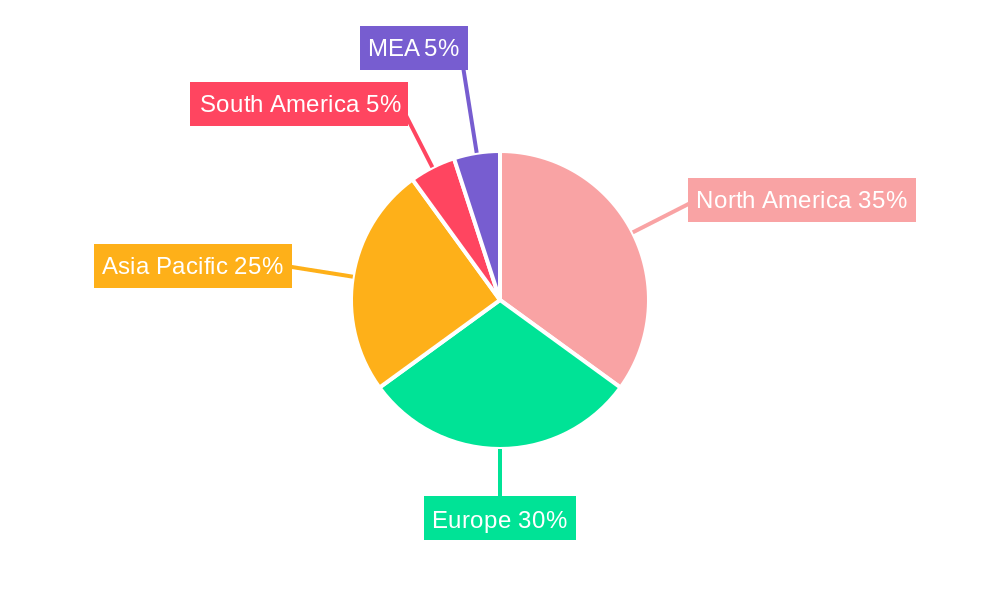
The global Aircraft Tugs market, valued at $5.14 billion in 2025, is projected to experience robust growth, driven by a compound annual growth rate (CAGR) of 7.25% from 2025 to 2033. This expansion is fueled by several key factors. The increasing air passenger traffic globally necessitates efficient ground handling operations, directly boosting demand for aircraft tugs. Furthermore, the aviation industry's ongoing focus on improving operational efficiency and reducing turnaround times is a significant driver. The adoption of advanced technologies, such as electric and hybrid-electric tugs, is gaining momentum, contributing to market growth by offering environmental benefits and reduced operational costs. These advancements are particularly significant in regions with stringent emission regulations. Market segmentation reveals a strong preference for conventional tugs, although the towbarless and electric segments are witnessing accelerated growth, indicating a shift towards more sustainable and technologically advanced solutions. The regional distribution of market share likely reflects established aviation hubs and their infrastructure development needs. North America and Europe currently hold a significant portion of the market share, although rapid growth is anticipated in the Asia-Pacific region due to infrastructure development and increasing air travel in developing economies.
Aircraft Tugs Market Market Size (In Billion)
Competition within the market is relatively high, with established players such as Goldhofer AG, Kalmar Motor AB, and Textron Inc. (Ground Support Equipment Inc.) alongside other smaller companies, and emerging technology providers. This competitive landscape fosters innovation and encourages the development of more efficient, cost-effective, and environmentally friendly aircraft tugs. Continued expansion of airports worldwide, increased investments in airport infrastructure modernization, and a rising focus on sustainable aviation practices are expected to contribute positively to market growth throughout the forecast period. The growth trajectory suggests that the market will likely exceed $9 billion by 2033, presenting substantial opportunities for established players and new entrants alike.
Aircraft Tugs Market Company Market Share
Aircraft Tugs Market: A Comprehensive Report (2019-2033)
This comprehensive report provides a detailed analysis of the Aircraft Tugs Market, encompassing market dynamics, growth trends, regional dominance, product landscape, key players, and future outlook. The study period covers 2019-2033, with 2025 as the base and estimated year. The report segments the market by type (Conventional, Towbarless) and power source (Diesel, Gas, Electric), offering granular insights into this crucial segment of the ground support equipment (GSE) industry. The total market value is projected to reach xx Million units by 2033.
Aircraft Tugs Market Dynamics & Structure
The Aircraft Tugs Market exhibits a moderately concentrated structure, with a few major players holding significant market share. Technological innovation, particularly in electric and autonomous tugs, is a key driver. Stringent environmental regulations are pushing the adoption of cleaner technologies, while the increasing air passenger traffic fuels demand. The market also faces competition from substitute technologies and logistical challenges. M&A activity remains moderate, with a few strategic acquisitions reported in the recent past (e.g., xx deals in the last 5 years, representing xx% of market value).
- Market Concentration: Moderately concentrated, with top 5 players holding approximately xx% market share.
- Technological Innovation: Focus on electric, autonomous, and remotely controlled tugs to reduce emissions and improve efficiency.
- Regulatory Framework: Stringent emission norms driving adoption of cleaner technologies.
- Competitive Substitutes: Limited direct substitutes, but alternative ground handling methods exist.
- End-User Demographics: Primarily airports, airlines, and ground handling service providers.
- M&A Trends: Moderate activity, with strategic acquisitions focused on technology and geographic expansion. Innovation barriers include high R&D costs and the need for rigorous safety certifications.
Aircraft Tugs Market Growth Trends & Insights
The Aircraft Tugs Market has witnessed steady growth over the historical period (2019-2024), driven by increasing air travel and airport infrastructure development. The market size is projected to grow at a Compound Annual Growth Rate (CAGR) of xx% during the forecast period (2025-2033), reaching xx Million units by 2033. The adoption rate of electric and towbarless tugs is increasing, driven by environmental concerns and operational efficiency gains. Consumer behavior is shifting toward sustainable and technologically advanced solutions. This trend is further fueled by rising fuel costs and government initiatives promoting green technologies in the aviation sector. Market penetration of electric tugs is currently at xx%, projected to reach xx% by 2033.
Dominant Regions, Countries, or Segments in Aircraft Tugs Market
North America and Europe currently dominate the Aircraft Tugs Market, driven by high air passenger traffic, well-established airport infrastructure, and strong regulatory frameworks promoting sustainable practices. The conventional segment holds the largest market share due to its maturity and cost-effectiveness. However, the towbarless segment is experiencing faster growth due to its operational advantages and increased efficiency. Electric-powered tugs are gaining traction, especially in regions with stricter emission regulations.
- North America: High adoption of advanced technologies and stringent environmental regulations.
- Europe: Large and well-developed aviation infrastructure, strong emphasis on sustainability.
- Asia-Pacific: Rapid growth potential driven by increasing air travel and airport expansion.
- Conventional Tugs: Largest market share due to cost-effectiveness and established technology.
- Towbarless Tugs: Fastest growing segment due to increased efficiency and ease of operation.
- Electric Tugs: Increasing adoption driven by environmental concerns and government incentives.
Aircraft Tugs Market Product Landscape
Aircraft tugs are evolving from basic diesel-powered units to sophisticated electric and autonomous vehicles. Innovations focus on enhanced safety features, improved maneuverability, reduced emissions, and remote control capabilities. Towbarless tugs offer streamlined operations, while electric tugs contribute to reduced carbon footprint. Key performance indicators include towing capacity, fuel efficiency, maneuverability, and ease of operation. Unique selling propositions are centered around efficiency, safety, environmental impact and automation.
Key Drivers, Barriers & Challenges in Aircraft Tugs Market
Key Drivers:
- Growing air passenger traffic and airport expansion.
- Increasing demand for efficient and environmentally friendly ground support equipment.
- Stringent emission regulations and government incentives for green technologies.
- Technological advancements in electric and autonomous tugs.
Key Challenges:
- High initial investment costs associated with electric and autonomous tugs.
- Supply chain disruptions impacting component availability and production timelines.
- Regulatory hurdles and certification requirements for new technologies.
- Competition from established players and the emergence of new entrants. The impact of these challenges is estimated to be a xx% reduction in market growth rate over the next 5 years.
Emerging Opportunities in Aircraft Tugs Market
- Growing demand for electric and autonomous tugs in developing economies.
- Increased adoption of remote-controlled and pilot-controlled systems for enhanced safety.
- Development of specialized tugs for narrow-body and wide-body aircraft.
- Expansion into new markets and underserved regions. The untapped market potential is estimated to be xx Million units by 2033.
Growth Accelerators in the Aircraft Tugs Market Industry
Technological advancements, strategic partnerships between manufacturers and airlines, and expansion into emerging markets are key catalysts for long-term growth. The integration of advanced technologies such as AI and IoT offers opportunities for enhanced automation, remote monitoring, and predictive maintenance. Government support and initiatives promoting sustainable aviation further accelerate market expansion.
Key Players Shaping the Aircraft Tugs Market Market
- Goldhofer AG
- Kalmar Motor AB
- Fresia SP
- LEKTRO Inc
- TREPEL Airport Equipment GmbH
- Tronair Inc
- John Bean Technologies Corp
- Tinka Resources Limited
- Textron Inc (Ground Support Equipment Inc)
- Airtug LLC
- MULAG
- MOTOTOK
Notable Milestones in Aircraft Tugs Market Sector
- June 2023: Lokpriyo Gopinath Bordoloi International Airport launched its first electric vehicle tug, signaling a shift towards sustainable ground operations.
- April 2023: Air India announced the use of pilot-controlled tow tractors for Airbus A320 maneuvering, highlighting a focus on emission reduction strategies.
In-Depth Aircraft Tugs Market Market Outlook
The Aircraft Tugs Market is poised for robust growth, driven by ongoing technological innovations, increasing environmental awareness, and the expansion of global air travel. Strategic partnerships, mergers and acquisitions, and the entry of new players will further shape the market landscape. Opportunities exist for companies that can offer efficient, sustainable, and technologically advanced solutions to meet the evolving needs of the aviation industry. The market is expected to witness a significant shift towards electric and autonomous tugs, presenting considerable opportunities for growth and innovation.
Aircraft Tugs Market Segmentation
- 1. Production Analysis
- 2. Consumption Analysis
- 3. Import Market Analysis (Value & Volume)
- 4. Export Market Analysis (Value & Volume)
- 5. Price Trend Analysis
Aircraft Tugs Market Segmentation By Geography
-
1. North America
- 1.1. United States
- 1.2. Canada
- 1.3. Mexico
-
2. South America
- 2.1. Brazil
- 2.2. Argentina
- 2.3. Rest of South America
-
3. Europe
- 3.1. United Kingdom
- 3.2. Germany
- 3.3. France
- 3.4. Italy
- 3.5. Spain
- 3.6. Russia
- 3.7. Benelux
- 3.8. Nordics
- 3.9. Rest of Europe
-
4. Middle East & Africa
- 4.1. Turkey
- 4.2. Israel
- 4.3. GCC
- 4.4. North Africa
- 4.5. South Africa
- 4.6. Rest of Middle East & Africa
-
5. Asia Pacific
- 5.1. China
- 5.2. India
- 5.3. Japan
- 5.4. South Korea
- 5.5. ASEAN
- 5.6. Oceania
- 5.7. Rest of Asia Pacific
Aircraft Tugs Market Regional Market Share
Geographic Coverage of Aircraft Tugs Market
Aircraft Tugs Market REPORT HIGHLIGHTS
| Aspects | Details |
|---|---|
| Study Period | 2020-2034 |
| Base Year | 2025 |
| Estimated Year | 2026 |
| Forecast Period | 2026-2034 |
| Historical Period | 2020-2025 |
| Growth Rate | CAGR of 7.25% from 2020-2034 |
| Segmentation |
|
Table of Contents
- 1. Introduction
- 1.1. Research Scope
- 1.2. Market Segmentation
- 1.3. Research Objective
- 1.4. Definitions and Assumptions
- 2. Executive Summary
- 2.1. Market Snapshot
- 3. Market Dynamics
- 3.1. Market Drivers
- 3.2. Market Restrains
- 3.3. Market Trends
- 3.4. Market Opportunities
- 4. Market Factor Analysis
- 4.1. Porters Five Forces
- 4.1.1. Bargaining Power of Suppliers
- 4.1.2. Bargaining Power of Buyers
- 4.1.3. Threat of New Entrants
- 4.1.4. Threat of Substitutes
- 4.1.5. Competitive Rivalry
- 4.2. PESTEL analysis
- 4.3. BCG Analysis
- 4.3.1. Stars (High Growth, High Market Share)
- 4.3.2. Cash Cows (Low Growth, High Market Share)
- 4.3.3. Question Mark (High Growth, Low Market Share)
- 4.3.4. Dogs (Low Growth, Low Market Share)
- 4.4. Ansoff Matrix Analysis
- 4.5. Supply Chain Analysis
- 4.6. Regulatory Landscape
- 4.7. Current Market Potential and Opportunity Assessment (TAM–SAM–SOM Framework)
- 4.8. NRP Analyst Note
- 4.1. Porters Five Forces
- 5. Market Analysis, Insights and Forecast 2021-2033
- 5.1. Market Analysis, Insights and Forecast - by Production Analysis
- 5.2. Market Analysis, Insights and Forecast - by Consumption Analysis
- 5.3. Market Analysis, Insights and Forecast - by Import Market Analysis (Value & Volume)
- 5.4. Market Analysis, Insights and Forecast - by Export Market Analysis (Value & Volume)
- 5.5. Market Analysis, Insights and Forecast - by Price Trend Analysis
- 5.6. Market Analysis, Insights and Forecast - by Region
- 5.6.1. North America
- 5.6.2. South America
- 5.6.3. Europe
- 5.6.4. Middle East & Africa
- 5.6.5. Asia Pacific
- 6. Global Aircraft Tugs Market Analysis, Insights and Forecast, 2021-2033
- 6.1. Market Analysis, Insights and Forecast - by Production Analysis
- 6.2. Market Analysis, Insights and Forecast - by Consumption Analysis
- 6.3. Market Analysis, Insights and Forecast - by Import Market Analysis (Value & Volume)
- 6.4. Market Analysis, Insights and Forecast - by Export Market Analysis (Value & Volume)
- 6.5. Market Analysis, Insights and Forecast - by Price Trend Analysis
- 7. North America Aircraft Tugs Market Analysis, Insights and Forecast, 2020-2032
- 7.1. Market Analysis, Insights and Forecast - by Production Analysis
- 7.2. Market Analysis, Insights and Forecast - by Consumption Analysis
- 7.3. Market Analysis, Insights and Forecast - by Import Market Analysis (Value & Volume)
- 7.4. Market Analysis, Insights and Forecast - by Export Market Analysis (Value & Volume)
- 7.5. Market Analysis, Insights and Forecast - by Price Trend Analysis
- 8. South America Aircraft Tugs Market Analysis, Insights and Forecast, 2020-2032
- 8.1. Market Analysis, Insights and Forecast - by Production Analysis
- 8.2. Market Analysis, Insights and Forecast - by Consumption Analysis
- 8.3. Market Analysis, Insights and Forecast - by Import Market Analysis (Value & Volume)
- 8.4. Market Analysis, Insights and Forecast - by Export Market Analysis (Value & Volume)
- 8.5. Market Analysis, Insights and Forecast - by Price Trend Analysis
- 9. Europe Aircraft Tugs Market Analysis, Insights and Forecast, 2020-2032
- 9.1. Market Analysis, Insights and Forecast - by Production Analysis
- 9.2. Market Analysis, Insights and Forecast - by Consumption Analysis
- 9.3. Market Analysis, Insights and Forecast - by Import Market Analysis (Value & Volume)
- 9.4. Market Analysis, Insights and Forecast - by Export Market Analysis (Value & Volume)
- 9.5. Market Analysis, Insights and Forecast - by Price Trend Analysis
- 10. Middle East & Africa Aircraft Tugs Market Analysis, Insights and Forecast, 2020-2032
- 10.1. Market Analysis, Insights and Forecast - by Production Analysis
- 10.2. Market Analysis, Insights and Forecast - by Consumption Analysis
- 10.3. Market Analysis, Insights and Forecast - by Import Market Analysis (Value & Volume)
- 10.4. Market Analysis, Insights and Forecast - by Export Market Analysis (Value & Volume)
- 10.5. Market Analysis, Insights and Forecast - by Price Trend Analysis
- 11. Asia Pacific Aircraft Tugs Market Analysis, Insights and Forecast, 2020-2032
- 11.1. Market Analysis, Insights and Forecast - by Production Analysis
- 11.2. Market Analysis, Insights and Forecast - by Consumption Analysis
- 11.3. Market Analysis, Insights and Forecast - by Import Market Analysis (Value & Volume)
- 11.4. Market Analysis, Insights and Forecast - by Export Market Analysis (Value & Volume)
- 11.5. Market Analysis, Insights and Forecast - by Price Trend Analysis
- 12. Competitive Analysis
- 12.1. Company Profiles
- 12.1.1 Goldhofer AG
- 12.1.1.1. Company Overview
- 12.1.1.2. Products
- 12.1.1.3. Company Financials
- 12.1.1.4. SWOT Analysis
- 12.1.2 Kalmar Motor AB
- 12.1.2.1. Company Overview
- 12.1.2.2. Products
- 12.1.2.3. Company Financials
- 12.1.2.4. SWOT Analysis
- 12.1.3 Fresia SP
- 12.1.3.1. Company Overview
- 12.1.3.2. Products
- 12.1.3.3. Company Financials
- 12.1.3.4. SWOT Analysis
- 12.1.4 LEKTRO Inc
- 12.1.4.1. Company Overview
- 12.1.4.2. Products
- 12.1.4.3. Company Financials
- 12.1.4.4. SWOT Analysis
- 12.1.5 TREPEL Airport Equipment GmbH
- 12.1.5.1. Company Overview
- 12.1.5.2. Products
- 12.1.5.3. Company Financials
- 12.1.5.4. SWOT Analysis
- 12.1.6 Tronair Inc
- 12.1.6.1. Company Overview
- 12.1.6.2. Products
- 12.1.6.3. Company Financials
- 12.1.6.4. SWOT Analysis
- 12.1.7 John Bean Technologies Corp
- 12.1.7.1. Company Overview
- 12.1.7.2. Products
- 12.1.7.3. Company Financials
- 12.1.7.4. SWOT Analysis
- 12.1.8 Tinka Resources Limited
- 12.1.8.1. Company Overview
- 12.1.8.2. Products
- 12.1.8.3. Company Financials
- 12.1.8.4. SWOT Analysis
- 12.1.9 Textron Inc (Ground Support Equipment Inc )
- 12.1.9.1. Company Overview
- 12.1.9.2. Products
- 12.1.9.3. Company Financials
- 12.1.9.4. SWOT Analysis
- 12.1.10 Airtug LLC
- 12.1.10.1. Company Overview
- 12.1.10.2. Products
- 12.1.10.3. Company Financials
- 12.1.10.4. SWOT Analysis
- 12.1.11 MULAG
- 12.1.11.1. Company Overview
- 12.1.11.2. Products
- 12.1.11.3. Company Financials
- 12.1.11.4. SWOT Analysis
- 12.1.12 MOTOTOK
- 12.1.12.1. Company Overview
- 12.1.12.2. Products
- 12.1.12.3. Company Financials
- 12.1.12.4. SWOT Analysis
- 12.1.1 Goldhofer AG
- 12.2. Market Entropy
- 12.2.1 Company's Key Areas Served
- 12.2.2 Recent Developments
- 12.3. Company Market Share Analysis 2025
- 12.3.1 Top 5 Companies Market Share Analysis
- 12.3.2 Top 3 Companies Market Share Analysis
- 12.4. List of Potential Customers
- 13. Research Methodology
List of Figures
- Figure 1: Global Aircraft Tugs Market Revenue Breakdown (billion, %) by Region 2025 & 2033
- Figure 2: North America Aircraft Tugs Market Revenue (billion), by Production Analysis 2025 & 2033
- Figure 3: North America Aircraft Tugs Market Revenue Share (%), by Production Analysis 2025 & 2033
- Figure 4: North America Aircraft Tugs Market Revenue (billion), by Consumption Analysis 2025 & 2033
- Figure 5: North America Aircraft Tugs Market Revenue Share (%), by Consumption Analysis 2025 & 2033
- Figure 6: North America Aircraft Tugs Market Revenue (billion), by Import Market Analysis (Value & Volume) 2025 & 2033
- Figure 7: North America Aircraft Tugs Market Revenue Share (%), by Import Market Analysis (Value & Volume) 2025 & 2033
- Figure 8: North America Aircraft Tugs Market Revenue (billion), by Export Market Analysis (Value & Volume) 2025 & 2033
- Figure 9: North America Aircraft Tugs Market Revenue Share (%), by Export Market Analysis (Value & Volume) 2025 & 2033
- Figure 10: North America Aircraft Tugs Market Revenue (billion), by Price Trend Analysis 2025 & 2033
- Figure 11: North America Aircraft Tugs Market Revenue Share (%), by Price Trend Analysis 2025 & 2033
- Figure 12: North America Aircraft Tugs Market Revenue (billion), by Country 2025 & 2033
- Figure 13: North America Aircraft Tugs Market Revenue Share (%), by Country 2025 & 2033
- Figure 14: South America Aircraft Tugs Market Revenue (billion), by Production Analysis 2025 & 2033
- Figure 15: South America Aircraft Tugs Market Revenue Share (%), by Production Analysis 2025 & 2033
- Figure 16: South America Aircraft Tugs Market Revenue (billion), by Consumption Analysis 2025 & 2033
- Figure 17: South America Aircraft Tugs Market Revenue Share (%), by Consumption Analysis 2025 & 2033
- Figure 18: South America Aircraft Tugs Market Revenue (billion), by Import Market Analysis (Value & Volume) 2025 & 2033
- Figure 19: South America Aircraft Tugs Market Revenue Share (%), by Import Market Analysis (Value & Volume) 2025 & 2033
- Figure 20: South America Aircraft Tugs Market Revenue (billion), by Export Market Analysis (Value & Volume) 2025 & 2033
- Figure 21: South America Aircraft Tugs Market Revenue Share (%), by Export Market Analysis (Value & Volume) 2025 & 2033
- Figure 22: South America Aircraft Tugs Market Revenue (billion), by Price Trend Analysis 2025 & 2033
- Figure 23: South America Aircraft Tugs Market Revenue Share (%), by Price Trend Analysis 2025 & 2033
- Figure 24: South America Aircraft Tugs Market Revenue (billion), by Country 2025 & 2033
- Figure 25: South America Aircraft Tugs Market Revenue Share (%), by Country 2025 & 2033
- Figure 26: Europe Aircraft Tugs Market Revenue (billion), by Production Analysis 2025 & 2033
- Figure 27: Europe Aircraft Tugs Market Revenue Share (%), by Production Analysis 2025 & 2033
- Figure 28: Europe Aircraft Tugs Market Revenue (billion), by Consumption Analysis 2025 & 2033
- Figure 29: Europe Aircraft Tugs Market Revenue Share (%), by Consumption Analysis 2025 & 2033
- Figure 30: Europe Aircraft Tugs Market Revenue (billion), by Import Market Analysis (Value & Volume) 2025 & 2033
- Figure 31: Europe Aircraft Tugs Market Revenue Share (%), by Import Market Analysis (Value & Volume) 2025 & 2033
- Figure 32: Europe Aircraft Tugs Market Revenue (billion), by Export Market Analysis (Value & Volume) 2025 & 2033
- Figure 33: Europe Aircraft Tugs Market Revenue Share (%), by Export Market Analysis (Value & Volume) 2025 & 2033
- Figure 34: Europe Aircraft Tugs Market Revenue (billion), by Price Trend Analysis 2025 & 2033
- Figure 35: Europe Aircraft Tugs Market Revenue Share (%), by Price Trend Analysis 2025 & 2033
- Figure 36: Europe Aircraft Tugs Market Revenue (billion), by Country 2025 & 2033
- Figure 37: Europe Aircraft Tugs Market Revenue Share (%), by Country 2025 & 2033
- Figure 38: Middle East & Africa Aircraft Tugs Market Revenue (billion), by Production Analysis 2025 & 2033
- Figure 39: Middle East & Africa Aircraft Tugs Market Revenue Share (%), by Production Analysis 2025 & 2033
- Figure 40: Middle East & Africa Aircraft Tugs Market Revenue (billion), by Consumption Analysis 2025 & 2033
- Figure 41: Middle East & Africa Aircraft Tugs Market Revenue Share (%), by Consumption Analysis 2025 & 2033
- Figure 42: Middle East & Africa Aircraft Tugs Market Revenue (billion), by Import Market Analysis (Value & Volume) 2025 & 2033
- Figure 43: Middle East & Africa Aircraft Tugs Market Revenue Share (%), by Import Market Analysis (Value & Volume) 2025 & 2033
- Figure 44: Middle East & Africa Aircraft Tugs Market Revenue (billion), by Export Market Analysis (Value & Volume) 2025 & 2033
- Figure 45: Middle East & Africa Aircraft Tugs Market Revenue Share (%), by Export Market Analysis (Value & Volume) 2025 & 2033
- Figure 46: Middle East & Africa Aircraft Tugs Market Revenue (billion), by Price Trend Analysis 2025 & 2033
- Figure 47: Middle East & Africa Aircraft Tugs Market Revenue Share (%), by Price Trend Analysis 2025 & 2033
- Figure 48: Middle East & Africa Aircraft Tugs Market Revenue (billion), by Country 2025 & 2033
- Figure 49: Middle East & Africa Aircraft Tugs Market Revenue Share (%), by Country 2025 & 2033
- Figure 50: Asia Pacific Aircraft Tugs Market Revenue (billion), by Production Analysis 2025 & 2033
- Figure 51: Asia Pacific Aircraft Tugs Market Revenue Share (%), by Production Analysis 2025 & 2033
- Figure 52: Asia Pacific Aircraft Tugs Market Revenue (billion), by Consumption Analysis 2025 & 2033
- Figure 53: Asia Pacific Aircraft Tugs Market Revenue Share (%), by Consumption Analysis 2025 & 2033
- Figure 54: Asia Pacific Aircraft Tugs Market Revenue (billion), by Import Market Analysis (Value & Volume) 2025 & 2033
- Figure 55: Asia Pacific Aircraft Tugs Market Revenue Share (%), by Import Market Analysis (Value & Volume) 2025 & 2033
- Figure 56: Asia Pacific Aircraft Tugs Market Revenue (billion), by Export Market Analysis (Value & Volume) 2025 & 2033
- Figure 57: Asia Pacific Aircraft Tugs Market Revenue Share (%), by Export Market Analysis (Value & Volume) 2025 & 2033
- Figure 58: Asia Pacific Aircraft Tugs Market Revenue (billion), by Price Trend Analysis 2025 & 2033
- Figure 59: Asia Pacific Aircraft Tugs Market Revenue Share (%), by Price Trend Analysis 2025 & 2033
- Figure 60: Asia Pacific Aircraft Tugs Market Revenue (billion), by Country 2025 & 2033
- Figure 61: Asia Pacific Aircraft Tugs Market Revenue Share (%), by Country 2025 & 2033
List of Tables
- Table 1: Global Aircraft Tugs Market Revenue billion Forecast, by Production Analysis 2020 & 2033
- Table 2: Global Aircraft Tugs Market Revenue billion Forecast, by Consumption Analysis 2020 & 2033
- Table 3: Global Aircraft Tugs Market Revenue billion Forecast, by Import Market Analysis (Value & Volume) 2020 & 2033
- Table 4: Global Aircraft Tugs Market Revenue billion Forecast, by Export Market Analysis (Value & Volume) 2020 & 2033
- Table 5: Global Aircraft Tugs Market Revenue billion Forecast, by Price Trend Analysis 2020 & 2033
- Table 6: Global Aircraft Tugs Market Revenue billion Forecast, by Region 2020 & 2033
- Table 7: Global Aircraft Tugs Market Revenue billion Forecast, by Production Analysis 2020 & 2033
- Table 8: Global Aircraft Tugs Market Revenue billion Forecast, by Consumption Analysis 2020 & 2033
- Table 9: Global Aircraft Tugs Market Revenue billion Forecast, by Import Market Analysis (Value & Volume) 2020 & 2033
- Table 10: Global Aircraft Tugs Market Revenue billion Forecast, by Export Market Analysis (Value & Volume) 2020 & 2033
- Table 11: Global Aircraft Tugs Market Revenue billion Forecast, by Price Trend Analysis 2020 & 2033
- Table 12: Global Aircraft Tugs Market Revenue billion Forecast, by Country 2020 & 2033
- Table 13: United States Aircraft Tugs Market Revenue (billion) Forecast, by Application 2020 & 2033
- Table 14: Canada Aircraft Tugs Market Revenue (billion) Forecast, by Application 2020 & 2033
- Table 15: Mexico Aircraft Tugs Market Revenue (billion) Forecast, by Application 2020 & 2033
- Table 16: Global Aircraft Tugs Market Revenue billion Forecast, by Production Analysis 2020 & 2033
- Table 17: Global Aircraft Tugs Market Revenue billion Forecast, by Consumption Analysis 2020 & 2033
- Table 18: Global Aircraft Tugs Market Revenue billion Forecast, by Import Market Analysis (Value & Volume) 2020 & 2033
- Table 19: Global Aircraft Tugs Market Revenue billion Forecast, by Export Market Analysis (Value & Volume) 2020 & 2033
- Table 20: Global Aircraft Tugs Market Revenue billion Forecast, by Price Trend Analysis 2020 & 2033
- Table 21: Global Aircraft Tugs Market Revenue billion Forecast, by Country 2020 & 2033
- Table 22: Brazil Aircraft Tugs Market Revenue (billion) Forecast, by Application 2020 & 2033
- Table 23: Argentina Aircraft Tugs Market Revenue (billion) Forecast, by Application 2020 & 2033
- Table 24: Rest of South America Aircraft Tugs Market Revenue (billion) Forecast, by Application 2020 & 2033
- Table 25: Global Aircraft Tugs Market Revenue billion Forecast, by Production Analysis 2020 & 2033
- Table 26: Global Aircraft Tugs Market Revenue billion Forecast, by Consumption Analysis 2020 & 2033
- Table 27: Global Aircraft Tugs Market Revenue billion Forecast, by Import Market Analysis (Value & Volume) 2020 & 2033
- Table 28: Global Aircraft Tugs Market Revenue billion Forecast, by Export Market Analysis (Value & Volume) 2020 & 2033
- Table 29: Global Aircraft Tugs Market Revenue billion Forecast, by Price Trend Analysis 2020 & 2033
- Table 30: Global Aircraft Tugs Market Revenue billion Forecast, by Country 2020 & 2033
- Table 31: United Kingdom Aircraft Tugs Market Revenue (billion) Forecast, by Application 2020 & 2033
- Table 32: Germany Aircraft Tugs Market Revenue (billion) Forecast, by Application 2020 & 2033
- Table 33: France Aircraft Tugs Market Revenue (billion) Forecast, by Application 2020 & 2033
- Table 34: Italy Aircraft Tugs Market Revenue (billion) Forecast, by Application 2020 & 2033
- Table 35: Spain Aircraft Tugs Market Revenue (billion) Forecast, by Application 2020 & 2033
- Table 36: Russia Aircraft Tugs Market Revenue (billion) Forecast, by Application 2020 & 2033
- Table 37: Benelux Aircraft Tugs Market Revenue (billion) Forecast, by Application 2020 & 2033
- Table 38: Nordics Aircraft Tugs Market Revenue (billion) Forecast, by Application 2020 & 2033
- Table 39: Rest of Europe Aircraft Tugs Market Revenue (billion) Forecast, by Application 2020 & 2033
- Table 40: Global Aircraft Tugs Market Revenue billion Forecast, by Production Analysis 2020 & 2033
- Table 41: Global Aircraft Tugs Market Revenue billion Forecast, by Consumption Analysis 2020 & 2033
- Table 42: Global Aircraft Tugs Market Revenue billion Forecast, by Import Market Analysis (Value & Volume) 2020 & 2033
- Table 43: Global Aircraft Tugs Market Revenue billion Forecast, by Export Market Analysis (Value & Volume) 2020 & 2033
- Table 44: Global Aircraft Tugs Market Revenue billion Forecast, by Price Trend Analysis 2020 & 2033
- Table 45: Global Aircraft Tugs Market Revenue billion Forecast, by Country 2020 & 2033
- Table 46: Turkey Aircraft Tugs Market Revenue (billion) Forecast, by Application 2020 & 2033
- Table 47: Israel Aircraft Tugs Market Revenue (billion) Forecast, by Application 2020 & 2033
- Table 48: GCC Aircraft Tugs Market Revenue (billion) Forecast, by Application 2020 & 2033
- Table 49: North Africa Aircraft Tugs Market Revenue (billion) Forecast, by Application 2020 & 2033
- Table 50: South Africa Aircraft Tugs Market Revenue (billion) Forecast, by Application 2020 & 2033
- Table 51: Rest of Middle East & Africa Aircraft Tugs Market Revenue (billion) Forecast, by Application 2020 & 2033
- Table 52: Global Aircraft Tugs Market Revenue billion Forecast, by Production Analysis 2020 & 2033
- Table 53: Global Aircraft Tugs Market Revenue billion Forecast, by Consumption Analysis 2020 & 2033
- Table 54: Global Aircraft Tugs Market Revenue billion Forecast, by Import Market Analysis (Value & Volume) 2020 & 2033
- Table 55: Global Aircraft Tugs Market Revenue billion Forecast, by Export Market Analysis (Value & Volume) 2020 & 2033
- Table 56: Global Aircraft Tugs Market Revenue billion Forecast, by Price Trend Analysis 2020 & 2033
- Table 57: Global Aircraft Tugs Market Revenue billion Forecast, by Country 2020 & 2033
- Table 58: China Aircraft Tugs Market Revenue (billion) Forecast, by Application 2020 & 2033
- Table 59: India Aircraft Tugs Market Revenue (billion) Forecast, by Application 2020 & 2033
- Table 60: Japan Aircraft Tugs Market Revenue (billion) Forecast, by Application 2020 & 2033
- Table 61: South Korea Aircraft Tugs Market Revenue (billion) Forecast, by Application 2020 & 2033
- Table 62: ASEAN Aircraft Tugs Market Revenue (billion) Forecast, by Application 2020 & 2033
- Table 63: Oceania Aircraft Tugs Market Revenue (billion) Forecast, by Application 2020 & 2033
- Table 64: Rest of Asia Pacific Aircraft Tugs Market Revenue (billion) Forecast, by Application 2020 & 2033
Frequently Asked Questions
1. What is the projected Compound Annual Growth Rate (CAGR) of the Aircraft Tugs Market?
The projected CAGR is approximately 7.25%.
2. Which companies are prominent players in the Aircraft Tugs Market?
Key companies in the market include Goldhofer AG, Kalmar Motor AB, Fresia SP, LEKTRO Inc, TREPEL Airport Equipment GmbH, Tronair Inc, John Bean Technologies Corp, Tinka Resources Limited, Textron Inc (Ground Support Equipment Inc ), Airtug LLC, MULAG, MOTOTOK.
3. What are the main segments of the Aircraft Tugs Market?
The market segments include Production Analysis, Consumption Analysis, Import Market Analysis (Value & Volume), Export Market Analysis (Value & Volume), Price Trend Analysis.
4. Can you provide details about the market size?
The market size is estimated to be USD 5.51 billion as of 2022.
5. What are some drivers contributing to market growth?
Increase in Internet of Things (IoT) and Autonomous Systems; Rise in Demand for Military and Defense Satellite Communication Solutions.
6. What are the notable trends driving market growth?
Electric Segment is Anticipated to Register the Highest CAGR During the Forecast Period.
7. Are there any restraints impacting market growth?
Cybersecurity Threats to Satellite Communication; Interference in Transmission of Data.
8. Can you provide examples of recent developments in the market?
June 2023: Lokpriyo Gopinath Bordoloi International Airport launched its first electric vehicle tug to handle ground operations.
9. What pricing options are available for accessing the report?
Pricing options include single-user, multi-user, and enterprise licenses priced at USD 4750, USD 5250, and USD 8750 respectively.
10. Is the market size provided in terms of value or volume?
The market size is provided in terms of value, measured in billion.
11. Are there any specific market keywords associated with the report?
Yes, the market keyword associated with the report is "Aircraft Tugs Market," which aids in identifying and referencing the specific market segment covered.
12. How do I determine which pricing option suits my needs best?
The pricing options vary based on user requirements and access needs. Individual users may opt for single-user licenses, while businesses requiring broader access may choose multi-user or enterprise licenses for cost-effective access to the report.
13. Are there any additional resources or data provided in the Aircraft Tugs Market report?
While the report offers comprehensive insights, it's advisable to review the specific contents or supplementary materials provided to ascertain if additional resources or data are available.
14. How can I stay updated on further developments or reports in the Aircraft Tugs Market?
To stay informed about further developments, trends, and reports in the Aircraft Tugs Market, consider subscribing to industry newsletters, following relevant companies and organizations, or regularly checking reputable industry news sources and publications.
Methodology
Step 1 - Identification of Relevant Samples Size from Population Database


Step 2 - Approaches for Defining Global Market Size (Value, Volume* & Price*)

Note*: In applicable scenarios
Step 3 - Data Sources
Primary Research
- Web Analytics
- Survey Reports
- Research Institute
- Latest Research Reports
- Opinion Leaders
Secondary Research
- Annual Reports
- White Paper
- Latest Press Release
- Industry Association
- Paid Database
- Investor Presentations

Step 4 - Data Triangulation
Involves using different sources of information in order to increase the validity of a study
These sources are likely to be stakeholders in a program - participants, other researchers, program staff, other community members, and so on.
Then we put all data in single framework & apply various statistical tools to find out the dynamic on the market.
During the analysis stage, feedback from the stakeholder groups would be compared to determine areas of agreement as well as areas of divergence