

Key Insights
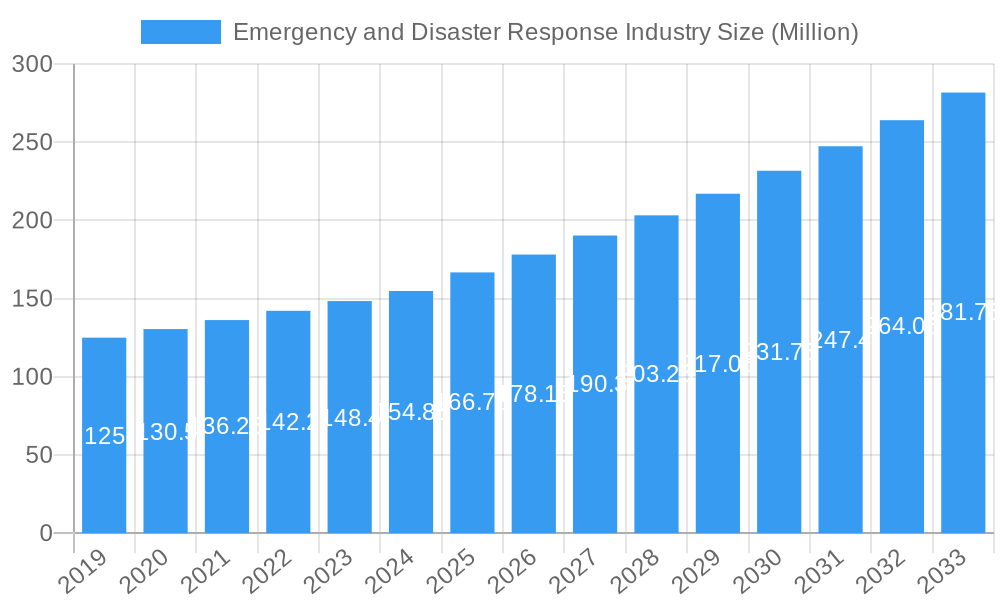
The global Emergency and Disaster Response market is poised for significant expansion, projected to reach $166.73 million in 2025, with a robust Compound Annual Growth Rate (CAGR) of 6.58% extending through 2033. This growth is fueled by a confluence of factors, including increasing global incidents of natural disasters, a heightened awareness of preparedness, and advancements in technology designed to mitigate and manage crises. The market is segmented across various essential equipment categories such as threat detection equipment, personal protection gear, medical equipment, temporary shelter, mountaineering, and firefighting equipment, alongside critical vehicle platforms for land, marine, and airborne operations. These segments collectively address the multifaceted needs of emergency services, disaster relief organizations, and governmental agencies worldwide. The growing frequency and severity of climate-related events, coupled with evolving geopolitical landscapes that can trigger humanitarian crises, underscore the persistent demand for sophisticated and reliable emergency response solutions. This necessitates continuous innovation in areas like real-time data analytics, advanced communication systems, and resilient infrastructure, all contributing to a more effective and proactive disaster management framework.
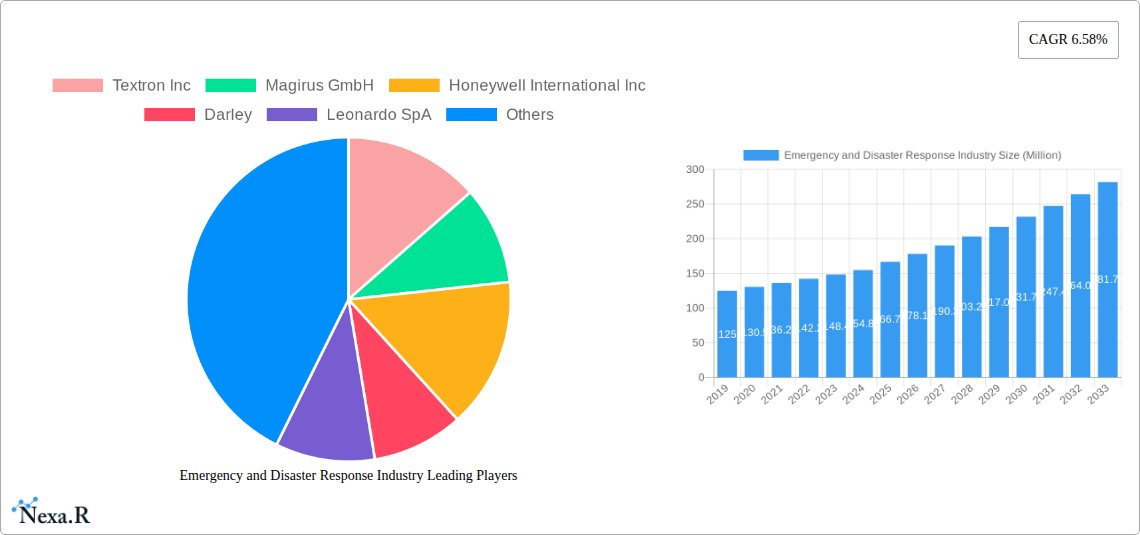
Emergency and Disaster Response Industry Market Size (In Million)
The industry's trajectory is further shaped by key market drivers such as escalating investments in disaster resilience by governments and private entities, the development of smart city initiatives incorporating emergency response protocols, and the growing adoption of AI and IoT for predictive disaster modeling and early warning systems. Emerging trends include the integration of telemedicine in disaster zones, the rise of drone technology for reconnaissance and delivery, and the increasing emphasis on resilient supply chains for essential goods during crises. However, the market also faces certain restraints, including the high cost of advanced emergency response equipment, complexities in international regulatory frameworks and procurement processes, and the ongoing challenge of ensuring equitable access to resources across diverse geographical and socio-economic landscapes. Leading companies like Textron Inc., Honeywell International Inc., Smiths Group PLC, and 3M are at the forefront, developing and deploying innovative solutions to meet these evolving demands and solidify the market's growth trajectory.
Emergency and Disaster Response Industry Company Market Share
This comprehensive report offers an in-depth analysis of the global Emergency and Disaster Response Industry, a critical sector dedicated to mitigating the impact of unforeseen events. From natural disasters to man-made crises, this industry provides essential solutions and services. Our analysis spans the historical period of 2019-2024, with a base year of 2025, and projects market evolution through to 2033. We explore the parent market of Public Safety and Security, and the child markets of specific response equipment and services, providing a granular understanding of market dynamics.
Emergency and Disaster Response Industry Market Dynamics & Structure
The Emergency and Disaster Response Industry is characterized by a moderate to high market concentration, with several key players dominating specific segments. Technological innovation is a primary driver, fueled by advancements in communication systems, threat detection, and personal protective equipment. Regulatory frameworks, often stringent and evolving, dictate product standards and operational procedures, impacting market entry and competitive dynamics. Competitive product substitutes, though often less specialized, exist for certain equipment categories, necessitating continuous innovation to maintain market share. End-user demographics are diverse, encompassing government agencies, non-governmental organizations (NGOs), private enterprises, and increasingly, community-based initiatives. Mergers and Acquisitions (M&A) trends indicate a consolidation of expertise and resources, particularly in the technology and specialized equipment sectors, to address complex and evolving disaster scenarios.
- Market Concentration: Dominated by a mix of large, diversified corporations and specialized niche providers, with significant market share held by leaders in fire suppression and communication technologies.
- Technological Innovation Drivers: AI-powered predictive analytics for disaster forecasting, advanced sensor technology for threat detection, drone integration for surveillance and delivery, and improved personal protective gear for extreme conditions.
- Regulatory Frameworks: Driven by FEMA guidelines in the US, EU directives, and national emergency preparedness mandates, emphasizing interoperability and resilience.
- Competitive Product Substitutes: General-purpose communication devices, basic safety equipment not specifically designed for disaster scenarios.
- End-User Demographics: Federal and local government agencies (fire departments, emergency medical services, law enforcement), military, critical infrastructure operators, humanitarian organizations, and private sector risk management.
- M&A Trends: Strategic acquisitions by larger entities to expand product portfolios and gain access to cutting-edge technologies, such as acquisitions of drone technology companies and data analytics firms. Deal volumes are projected to increase by an estimated 15% over the forecast period.
Emergency and Disaster Response Industry Growth Trends & Insights
The Emergency and Disaster Response Industry is poised for robust growth, projected to achieve a Compound Annual Growth Rate (CAGR) of approximately 8.5% during the forecast period (2025-2033). This expansion is driven by a confluence of factors, including the increasing frequency and intensity of natural disasters, heightened global security concerns, and a growing awareness of the necessity for comprehensive preparedness. The market size is estimated to grow from XX Million in 2024 to an anticipated XX Million by 2033. Adoption rates for advanced technologies, such as early warning systems and sophisticated command and control platforms, are accelerating as organizations recognize their critical role in minimizing loss of life and property. Technological disruptions, including the integration of artificial intelligence (AI) for predictive modeling and autonomous systems for reconnaissance and delivery, are reshaping the landscape. Consumer behavior shifts are also evident, with greater demand for resilience and preparedness solutions from both public and private sectors. Market penetration for advanced communication and situational awareness tools is estimated to increase by 20% over the next decade. The ongoing urbanization and increasing density of populations in vulnerable areas further amplify the need for effective emergency response capabilities. Furthermore, government investments in national security and disaster resilience initiatives are a significant catalyst for market expansion. The evolution of threats, from climate-induced events to sophisticated cyber-attacks, necessitates a continuous upgrade of existing response mechanisms and the development of novel solutions. The report leverages sophisticated market modeling techniques, including trend analysis and scenario planning, to provide these insights.
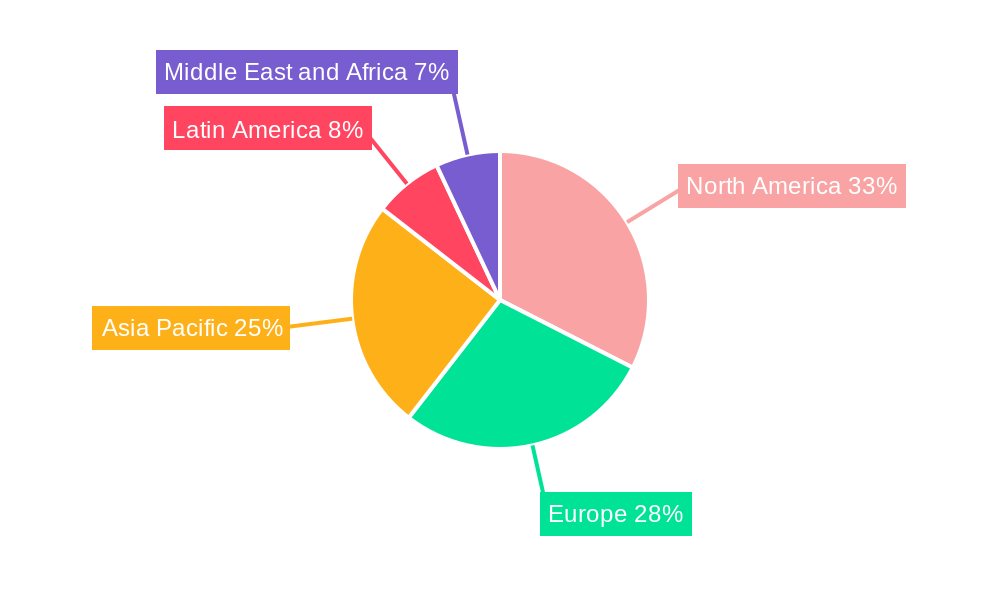
Dominant Regions, Countries, or Segments in Emergency and Disaster Response Industry
North America currently dominates the Emergency and Disaster Response Industry, driven by significant government investment in disaster preparedness, robust technological infrastructure, and a high frequency of diverse natural and man-made emergencies. The United States, in particular, exhibits strong market share due to extensive federal funding for emergency management agencies, coupled with stringent regulations and a proactive approach to risk mitigation. The country's large landmass and varied climate contribute to a continuous demand for a wide array of response equipment and services.
- Leading Region: North America, with an estimated market share of 35% in 2025.
- Key Country: United States, contributing over 70% of the North American market share.
- Dominant Segment - Equipment: Fire Fighting Equipment holds a substantial segment share, estimated at 25% of the total equipment market, driven by fire services' continuous need for advanced suppression systems and personal protective gear.
- Dominant Segment - Vehicle Platform: Land-based vehicle platforms, including specialized fire trucks, ambulances, and command vehicles, represent the largest segment within vehicle platforms, accounting for an estimated 60% of the market.
Key drivers for North America's dominance include:
- Economic Policies: Government grants and funding programs specifically allocated for emergency preparedness and response initiatives.
- Infrastructure: Well-established communication networks and transportation systems that facilitate rapid deployment of resources.
- Technological Adoption: High receptiveness to adopting new technologies, such as advanced sensor networks and integrated command and control software.
- Regulatory Environment: Stringent safety standards and mandatory preparedness requirements for critical infrastructure and public services.
In terms of growth potential, Asia Pacific is emerging as a significant growth corridor. Increasing awareness of disaster risks, coupled with rapid economic development and substantial investments in infrastructure modernization, is driving demand for emergency and disaster response solutions. Countries like China, Japan, and India are increasingly investing in advanced technologies and equipment to enhance their resilience against a spectrum of natural hazards, including earthquakes, typhoons, and floods. The Medical Equipment segment, vital for immediate casualty care, is experiencing significant expansion globally, with an estimated market share of 20% within the broader equipment category. Threat Detection Equipment is also witnessing accelerated growth, driven by escalating security concerns, with an estimated growth rate of 12% CAGR. Temporary Shelter Equipment remains crucial, especially in regions prone to extreme weather events, with a steady demand estimated at 10% of the equipment market.
Emergency and Disaster Response Industry Product Landscape
The Emergency and Disaster Response Industry product landscape is marked by continuous innovation aimed at enhancing situational awareness, operational efficiency, and personnel safety. Recent product innovations include AI-powered predictive analytics platforms for early warning systems, lightweight and durable personal protective gear offering enhanced chemical and biological resistance, and modular temporary shelter solutions deployable within hours. Performance metrics emphasize rapid deployment, interoperability between different systems, and real-time data dissemination. Unique selling propositions often revolve around ruggedization for extreme environments, advanced communication capabilities (satellite, mesh networks), and user-friendly interfaces for stress-induced operations. Technological advancements are also seen in drone technology for aerial reconnaissance and delivery of medical supplies, and advanced fire fighting equipment featuring automated systems and eco-friendly suppression agents.
Key Drivers, Barriers & Challenges in Emergency and Disaster Response Industry
Key Drivers:
- Increasing frequency and severity of natural disasters: Climate change and other environmental factors are leading to more frequent and intense extreme weather events, driving demand for preparedness and response solutions.
- Growing global security concerns: The rise of terrorism and complex geopolitical situations necessitates robust disaster response capabilities.
- Technological advancements: Innovations in AI, IoT, drone technology, and communication systems are enabling more effective and efficient response.
- Government investments and policy mandates: Increased funding and regulatory requirements from governments worldwide for disaster preparedness and resilience initiatives.
Key Barriers & Challenges:
- High cost of advanced equipment and technology: The sophisticated nature of many emergency and disaster response solutions can make them prohibitively expensive for some organizations, particularly in developing economies.
- Supply chain disruptions: Global events can impact the availability and timely delivery of critical equipment and components, hindering response efforts.
- Interoperability issues: Ensuring seamless communication and data sharing between disparate systems and agencies remains a significant challenge.
- Regulatory hurdles and standardization: Navigating complex and sometimes conflicting regulatory frameworks across different jurisdictions can be a barrier to market entry and product development.
- Skilled workforce shortage: A lack of adequately trained personnel to operate and maintain advanced equipment and technologies.
- Competitive pressures: Intense competition among existing players and the emergence of new entrants can drive down profit margins.
Emerging Opportunities in Emergency and Disaster Response Industry
Emerging opportunities in the Emergency and Disaster Response Industry lie in the development of integrated, smart city disaster management solutions, leveraging IoT sensors and big data analytics for real-time threat assessment and optimized resource allocation. The growing demand for climate change adaptation strategies presents a significant opportunity for businesses offering solutions for flood control, wildfire management, and resilient infrastructure. Furthermore, the increasing focus on public health emergencies has spurred innovation in rapid diagnostic equipment, mobile medical units, and advanced decontamination technologies. The expansion of satellite communication networks offers opportunities for enhanced connectivity in remote or disaster-stricken areas.
Growth Accelerators in the Emergency and Disaster Response Industry Industry
Growth accelerators in the Emergency and Disaster Response Industry are intrinsically linked to ongoing technological breakthroughs, particularly in AI-driven predictive analytics and autonomous systems, which are enhancing early warning capabilities and operational efficiency. Strategic partnerships between technology providers, equipment manufacturers, and government agencies are crucial for co-developing and deploying integrated solutions. Market expansion strategies, including penetration into emerging economies with growing disaster risks and increasing investments in preparedness, will significantly fuel long-term growth. The development of standardized protocols for data sharing and interoperability will further streamline response efforts, accelerating adoption rates and market integration.
Key Players Shaping the Emergency and Disaster Response Industry Market
- Textron Inc
- Magirus GmbH
- Honeywell International Inc
- Darley
- Leonardo SpA
- Smiths Group PLC
- Viking Air Ltd
- Emergency Medical International
- Ziegler GmbH
- 3M
- Juvare LLC
- Emergency One Group
- Everbridge Inc
- Hexagon AB
- Esri Inc
- Rosenbauer International AG
- REV Group Inc
Notable Milestones in Emergency and Disaster Response Industry Sector
- 2019: Introduction of AI-powered early warning systems by several leading technology firms, enhancing predictive capabilities for weather-related disasters.
- 2020: Significant surge in demand for personal protection gear and medical equipment due to the global pandemic, driving innovation in rapid deployment and mass production capabilities.
- 2021: Increased integration of drone technology for disaster assessment and delivery of essential supplies in remote or inaccessible areas.
- 2022: Expansion of smart city initiatives incorporating disaster resilience features, leading to demand for integrated command and control platforms.
- 2023: Major investments in cybersecurity for critical infrastructure, boosting the market for threat detection and network resilience solutions.
- 2024: Advancements in portable and scalable temporary shelter solutions, offering rapid deployment for displaced populations.
In-Depth Emergency and Disaster Response Industry Market Outlook
The Emergency and Disaster Response Industry is set for sustained growth, propelled by a synergistic interplay of technological innovation, increasing global risks, and proactive governmental and organizational investments. The projected market outlook indicates a strong upward trajectory, with future growth accelerators focusing on the maturation of AI in predictive disaster management, the widespread adoption of autonomous systems for reconnaissance and logistics, and the creation of more resilient and interconnected smart city infrastructure. Strategic opportunities abound in addressing climate change impacts, enhancing public health emergency preparedness, and bridging the technology gap in developing nations. The industry's capacity to adapt and innovate will be paramount in meeting the evolving challenges of a complex world.
Emergency and Disaster Response Industry Segmentation
-
1. Equipment
- 1.1. Threat Detection Equipment
- 1.2. Personal Protection Gear
- 1.3. Medical Equipment
- 1.4. Temporary Shelter Equipment
- 1.5. Mountaineering Equipment
- 1.6. Fire Fighting Equipment
- 1.7. Other Equipment
-
2. Vehicle Platform
- 2.1. Land
- 2.2. Marine
- 2.3. Airborne
Emergency and Disaster Response Industry Segmentation By Geography
-
1. North America
- 1.1. United States
- 1.2. Canada
-
2. Europe
- 2.1. United Kingdom
- 2.2. Germany
- 2.3. France
- 2.4. Italy
- 2.5. Russia
- 2.6. Rest of Europe
-
3. Asia Pacific
- 3.1. China
- 3.2. India
- 3.3. Japan
- 3.4. South Korea
- 3.5. Australia
- 3.6. Rest of Asia Pacific
-
4. Latin America
- 4.1. Brazil
- 4.2. Mexico
- 4.3. Rest of Latin America
-
5. Middle East and Africa
- 5.1. United Arab Emirates
- 5.2. Saudi Arabia
- 5.3. Egypt
- 5.4. South Africa
- 5.5. Rest of Middle East and Africa
Emergency and Disaster Response Industry Regional Market Share
Geographic Coverage of Emergency and Disaster Response Industry
Emergency and Disaster Response Industry REPORT HIGHLIGHTS
| Aspects | Details |
|---|---|
| Study Period | 2020-2034 |
| Base Year | 2025 |
| Estimated Year | 2026 |
| Forecast Period | 2026-2034 |
| Historical Period | 2020-2025 |
| Growth Rate | CAGR of 6.58% from 2020-2034 |
| Segmentation |
|
Table of Contents
- 1. Introduction
- 1.1. Research Scope
- 1.2. Market Segmentation
- 1.3. Research Objective
- 1.4. Definitions and Assumptions
- 2. Executive Summary
- 2.1. Market Snapshot
- 3. Market Dynamics
- 3.1. Market Drivers
- 3.2. Market Restrains
- 3.3. Market Trends
- 3.4. Market Opportunities
- 4. Market Factor Analysis
- 4.1. Porters Five Forces
- 4.1.1. Bargaining Power of Suppliers
- 4.1.2. Bargaining Power of Buyers
- 4.1.3. Threat of New Entrants
- 4.1.4. Threat of Substitutes
- 4.1.5. Competitive Rivalry
- 4.2. PESTEL analysis
- 4.3. BCG Analysis
- 4.3.1. Stars (High Growth, High Market Share)
- 4.3.2. Cash Cows (Low Growth, High Market Share)
- 4.3.3. Question Mark (High Growth, Low Market Share)
- 4.3.4. Dogs (Low Growth, Low Market Share)
- 4.4. Ansoff Matrix Analysis
- 4.5. Supply Chain Analysis
- 4.6. Regulatory Landscape
- 4.7. Current Market Potential and Opportunity Assessment (TAM–SAM–SOM Framework)
- 4.8. NRP Analyst Note
- 4.1. Porters Five Forces
- 5. Market Analysis, Insights and Forecast 2021-2033
- 5.1. Market Analysis, Insights and Forecast - by Equipment
- 5.1.1. Threat Detection Equipment
- 5.1.2. Personal Protection Gear
- 5.1.3. Medical Equipment
- 5.1.4. Temporary Shelter Equipment
- 5.1.5. Mountaineering Equipment
- 5.1.6. Fire Fighting Equipment
- 5.1.7. Other Equipment
- 5.2. Market Analysis, Insights and Forecast - by Vehicle Platform
- 5.2.1. Land
- 5.2.2. Marine
- 5.2.3. Airborne
- 5.3. Market Analysis, Insights and Forecast - by Region
- 5.3.1. North America
- 5.3.2. Europe
- 5.3.3. Asia Pacific
- 5.3.4. Latin America
- 5.3.5. Middle East and Africa
- 5.1. Market Analysis, Insights and Forecast - by Equipment
- 6. Global Emergency and Disaster Response Industry Analysis, Insights and Forecast, 2021-2033
- 6.1. Market Analysis, Insights and Forecast - by Equipment
- 6.1.1. Threat Detection Equipment
- 6.1.2. Personal Protection Gear
- 6.1.3. Medical Equipment
- 6.1.4. Temporary Shelter Equipment
- 6.1.5. Mountaineering Equipment
- 6.1.6. Fire Fighting Equipment
- 6.1.7. Other Equipment
- 6.2. Market Analysis, Insights and Forecast - by Vehicle Platform
- 6.2.1. Land
- 6.2.2. Marine
- 6.2.3. Airborne
- 6.1. Market Analysis, Insights and Forecast - by Equipment
- 7. North America Emergency and Disaster Response Industry Analysis, Insights and Forecast, 2020-2032
- 7.1. Market Analysis, Insights and Forecast - by Equipment
- 7.1.1. Threat Detection Equipment
- 7.1.2. Personal Protection Gear
- 7.1.3. Medical Equipment
- 7.1.4. Temporary Shelter Equipment
- 7.1.5. Mountaineering Equipment
- 7.1.6. Fire Fighting Equipment
- 7.1.7. Other Equipment
- 7.2. Market Analysis, Insights and Forecast - by Vehicle Platform
- 7.2.1. Land
- 7.2.2. Marine
- 7.2.3. Airborne
- 7.1. Market Analysis, Insights and Forecast - by Equipment
- 8. Europe Emergency and Disaster Response Industry Analysis, Insights and Forecast, 2020-2032
- 8.1. Market Analysis, Insights and Forecast - by Equipment
- 8.1.1. Threat Detection Equipment
- 8.1.2. Personal Protection Gear
- 8.1.3. Medical Equipment
- 8.1.4. Temporary Shelter Equipment
- 8.1.5. Mountaineering Equipment
- 8.1.6. Fire Fighting Equipment
- 8.1.7. Other Equipment
- 8.2. Market Analysis, Insights and Forecast - by Vehicle Platform
- 8.2.1. Land
- 8.2.2. Marine
- 8.2.3. Airborne
- 8.1. Market Analysis, Insights and Forecast - by Equipment
- 9. Asia Pacific Emergency and Disaster Response Industry Analysis, Insights and Forecast, 2020-2032
- 9.1. Market Analysis, Insights and Forecast - by Equipment
- 9.1.1. Threat Detection Equipment
- 9.1.2. Personal Protection Gear
- 9.1.3. Medical Equipment
- 9.1.4. Temporary Shelter Equipment
- 9.1.5. Mountaineering Equipment
- 9.1.6. Fire Fighting Equipment
- 9.1.7. Other Equipment
- 9.2. Market Analysis, Insights and Forecast - by Vehicle Platform
- 9.2.1. Land
- 9.2.2. Marine
- 9.2.3. Airborne
- 9.1. Market Analysis, Insights and Forecast - by Equipment
- 10. Latin America Emergency and Disaster Response Industry Analysis, Insights and Forecast, 2020-2032
- 10.1. Market Analysis, Insights and Forecast - by Equipment
- 10.1.1. Threat Detection Equipment
- 10.1.2. Personal Protection Gear
- 10.1.3. Medical Equipment
- 10.1.4. Temporary Shelter Equipment
- 10.1.5. Mountaineering Equipment
- 10.1.6. Fire Fighting Equipment
- 10.1.7. Other Equipment
- 10.2. Market Analysis, Insights and Forecast - by Vehicle Platform
- 10.2.1. Land
- 10.2.2. Marine
- 10.2.3. Airborne
- 10.1. Market Analysis, Insights and Forecast - by Equipment
- 11. Middle East and Africa Emergency and Disaster Response Industry Analysis, Insights and Forecast, 2020-2032
- 11.1. Market Analysis, Insights and Forecast - by Equipment
- 11.1.1. Threat Detection Equipment
- 11.1.2. Personal Protection Gear
- 11.1.3. Medical Equipment
- 11.1.4. Temporary Shelter Equipment
- 11.1.5. Mountaineering Equipment
- 11.1.6. Fire Fighting Equipment
- 11.1.7. Other Equipment
- 11.2. Market Analysis, Insights and Forecast - by Vehicle Platform
- 11.2.1. Land
- 11.2.2. Marine
- 11.2.3. Airborne
- 11.1. Market Analysis, Insights and Forecast - by Equipment
- 12. Competitive Analysis
- 12.1. Company Profiles
- 12.1.1 Textron Inc
- 12.1.1.1. Company Overview
- 12.1.1.2. Products
- 12.1.1.3. Company Financials
- 12.1.1.4. SWOT Analysis
- 12.1.2 Magirus GmbH
- 12.1.2.1. Company Overview
- 12.1.2.2. Products
- 12.1.2.3. Company Financials
- 12.1.2.4. SWOT Analysis
- 12.1.3 Honeywell International Inc
- 12.1.3.1. Company Overview
- 12.1.3.2. Products
- 12.1.3.3. Company Financials
- 12.1.3.4. SWOT Analysis
- 12.1.4 Darley
- 12.1.4.1. Company Overview
- 12.1.4.2. Products
- 12.1.4.3. Company Financials
- 12.1.4.4. SWOT Analysis
- 12.1.5 Leonardo SpA
- 12.1.5.1. Company Overview
- 12.1.5.2. Products
- 12.1.5.3. Company Financials
- 12.1.5.4. SWOT Analysis
- 12.1.6 Smiths Group PLC
- 12.1.6.1. Company Overview
- 12.1.6.2. Products
- 12.1.6.3. Company Financials
- 12.1.6.4. SWOT Analysis
- 12.1.7 Viking Air Ltd
- 12.1.7.1. Company Overview
- 12.1.7.2. Products
- 12.1.7.3. Company Financials
- 12.1.7.4. SWOT Analysis
- 12.1.8 Emergency Medical International
- 12.1.8.1. Company Overview
- 12.1.8.2. Products
- 12.1.8.3. Company Financials
- 12.1.8.4. SWOT Analysis
- 12.1.9 Ziegler GmbH
- 12.1.9.1. Company Overview
- 12.1.9.2. Products
- 12.1.9.3. Company Financials
- 12.1.9.4. SWOT Analysis
- 12.1.10 3M
- 12.1.10.1. Company Overview
- 12.1.10.2. Products
- 12.1.10.3. Company Financials
- 12.1.10.4. SWOT Analysis
- 12.1.11 Juvare LLC
- 12.1.11.1. Company Overview
- 12.1.11.2. Products
- 12.1.11.3. Company Financials
- 12.1.11.4. SWOT Analysis
- 12.1.12 Emergency One Group
- 12.1.12.1. Company Overview
- 12.1.12.2. Products
- 12.1.12.3. Company Financials
- 12.1.12.4. SWOT Analysis
- 12.1.13 Everbridge Inc
- 12.1.13.1. Company Overview
- 12.1.13.2. Products
- 12.1.13.3. Company Financials
- 12.1.13.4. SWOT Analysis
- 12.1.14 Hexagon A
- 12.1.14.1. Company Overview
- 12.1.14.2. Products
- 12.1.14.3. Company Financials
- 12.1.14.4. SWOT Analysis
- 12.1.15 Esri Inc
- 12.1.15.1. Company Overview
- 12.1.15.2. Products
- 12.1.15.3. Company Financials
- 12.1.15.4. SWOT Analysis
- 12.1.16 Rosenbauer International AG
- 12.1.16.1. Company Overview
- 12.1.16.2. Products
- 12.1.16.3. Company Financials
- 12.1.16.4. SWOT Analysis
- 12.1.17 REV Group Inc
- 12.1.17.1. Company Overview
- 12.1.17.2. Products
- 12.1.17.3. Company Financials
- 12.1.17.4. SWOT Analysis
- 12.1.1 Textron Inc
- 12.2. Market Entropy
- 12.2.1 Company's Key Areas Served
- 12.2.2 Recent Developments
- 12.3. Company Market Share Analysis 2025
- 12.3.1 Top 5 Companies Market Share Analysis
- 12.3.2 Top 3 Companies Market Share Analysis
- 12.4. List of Potential Customers
- 13. Research Methodology
List of Figures
- Figure 1: Global Emergency and Disaster Response Industry Revenue Breakdown (Million, %) by Region 2025 & 2033
- Figure 2: North America Emergency and Disaster Response Industry Revenue (Million), by Equipment 2025 & 2033
- Figure 3: North America Emergency and Disaster Response Industry Revenue Share (%), by Equipment 2025 & 2033
- Figure 4: North America Emergency and Disaster Response Industry Revenue (Million), by Vehicle Platform 2025 & 2033
- Figure 5: North America Emergency and Disaster Response Industry Revenue Share (%), by Vehicle Platform 2025 & 2033
- Figure 6: North America Emergency and Disaster Response Industry Revenue (Million), by Country 2025 & 2033
- Figure 7: North America Emergency and Disaster Response Industry Revenue Share (%), by Country 2025 & 2033
- Figure 8: Europe Emergency and Disaster Response Industry Revenue (Million), by Equipment 2025 & 2033
- Figure 9: Europe Emergency and Disaster Response Industry Revenue Share (%), by Equipment 2025 & 2033
- Figure 10: Europe Emergency and Disaster Response Industry Revenue (Million), by Vehicle Platform 2025 & 2033
- Figure 11: Europe Emergency and Disaster Response Industry Revenue Share (%), by Vehicle Platform 2025 & 2033
- Figure 12: Europe Emergency and Disaster Response Industry Revenue (Million), by Country 2025 & 2033
- Figure 13: Europe Emergency and Disaster Response Industry Revenue Share (%), by Country 2025 & 2033
- Figure 14: Asia Pacific Emergency and Disaster Response Industry Revenue (Million), by Equipment 2025 & 2033
- Figure 15: Asia Pacific Emergency and Disaster Response Industry Revenue Share (%), by Equipment 2025 & 2033
- Figure 16: Asia Pacific Emergency and Disaster Response Industry Revenue (Million), by Vehicle Platform 2025 & 2033
- Figure 17: Asia Pacific Emergency and Disaster Response Industry Revenue Share (%), by Vehicle Platform 2025 & 2033
- Figure 18: Asia Pacific Emergency and Disaster Response Industry Revenue (Million), by Country 2025 & 2033
- Figure 19: Asia Pacific Emergency and Disaster Response Industry Revenue Share (%), by Country 2025 & 2033
- Figure 20: Latin America Emergency and Disaster Response Industry Revenue (Million), by Equipment 2025 & 2033
- Figure 21: Latin America Emergency and Disaster Response Industry Revenue Share (%), by Equipment 2025 & 2033
- Figure 22: Latin America Emergency and Disaster Response Industry Revenue (Million), by Vehicle Platform 2025 & 2033
- Figure 23: Latin America Emergency and Disaster Response Industry Revenue Share (%), by Vehicle Platform 2025 & 2033
- Figure 24: Latin America Emergency and Disaster Response Industry Revenue (Million), by Country 2025 & 2033
- Figure 25: Latin America Emergency and Disaster Response Industry Revenue Share (%), by Country 2025 & 2033
- Figure 26: Middle East and Africa Emergency and Disaster Response Industry Revenue (Million), by Equipment 2025 & 2033
- Figure 27: Middle East and Africa Emergency and Disaster Response Industry Revenue Share (%), by Equipment 2025 & 2033
- Figure 28: Middle East and Africa Emergency and Disaster Response Industry Revenue (Million), by Vehicle Platform 2025 & 2033
- Figure 29: Middle East and Africa Emergency and Disaster Response Industry Revenue Share (%), by Vehicle Platform 2025 & 2033
- Figure 30: Middle East and Africa Emergency and Disaster Response Industry Revenue (Million), by Country 2025 & 2033
- Figure 31: Middle East and Africa Emergency and Disaster Response Industry Revenue Share (%), by Country 2025 & 2033
List of Tables
- Table 1: Global Emergency and Disaster Response Industry Revenue Million Forecast, by Equipment 2020 & 2033
- Table 2: Global Emergency and Disaster Response Industry Revenue Million Forecast, by Vehicle Platform 2020 & 2033
- Table 3: Global Emergency and Disaster Response Industry Revenue Million Forecast, by Region 2020 & 2033
- Table 4: Global Emergency and Disaster Response Industry Revenue Million Forecast, by Equipment 2020 & 2033
- Table 5: Global Emergency and Disaster Response Industry Revenue Million Forecast, by Vehicle Platform 2020 & 2033
- Table 6: Global Emergency and Disaster Response Industry Revenue Million Forecast, by Country 2020 & 2033
- Table 7: United States Emergency and Disaster Response Industry Revenue (Million) Forecast, by Application 2020 & 2033
- Table 8: Canada Emergency and Disaster Response Industry Revenue (Million) Forecast, by Application 2020 & 2033
- Table 9: Global Emergency and Disaster Response Industry Revenue Million Forecast, by Equipment 2020 & 2033
- Table 10: Global Emergency and Disaster Response Industry Revenue Million Forecast, by Vehicle Platform 2020 & 2033
- Table 11: Global Emergency and Disaster Response Industry Revenue Million Forecast, by Country 2020 & 2033
- Table 12: United Kingdom Emergency and Disaster Response Industry Revenue (Million) Forecast, by Application 2020 & 2033
- Table 13: Germany Emergency and Disaster Response Industry Revenue (Million) Forecast, by Application 2020 & 2033
- Table 14: France Emergency and Disaster Response Industry Revenue (Million) Forecast, by Application 2020 & 2033
- Table 15: Italy Emergency and Disaster Response Industry Revenue (Million) Forecast, by Application 2020 & 2033
- Table 16: Russia Emergency and Disaster Response Industry Revenue (Million) Forecast, by Application 2020 & 2033
- Table 17: Rest of Europe Emergency and Disaster Response Industry Revenue (Million) Forecast, by Application 2020 & 2033
- Table 18: Global Emergency and Disaster Response Industry Revenue Million Forecast, by Equipment 2020 & 2033
- Table 19: Global Emergency and Disaster Response Industry Revenue Million Forecast, by Vehicle Platform 2020 & 2033
- Table 20: Global Emergency and Disaster Response Industry Revenue Million Forecast, by Country 2020 & 2033
- Table 21: China Emergency and Disaster Response Industry Revenue (Million) Forecast, by Application 2020 & 2033
- Table 22: India Emergency and Disaster Response Industry Revenue (Million) Forecast, by Application 2020 & 2033
- Table 23: Japan Emergency and Disaster Response Industry Revenue (Million) Forecast, by Application 2020 & 2033
- Table 24: South Korea Emergency and Disaster Response Industry Revenue (Million) Forecast, by Application 2020 & 2033
- Table 25: Australia Emergency and Disaster Response Industry Revenue (Million) Forecast, by Application 2020 & 2033
- Table 26: Rest of Asia Pacific Emergency and Disaster Response Industry Revenue (Million) Forecast, by Application 2020 & 2033
- Table 27: Global Emergency and Disaster Response Industry Revenue Million Forecast, by Equipment 2020 & 2033
- Table 28: Global Emergency and Disaster Response Industry Revenue Million Forecast, by Vehicle Platform 2020 & 2033
- Table 29: Global Emergency and Disaster Response Industry Revenue Million Forecast, by Country 2020 & 2033
- Table 30: Brazil Emergency and Disaster Response Industry Revenue (Million) Forecast, by Application 2020 & 2033
- Table 31: Mexico Emergency and Disaster Response Industry Revenue (Million) Forecast, by Application 2020 & 2033
- Table 32: Rest of Latin America Emergency and Disaster Response Industry Revenue (Million) Forecast, by Application 2020 & 2033
- Table 33: Global Emergency and Disaster Response Industry Revenue Million Forecast, by Equipment 2020 & 2033
- Table 34: Global Emergency and Disaster Response Industry Revenue Million Forecast, by Vehicle Platform 2020 & 2033
- Table 35: Global Emergency and Disaster Response Industry Revenue Million Forecast, by Country 2020 & 2033
- Table 36: United Arab Emirates Emergency and Disaster Response Industry Revenue (Million) Forecast, by Application 2020 & 2033
- Table 37: Saudi Arabia Emergency and Disaster Response Industry Revenue (Million) Forecast, by Application 2020 & 2033
- Table 38: Egypt Emergency and Disaster Response Industry Revenue (Million) Forecast, by Application 2020 & 2033
- Table 39: South Africa Emergency and Disaster Response Industry Revenue (Million) Forecast, by Application 2020 & 2033
- Table 40: Rest of Middle East and Africa Emergency and Disaster Response Industry Revenue (Million) Forecast, by Application 2020 & 2033
Frequently Asked Questions
1. What is the projected Compound Annual Growth Rate (CAGR) of the Emergency and Disaster Response Industry?
The projected CAGR is approximately 6.58%.
2. Which companies are prominent players in the Emergency and Disaster Response Industry?
Key companies in the market include Textron Inc, Magirus GmbH, Honeywell International Inc, Darley, Leonardo SpA, Smiths Group PLC, Viking Air Ltd, Emergency Medical International, Ziegler GmbH, 3M, Juvare LLC, Emergency One Group, Everbridge Inc, Hexagon A, Esri Inc, Rosenbauer International AG, REV Group Inc.
3. What are the main segments of the Emergency and Disaster Response Industry?
The market segments include Equipment, Vehicle Platform.
4. Can you provide details about the market size?
The market size is estimated to be USD 166.73 Million as of 2022.
5. What are some drivers contributing to market growth?
; Increasing Number Of Air Passengers; Use Of Portable Electronic Devices.
6. What are the notable trends driving market growth?
Land Segment to Register the Highest CAGR during the Forecast Period.
7. Are there any restraints impacting market growth?
; High Cost Of Connectivity Equipments.
8. Can you provide examples of recent developments in the market?
N/A
9. What pricing options are available for accessing the report?
Pricing options include single-user, multi-user, and enterprise licenses priced at USD 4750, USD 5250, and USD 8750 respectively.
10. Is the market size provided in terms of value or volume?
The market size is provided in terms of value, measured in Million.
11. Are there any specific market keywords associated with the report?
Yes, the market keyword associated with the report is "Emergency and Disaster Response Industry," which aids in identifying and referencing the specific market segment covered.
12. How do I determine which pricing option suits my needs best?
The pricing options vary based on user requirements and access needs. Individual users may opt for single-user licenses, while businesses requiring broader access may choose multi-user or enterprise licenses for cost-effective access to the report.
13. Are there any additional resources or data provided in the Emergency and Disaster Response Industry report?
While the report offers comprehensive insights, it's advisable to review the specific contents or supplementary materials provided to ascertain if additional resources or data are available.
14. How can I stay updated on further developments or reports in the Emergency and Disaster Response Industry?
To stay informed about further developments, trends, and reports in the Emergency and Disaster Response Industry, consider subscribing to industry newsletters, following relevant companies and organizations, or regularly checking reputable industry news sources and publications.
Methodology
Step 1 - Identification of Relevant Samples Size from Population Database


Step 2 - Approaches for Defining Global Market Size (Value, Volume* & Price*)

Note*: In applicable scenarios
Step 3 - Data Sources
Primary Research
- Web Analytics
- Survey Reports
- Research Institute
- Latest Research Reports
- Opinion Leaders
Secondary Research
- Annual Reports
- White Paper
- Latest Press Release
- Industry Association
- Paid Database
- Investor Presentations

Step 4 - Data Triangulation
Involves using different sources of information in order to increase the validity of a study
These sources are likely to be stakeholders in a program - participants, other researchers, program staff, other community members, and so on.
Then we put all data in single framework & apply various statistical tools to find out the dynamic on the market.
During the analysis stage, feedback from the stakeholder groups would be compared to determine areas of agreement as well as areas of divergence