

Key Insights
The Algorithmic IT Operations (AITO) market within the financial services sector is experiencing robust growth, driven by the increasing need for enhanced efficiency, reduced operational costs, and improved risk management. The sector's reliance on complex, interconnected systems makes proactive, automated monitoring and incident resolution critical. AITO solutions leverage machine learning and artificial intelligence to analyze vast datasets, predict potential outages, automate remediation processes, and optimize resource allocation. This translates to faster incident resolution times, minimizing service disruptions and associated financial losses. The market's expansion is further fueled by stringent regulatory compliance requirements and the rising adoption of cloud-based infrastructure within financial institutions. Competition is intense, with established players like IBM, Splunk, and ServiceNow competing alongside agile newcomers, each offering specialized features and integrations tailored to the unique needs of financial services.
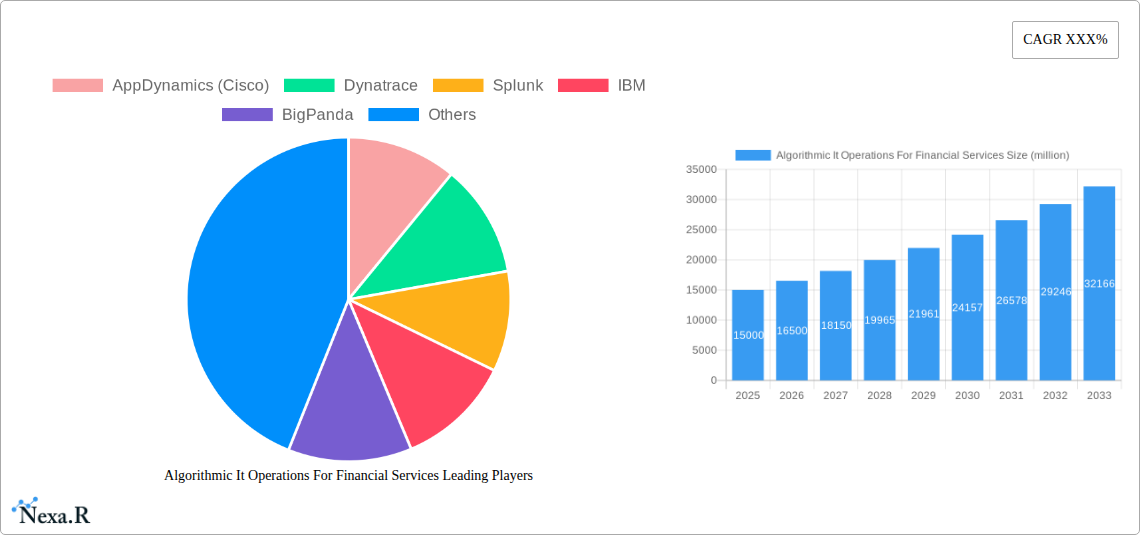
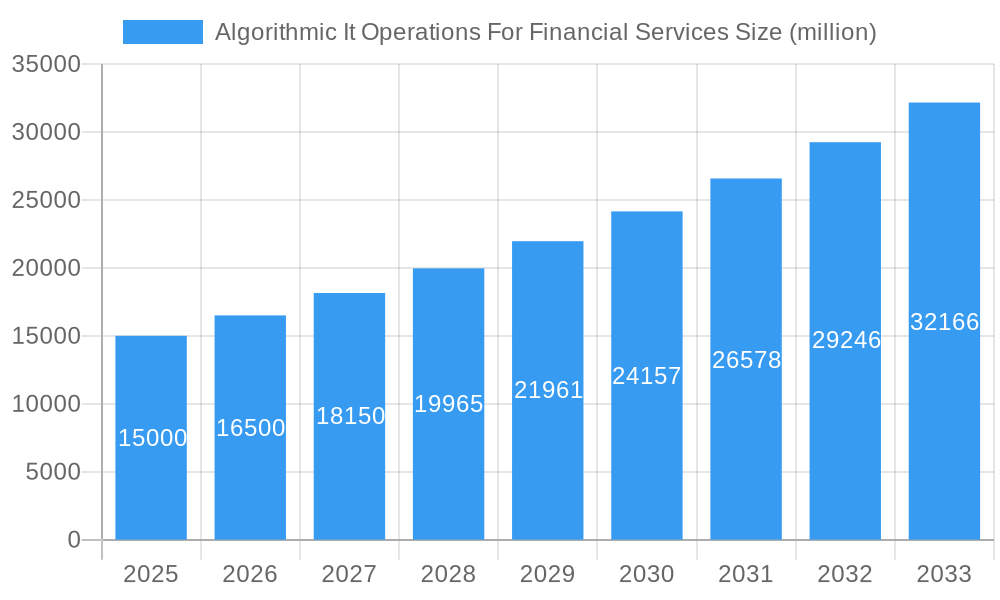
Algorithmic It Operations For Financial Services Market Size (In Billion)
The forecast period (2025-2033) suggests continued strong growth, albeit potentially at a slightly moderated CAGR compared to the historical period (2019-2024), as the market matures and the initial surge of adoption plateaus. Nevertheless, innovation in areas such as AIOps for cybersecurity, improved integration with existing financial technology (fintech) stacks, and the development of more sophisticated predictive analytics will maintain market momentum. Challenges remain, including the high initial investment costs associated with implementing AITO solutions, the need for skilled personnel to manage and interpret the data, and concerns surrounding data security and privacy within the highly regulated financial environment. Despite these hurdles, the long-term outlook for AITO within financial services remains exceptionally positive, promising significant improvements in operational efficiency and resilience.
Algorithmic It Operations For Financial Services Company Market Share
Algorithmic IT Operations for Financial Services Market Report: 2019-2033
This comprehensive report provides a deep dive into the Algorithmic IT Operations market within the Financial Services sector (parent market: IT Operations Management; child market: Financial Technology). It analyzes market dynamics, growth trends, key players, and future opportunities from 2019 to 2033, with a focus on 2025. This report is crucial for executives, investors, and industry professionals seeking to understand and capitalize on this rapidly evolving market. The market is projected to reach xx million by 2033.
Algorithmic IT Operations For Financial Services Market Dynamics & Structure
This section analyzes the market's competitive landscape, technological advancements, regulatory influences, and market evolution. The study period covers 2019-2033, with 2025 as the base and estimated year.
- Market Concentration: The market exhibits a moderately concentrated structure, with several dominant players holding significant market share. In 2025, the top 5 players are estimated to collectively control approximately 60% of the market.
- Technological Innovation Drivers: AI, machine learning, and automation are key drivers, enabling predictive analytics, proactive incident management, and improved operational efficiency.
- Regulatory Frameworks: Stringent regulations within the financial services sector, such as GDPR and CCPA, influence the adoption of algorithmic IT operations solutions for enhanced data security and compliance.
- Competitive Product Substitutes: Traditional IT Operations management tools face increasing competition from AI-powered solutions offering superior automation and analytics.
- End-User Demographics: Large financial institutions, banks, and investment firms are the primary adopters, followed by smaller financial technology companies seeking to enhance agility and efficiency.
- M&A Trends: The market has witnessed a moderate level of M&A activity in the historical period (2019-2024), with an estimated xx million in deal value. Consolidation is expected to continue, driven by the need for enhanced capabilities and market reach. Innovation barriers include high initial investment costs and the need for specialized skills.
Algorithmic IT Operations For Financial Services Growth Trends & Insights
Leveraging extensive market research and data analysis, this section provides a detailed assessment of the market's growth trajectory. The forecast period is 2025-2033. The market exhibited a CAGR of xx% during the historical period (2019-2024). Adoption rates are increasing significantly driven by the need for improved risk management, increased operational efficiency, and compliance with regulatory requirements. Technological disruptions such as the rise of cloud computing and the increasing adoption of DevOps methodologies are accelerating market growth. Shifts in consumer behavior, particularly increased reliance on digital services and heightened expectations for seamless experiences, are pushing financial institutions to prioritize efficient and secure IT operations. The market penetration rate is currently estimated at xx% and is projected to reach xx% by 2033.
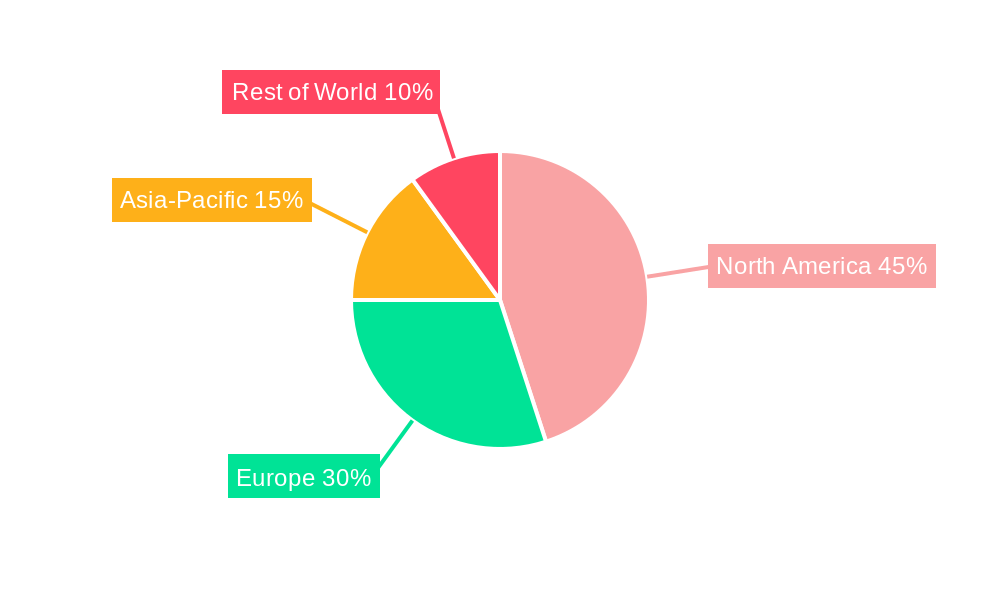
Dominant Regions, Countries, or Segments in Algorithmic IT Operations For Financial Services
North America currently holds the largest market share, driven by high technological adoption rates and a robust financial services sector.
- Key Drivers in North America:
- Advanced technological infrastructure
- Early adoption of AI/ML technologies
- Strong regulatory environment pushing for advanced IT solutions
- Europe: The European market is experiencing significant growth, driven by increasing regulatory compliance needs and the growing adoption of cloud services.
- Asia-Pacific: This region shows substantial growth potential, driven by rapid digital transformation in emerging economies and increasing investments in financial technology.
Dominance factors include a high concentration of major financial institutions, advanced technological infrastructure, and supportive regulatory environments. The region with the highest growth potential in the forecast period is projected to be Asia-Pacific, driven by its expanding financial sector and increasing adoption of digital technologies.
Algorithmic IT Operations For Financial Services Product Landscape
Algorithmic IT operations solutions encompass a range of products, including AIOps platforms, machine learning algorithms for predictive analytics, and automated incident response systems. These products offer unique selling propositions such as reduced MTTR (Mean Time To Resolution), improved operational efficiency, and enhanced risk management capabilities. Recent technological advancements include the integration of advanced analytics, natural language processing, and automation capabilities, leading to more sophisticated and user-friendly solutions.
Key Drivers, Barriers & Challenges in Algorithmic It Operations For Financial Services
Key Drivers:
- Increasing demand for enhanced IT operational efficiency and reduced costs.
- The need for proactive risk management and compliance with stringent regulations.
- Growing adoption of cloud computing and DevOps methodologies.
Key Challenges and Restraints:
- High initial investment costs for implementing AIOps solutions.
- Lack of skilled professionals with expertise in AI and machine learning.
- Integration challenges with existing IT infrastructure. This results in an estimated xx million in lost revenue annually for the industry.
Emerging Opportunities in Algorithmic It Operations For Financial Services
Emerging opportunities include the application of AI for fraud detection and prevention, the development of more sophisticated predictive analytics models for risk assessment, and the integration of blockchain technology for enhancing security and transparency. Untapped markets exist in smaller financial institutions and emerging economies.
Growth Accelerators in the Algorithmic It Operations For Financial Services Industry
Technological advancements, strategic partnerships, and market expansion strategies are key growth catalysts. The development of more sophisticated AI algorithms, the integration of cloud-native technologies, and the expansion into new geographical markets are expected to drive significant market growth in the forecast period.
Key Players Shaping the Algorithmic It Operations For Financial Services Market
Notable Milestones in Algorithmic It Operations For Financial Services Sector
- 2020 Q4: Increased adoption of AIOps solutions driven by the COVID-19 pandemic and the need for remote work capabilities.
- 2021 Q2: Launch of several new AIOps platforms with enhanced AI and machine learning capabilities.
- 2022 Q3: Significant M&A activity in the sector, driven by consolidation and the need for broader capabilities.
- 2023 Q1: Growing focus on regulatory compliance and data privacy in AIOps solutions.
In-Depth Algorithmic It Operations For Financial Services Market Outlook
The market is poised for continued strong growth, driven by ongoing technological innovation, increasing adoption rates, and the growing demand for efficient and secure IT operations within the financial services sector. Strategic opportunities exist in developing advanced AI/ML algorithms for fraud detection and risk management, integrating blockchain technologies for improved security, and expanding into untapped markets in emerging economies. The market's potential is substantial, offering significant opportunities for companies involved in developing and implementing algorithmic IT operations solutions.
Algorithmic It Operations For Financial Services Segmentation
-
1. Application
- 1.1. Banking
- 1.2. Insurance
- 1.3. Investment
- 1.4. Others
- 1.5. Banking
- 1.6. Insurance
- 1.7. Investment
- 1.8. Others
-
2. Type
- 2.1. Cloud
- 2.2. On-Premises
- 2.3. Cloud
- 2.4. On-Premises
Algorithmic It Operations For Financial Services Segmentation By Geography
-
1. North America
- 1.1. United States
- 1.2. Canada
- 1.3. Mexico
-
2. South America
- 2.1. Brazil
- 2.2. Argentina
- 2.3. Rest of South America
-
3. Europe
- 3.1. United Kingdom
- 3.2. Germany
- 3.3. France
- 3.4. Italy
- 3.5. Spain
- 3.6. Russia
- 3.7. Benelux
- 3.8. Nordics
- 3.9. Rest of Europe
-
4. Middle East & Africa
- 4.1. Turkey
- 4.2. Israel
- 4.3. GCC
- 4.4. North Africa
- 4.5. South Africa
- 4.6. Rest of Middle East & Africa
-
5. Asia Pacific
- 5.1. China
- 5.2. India
- 5.3. Japan
- 5.4. South Korea
- 5.5. ASEAN
- 5.6. Oceania
- 5.7. Rest of Asia Pacific
Algorithmic It Operations For Financial Services Regional Market Share
Geographic Coverage of Algorithmic It Operations For Financial Services
Algorithmic It Operations For Financial Services REPORT HIGHLIGHTS
| Aspects | Details |
|---|---|
| Study Period | 2020-2034 |
| Base Year | 2025 |
| Estimated Year | 2026 |
| Forecast Period | 2026-2034 |
| Historical Period | 2020-2025 |
| Growth Rate | CAGR of XXX% from 2020-2034 |
| Segmentation |
|
Table of Contents
- 1. Introduction
- 1.1. Research Scope
- 1.2. Market Segmentation
- 1.3. Research Methodology
- 1.4. Definitions and Assumptions
- 2. Executive Summary
- 2.1. Introduction
- 3. Market Dynamics
- 3.1. Introduction
- 3.2. Market Drivers
- 3.3. Market Restrains
- 3.4. Market Trends
- 4. Market Factor Analysis
- 4.1. Porters Five Forces
- 4.2. Supply/Value Chain
- 4.3. PESTEL analysis
- 4.4. Market Entropy
- 4.5. Patent/Trademark Analysis
- 5. Global Algorithmic It Operations For Financial Services Analysis, Insights and Forecast, 2020-2032
- 5.1. Market Analysis, Insights and Forecast - by Application
- 5.1.1. Banking
- 5.1.2. Insurance
- 5.1.3. Investment
- 5.1.4. Others
- 5.1.5. Banking
- 5.1.6. Insurance
- 5.1.7. Investment
- 5.1.8. Others
- 5.2. Market Analysis, Insights and Forecast - by Type
- 5.2.1. Cloud
- 5.2.2. On-Premises
- 5.2.3. Cloud
- 5.2.4. On-Premises
- 5.3. Market Analysis, Insights and Forecast - by Region
- 5.3.1. North America
- 5.3.2. South America
- 5.3.3. Europe
- 5.3.4. Middle East & Africa
- 5.3.5. Asia Pacific
- 5.1. Market Analysis, Insights and Forecast - by Application
- 6. North America Algorithmic It Operations For Financial Services Analysis, Insights and Forecast, 2020-2032
- 6.1. Market Analysis, Insights and Forecast - by Application
- 6.1.1. Banking
- 6.1.2. Insurance
- 6.1.3. Investment
- 6.1.4. Others
- 6.1.5. Banking
- 6.1.6. Insurance
- 6.1.7. Investment
- 6.1.8. Others
- 6.2. Market Analysis, Insights and Forecast - by Type
- 6.2.1. Cloud
- 6.2.2. On-Premises
- 6.2.3. Cloud
- 6.2.4. On-Premises
- 6.1. Market Analysis, Insights and Forecast - by Application
- 7. South America Algorithmic It Operations For Financial Services Analysis, Insights and Forecast, 2020-2032
- 7.1. Market Analysis, Insights and Forecast - by Application
- 7.1.1. Banking
- 7.1.2. Insurance
- 7.1.3. Investment
- 7.1.4. Others
- 7.1.5. Banking
- 7.1.6. Insurance
- 7.1.7. Investment
- 7.1.8. Others
- 7.2. Market Analysis, Insights and Forecast - by Type
- 7.2.1. Cloud
- 7.2.2. On-Premises
- 7.2.3. Cloud
- 7.2.4. On-Premises
- 7.1. Market Analysis, Insights and Forecast - by Application
- 8. Europe Algorithmic It Operations For Financial Services Analysis, Insights and Forecast, 2020-2032
- 8.1. Market Analysis, Insights and Forecast - by Application
- 8.1.1. Banking
- 8.1.2. Insurance
- 8.1.3. Investment
- 8.1.4. Others
- 8.1.5. Banking
- 8.1.6. Insurance
- 8.1.7. Investment
- 8.1.8. Others
- 8.2. Market Analysis, Insights and Forecast - by Type
- 8.2.1. Cloud
- 8.2.2. On-Premises
- 8.2.3. Cloud
- 8.2.4. On-Premises
- 8.1. Market Analysis, Insights and Forecast - by Application
- 9. Middle East & Africa Algorithmic It Operations For Financial Services Analysis, Insights and Forecast, 2020-2032
- 9.1. Market Analysis, Insights and Forecast - by Application
- 9.1.1. Banking
- 9.1.2. Insurance
- 9.1.3. Investment
- 9.1.4. Others
- 9.1.5. Banking
- 9.1.6. Insurance
- 9.1.7. Investment
- 9.1.8. Others
- 9.2. Market Analysis, Insights and Forecast - by Type
- 9.2.1. Cloud
- 9.2.2. On-Premises
- 9.2.3. Cloud
- 9.2.4. On-Premises
- 9.1. Market Analysis, Insights and Forecast - by Application
- 10. Asia Pacific Algorithmic It Operations For Financial Services Analysis, Insights and Forecast, 2020-2032
- 10.1. Market Analysis, Insights and Forecast - by Application
- 10.1.1. Banking
- 10.1.2. Insurance
- 10.1.3. Investment
- 10.1.4. Others
- 10.1.5. Banking
- 10.1.6. Insurance
- 10.1.7. Investment
- 10.1.8. Others
- 10.2. Market Analysis, Insights and Forecast - by Type
- 10.2.1. Cloud
- 10.2.2. On-Premises
- 10.2.3. Cloud
- 10.2.4. On-Premises
- 10.1. Market Analysis, Insights and Forecast - by Application
- 11. Competitive Analysis
- 11.1. Global Market Share Analysis 2025
- 11.2. Company Profiles
- 11.2.1 AppDynamics (Cisco)
- 11.2.1.1. Overview
- 11.2.1.2. Products
- 11.2.1.3. SWOT Analysis
- 11.2.1.4. Recent Developments
- 11.2.1.5. Financials (Based on Availability)
- 11.2.2 Dynatrace
- 11.2.2.1. Overview
- 11.2.2.2. Products
- 11.2.2.3. SWOT Analysis
- 11.2.2.4. Recent Developments
- 11.2.2.5. Financials (Based on Availability)
- 11.2.3 Splunk
- 11.2.3.1. Overview
- 11.2.3.2. Products
- 11.2.3.3. SWOT Analysis
- 11.2.3.4. Recent Developments
- 11.2.3.5. Financials (Based on Availability)
- 11.2.4 IBM
- 11.2.4.1. Overview
- 11.2.4.2. Products
- 11.2.4.3. SWOT Analysis
- 11.2.4.4. Recent Developments
- 11.2.4.5. Financials (Based on Availability)
- 11.2.5 BigPanda
- 11.2.5.1. Overview
- 11.2.5.2. Products
- 11.2.5.3. SWOT Analysis
- 11.2.5.4. Recent Developments
- 11.2.5.5. Financials (Based on Availability)
- 11.2.6 BMC Software
- 11.2.6.1. Overview
- 11.2.6.2. Products
- 11.2.6.3. SWOT Analysis
- 11.2.6.4. Recent Developments
- 11.2.6.5. Financials (Based on Availability)
- 11.2.7 Unisys
- 11.2.7.1. Overview
- 11.2.7.2. Products
- 11.2.7.3. SWOT Analysis
- 11.2.7.4. Recent Developments
- 11.2.7.5. Financials (Based on Availability)
- 11.2.8 Zenoss
- 11.2.8.1. Overview
- 11.2.8.2. Products
- 11.2.8.3. SWOT Analysis
- 11.2.8.4. Recent Developments
- 11.2.8.5. Financials (Based on Availability)
- 11.2.9 Moogsoft
- 11.2.9.1. Overview
- 11.2.9.2. Products
- 11.2.9.3. SWOT Analysis
- 11.2.9.4. Recent Developments
- 11.2.9.5. Financials (Based on Availability)
- 11.2.10 PagerDuty
- 11.2.10.1. Overview
- 11.2.10.2. Products
- 11.2.10.3. SWOT Analysis
- 11.2.10.4. Recent Developments
- 11.2.10.5. Financials (Based on Availability)
- 11.2.11 Datadog
- 11.2.11.1. Overview
- 11.2.11.2. Products
- 11.2.11.3. SWOT Analysis
- 11.2.11.4. Recent Developments
- 11.2.11.5. Financials (Based on Availability)
- 11.2.12 Micro Focus
- 11.2.12.1. Overview
- 11.2.12.2. Products
- 11.2.12.3. SWOT Analysis
- 11.2.12.4. Recent Developments
- 11.2.12.5. Financials (Based on Availability)
- 11.2.13 Netreo
- 11.2.13.1. Overview
- 11.2.13.2. Products
- 11.2.13.3. SWOT Analysis
- 11.2.13.4. Recent Developments
- 11.2.13.5. Financials (Based on Availability)
- 11.2.14 ScienceLogic
- 11.2.14.1. Overview
- 11.2.14.2. Products
- 11.2.14.3. SWOT Analysis
- 11.2.14.4. Recent Developments
- 11.2.14.5. Financials (Based on Availability)
- 11.2.15 ServiceNow
- 11.2.15.1. Overview
- 11.2.15.2. Products
- 11.2.15.3. SWOT Analysis
- 11.2.15.4. Recent Developments
- 11.2.15.5. Financials (Based on Availability)
- 11.2.16 Broadcom
- 11.2.16.1. Overview
- 11.2.16.2. Products
- 11.2.16.3. SWOT Analysis
- 11.2.16.4. Recent Developments
- 11.2.16.5. Financials (Based on Availability)
- 11.2.17 New Relic
- 11.2.17.1. Overview
- 11.2.17.2. Products
- 11.2.17.3. SWOT Analysis
- 11.2.17.4. Recent Developments
- 11.2.17.5. Financials (Based on Availability)
- 11.2.18 StackState
- 11.2.18.1. Overview
- 11.2.18.2. Products
- 11.2.18.3. SWOT Analysis
- 11.2.18.4. Recent Developments
- 11.2.18.5. Financials (Based on Availability)
- 11.2.19 AppDynamics (Cisco)
- 11.2.19.1. Overview
- 11.2.19.2. Products
- 11.2.19.3. SWOT Analysis
- 11.2.19.4. Recent Developments
- 11.2.19.5. Financials (Based on Availability)
- 11.2.20 Dynatrace
- 11.2.20.1. Overview
- 11.2.20.2. Products
- 11.2.20.3. SWOT Analysis
- 11.2.20.4. Recent Developments
- 11.2.20.5. Financials (Based on Availability)
- 11.2.21 Splunk
- 11.2.21.1. Overview
- 11.2.21.2. Products
- 11.2.21.3. SWOT Analysis
- 11.2.21.4. Recent Developments
- 11.2.21.5. Financials (Based on Availability)
- 11.2.22 IBM
- 11.2.22.1. Overview
- 11.2.22.2. Products
- 11.2.22.3. SWOT Analysis
- 11.2.22.4. Recent Developments
- 11.2.22.5. Financials (Based on Availability)
- 11.2.23 BigPanda
- 11.2.23.1. Overview
- 11.2.23.2. Products
- 11.2.23.3. SWOT Analysis
- 11.2.23.4. Recent Developments
- 11.2.23.5. Financials (Based on Availability)
- 11.2.24 BMC Software
- 11.2.24.1. Overview
- 11.2.24.2. Products
- 11.2.24.3. SWOT Analysis
- 11.2.24.4. Recent Developments
- 11.2.24.5. Financials (Based on Availability)
- 11.2.25 Unisys
- 11.2.25.1. Overview
- 11.2.25.2. Products
- 11.2.25.3. SWOT Analysis
- 11.2.25.4. Recent Developments
- 11.2.25.5. Financials (Based on Availability)
- 11.2.26 Zenoss
- 11.2.26.1. Overview
- 11.2.26.2. Products
- 11.2.26.3. SWOT Analysis
- 11.2.26.4. Recent Developments
- 11.2.26.5. Financials (Based on Availability)
- 11.2.27 Moogsoft
- 11.2.27.1. Overview
- 11.2.27.2. Products
- 11.2.27.3. SWOT Analysis
- 11.2.27.4. Recent Developments
- 11.2.27.5. Financials (Based on Availability)
- 11.2.28 PagerDuty
- 11.2.28.1. Overview
- 11.2.28.2. Products
- 11.2.28.3. SWOT Analysis
- 11.2.28.4. Recent Developments
- 11.2.28.5. Financials (Based on Availability)
- 11.2.29 Datadog
- 11.2.29.1. Overview
- 11.2.29.2. Products
- 11.2.29.3. SWOT Analysis
- 11.2.29.4. Recent Developments
- 11.2.29.5. Financials (Based on Availability)
- 11.2.30 Micro Focus
- 11.2.30.1. Overview
- 11.2.30.2. Products
- 11.2.30.3. SWOT Analysis
- 11.2.30.4. Recent Developments
- 11.2.30.5. Financials (Based on Availability)
- 11.2.31 Netreo
- 11.2.31.1. Overview
- 11.2.31.2. Products
- 11.2.31.3. SWOT Analysis
- 11.2.31.4. Recent Developments
- 11.2.31.5. Financials (Based on Availability)
- 11.2.32 ScienceLogic
- 11.2.32.1. Overview
- 11.2.32.2. Products
- 11.2.32.3. SWOT Analysis
- 11.2.32.4. Recent Developments
- 11.2.32.5. Financials (Based on Availability)
- 11.2.33 ServiceNow
- 11.2.33.1. Overview
- 11.2.33.2. Products
- 11.2.33.3. SWOT Analysis
- 11.2.33.4. Recent Developments
- 11.2.33.5. Financials (Based on Availability)
- 11.2.34 Broadcom
- 11.2.34.1. Overview
- 11.2.34.2. Products
- 11.2.34.3. SWOT Analysis
- 11.2.34.4. Recent Developments
- 11.2.34.5. Financials (Based on Availability)
- 11.2.35 New Relic
- 11.2.35.1. Overview
- 11.2.35.2. Products
- 11.2.35.3. SWOT Analysis
- 11.2.35.4. Recent Developments
- 11.2.35.5. Financials (Based on Availability)
- 11.2.36 StackState
- 11.2.36.1. Overview
- 11.2.36.2. Products
- 11.2.36.3. SWOT Analysis
- 11.2.36.4. Recent Developments
- 11.2.36.5. Financials (Based on Availability)
- 11.2.1 AppDynamics (Cisco)
List of Figures
- Figure 1: Global Algorithmic It Operations For Financial Services Revenue Breakdown (million, %) by Region 2025 & 2033
- Figure 2: North America Algorithmic It Operations For Financial Services Revenue (million), by Application 2025 & 2033
- Figure 3: North America Algorithmic It Operations For Financial Services Revenue Share (%), by Application 2025 & 2033
- Figure 4: North America Algorithmic It Operations For Financial Services Revenue (million), by Type 2025 & 2033
- Figure 5: North America Algorithmic It Operations For Financial Services Revenue Share (%), by Type 2025 & 2033
- Figure 6: North America Algorithmic It Operations For Financial Services Revenue (million), by Country 2025 & 2033
- Figure 7: North America Algorithmic It Operations For Financial Services Revenue Share (%), by Country 2025 & 2033
- Figure 8: South America Algorithmic It Operations For Financial Services Revenue (million), by Application 2025 & 2033
- Figure 9: South America Algorithmic It Operations For Financial Services Revenue Share (%), by Application 2025 & 2033
- Figure 10: South America Algorithmic It Operations For Financial Services Revenue (million), by Type 2025 & 2033
- Figure 11: South America Algorithmic It Operations For Financial Services Revenue Share (%), by Type 2025 & 2033
- Figure 12: South America Algorithmic It Operations For Financial Services Revenue (million), by Country 2025 & 2033
- Figure 13: South America Algorithmic It Operations For Financial Services Revenue Share (%), by Country 2025 & 2033
- Figure 14: Europe Algorithmic It Operations For Financial Services Revenue (million), by Application 2025 & 2033
- Figure 15: Europe Algorithmic It Operations For Financial Services Revenue Share (%), by Application 2025 & 2033
- Figure 16: Europe Algorithmic It Operations For Financial Services Revenue (million), by Type 2025 & 2033
- Figure 17: Europe Algorithmic It Operations For Financial Services Revenue Share (%), by Type 2025 & 2033
- Figure 18: Europe Algorithmic It Operations For Financial Services Revenue (million), by Country 2025 & 2033
- Figure 19: Europe Algorithmic It Operations For Financial Services Revenue Share (%), by Country 2025 & 2033
- Figure 20: Middle East & Africa Algorithmic It Operations For Financial Services Revenue (million), by Application 2025 & 2033
- Figure 21: Middle East & Africa Algorithmic It Operations For Financial Services Revenue Share (%), by Application 2025 & 2033
- Figure 22: Middle East & Africa Algorithmic It Operations For Financial Services Revenue (million), by Type 2025 & 2033
- Figure 23: Middle East & Africa Algorithmic It Operations For Financial Services Revenue Share (%), by Type 2025 & 2033
- Figure 24: Middle East & Africa Algorithmic It Operations For Financial Services Revenue (million), by Country 2025 & 2033
- Figure 25: Middle East & Africa Algorithmic It Operations For Financial Services Revenue Share (%), by Country 2025 & 2033
- Figure 26: Asia Pacific Algorithmic It Operations For Financial Services Revenue (million), by Application 2025 & 2033
- Figure 27: Asia Pacific Algorithmic It Operations For Financial Services Revenue Share (%), by Application 2025 & 2033
- Figure 28: Asia Pacific Algorithmic It Operations For Financial Services Revenue (million), by Type 2025 & 2033
- Figure 29: Asia Pacific Algorithmic It Operations For Financial Services Revenue Share (%), by Type 2025 & 2033
- Figure 30: Asia Pacific Algorithmic It Operations For Financial Services Revenue (million), by Country 2025 & 2033
- Figure 31: Asia Pacific Algorithmic It Operations For Financial Services Revenue Share (%), by Country 2025 & 2033
List of Tables
- Table 1: Global Algorithmic It Operations For Financial Services Revenue million Forecast, by Application 2020 & 2033
- Table 2: Global Algorithmic It Operations For Financial Services Revenue million Forecast, by Type 2020 & 2033
- Table 3: Global Algorithmic It Operations For Financial Services Revenue million Forecast, by Region 2020 & 2033
- Table 4: Global Algorithmic It Operations For Financial Services Revenue million Forecast, by Application 2020 & 2033
- Table 5: Global Algorithmic It Operations For Financial Services Revenue million Forecast, by Type 2020 & 2033
- Table 6: Global Algorithmic It Operations For Financial Services Revenue million Forecast, by Country 2020 & 2033
- Table 7: United States Algorithmic It Operations For Financial Services Revenue (million) Forecast, by Application 2020 & 2033
- Table 8: Canada Algorithmic It Operations For Financial Services Revenue (million) Forecast, by Application 2020 & 2033
- Table 9: Mexico Algorithmic It Operations For Financial Services Revenue (million) Forecast, by Application 2020 & 2033
- Table 10: Global Algorithmic It Operations For Financial Services Revenue million Forecast, by Application 2020 & 2033
- Table 11: Global Algorithmic It Operations For Financial Services Revenue million Forecast, by Type 2020 & 2033
- Table 12: Global Algorithmic It Operations For Financial Services Revenue million Forecast, by Country 2020 & 2033
- Table 13: Brazil Algorithmic It Operations For Financial Services Revenue (million) Forecast, by Application 2020 & 2033
- Table 14: Argentina Algorithmic It Operations For Financial Services Revenue (million) Forecast, by Application 2020 & 2033
- Table 15: Rest of South America Algorithmic It Operations For Financial Services Revenue (million) Forecast, by Application 2020 & 2033
- Table 16: Global Algorithmic It Operations For Financial Services Revenue million Forecast, by Application 2020 & 2033
- Table 17: Global Algorithmic It Operations For Financial Services Revenue million Forecast, by Type 2020 & 2033
- Table 18: Global Algorithmic It Operations For Financial Services Revenue million Forecast, by Country 2020 & 2033
- Table 19: United Kingdom Algorithmic It Operations For Financial Services Revenue (million) Forecast, by Application 2020 & 2033
- Table 20: Germany Algorithmic It Operations For Financial Services Revenue (million) Forecast, by Application 2020 & 2033
- Table 21: France Algorithmic It Operations For Financial Services Revenue (million) Forecast, by Application 2020 & 2033
- Table 22: Italy Algorithmic It Operations For Financial Services Revenue (million) Forecast, by Application 2020 & 2033
- Table 23: Spain Algorithmic It Operations For Financial Services Revenue (million) Forecast, by Application 2020 & 2033
- Table 24: Russia Algorithmic It Operations For Financial Services Revenue (million) Forecast, by Application 2020 & 2033
- Table 25: Benelux Algorithmic It Operations For Financial Services Revenue (million) Forecast, by Application 2020 & 2033
- Table 26: Nordics Algorithmic It Operations For Financial Services Revenue (million) Forecast, by Application 2020 & 2033
- Table 27: Rest of Europe Algorithmic It Operations For Financial Services Revenue (million) Forecast, by Application 2020 & 2033
- Table 28: Global Algorithmic It Operations For Financial Services Revenue million Forecast, by Application 2020 & 2033
- Table 29: Global Algorithmic It Operations For Financial Services Revenue million Forecast, by Type 2020 & 2033
- Table 30: Global Algorithmic It Operations For Financial Services Revenue million Forecast, by Country 2020 & 2033
- Table 31: Turkey Algorithmic It Operations For Financial Services Revenue (million) Forecast, by Application 2020 & 2033
- Table 32: Israel Algorithmic It Operations For Financial Services Revenue (million) Forecast, by Application 2020 & 2033
- Table 33: GCC Algorithmic It Operations For Financial Services Revenue (million) Forecast, by Application 2020 & 2033
- Table 34: North Africa Algorithmic It Operations For Financial Services Revenue (million) Forecast, by Application 2020 & 2033
- Table 35: South Africa Algorithmic It Operations For Financial Services Revenue (million) Forecast, by Application 2020 & 2033
- Table 36: Rest of Middle East & Africa Algorithmic It Operations For Financial Services Revenue (million) Forecast, by Application 2020 & 2033
- Table 37: Global Algorithmic It Operations For Financial Services Revenue million Forecast, by Application 2020 & 2033
- Table 38: Global Algorithmic It Operations For Financial Services Revenue million Forecast, by Type 2020 & 2033
- Table 39: Global Algorithmic It Operations For Financial Services Revenue million Forecast, by Country 2020 & 2033
- Table 40: China Algorithmic It Operations For Financial Services Revenue (million) Forecast, by Application 2020 & 2033
- Table 41: India Algorithmic It Operations For Financial Services Revenue (million) Forecast, by Application 2020 & 2033
- Table 42: Japan Algorithmic It Operations For Financial Services Revenue (million) Forecast, by Application 2020 & 2033
- Table 43: South Korea Algorithmic It Operations For Financial Services Revenue (million) Forecast, by Application 2020 & 2033
- Table 44: ASEAN Algorithmic It Operations For Financial Services Revenue (million) Forecast, by Application 2020 & 2033
- Table 45: Oceania Algorithmic It Operations For Financial Services Revenue (million) Forecast, by Application 2020 & 2033
- Table 46: Rest of Asia Pacific Algorithmic It Operations For Financial Services Revenue (million) Forecast, by Application 2020 & 2033
Frequently Asked Questions
1. What is the projected Compound Annual Growth Rate (CAGR) of the Algorithmic It Operations For Financial Services?
The projected CAGR is approximately XXX%.
2. Which companies are prominent players in the Algorithmic It Operations For Financial Services?
Key companies in the market include AppDynamics (Cisco), Dynatrace, Splunk, IBM, BigPanda, BMC Software, Unisys, Zenoss, Moogsoft, PagerDuty, Datadog, Micro Focus, Netreo, ScienceLogic, ServiceNow, Broadcom, New Relic, StackState, AppDynamics (Cisco), Dynatrace, Splunk, IBM, BigPanda, BMC Software, Unisys, Zenoss, Moogsoft, PagerDuty, Datadog, Micro Focus, Netreo, ScienceLogic, ServiceNow, Broadcom, New Relic, StackState.
3. What are the main segments of the Algorithmic It Operations For Financial Services?
The market segments include Application, Type.
4. Can you provide details about the market size?
The market size is estimated to be USD XXX million as of 2022.
5. What are some drivers contributing to market growth?
N/A
6. What are the notable trends driving market growth?
N/A
7. Are there any restraints impacting market growth?
N/A
8. Can you provide examples of recent developments in the market?
N/A
9. What pricing options are available for accessing the report?
Pricing options include single-user, multi-user, and enterprise licenses priced at USD 2900.00, USD 4350.00, and USD 5800.00 respectively.
10. Is the market size provided in terms of value or volume?
The market size is provided in terms of value, measured in million.
11. Are there any specific market keywords associated with the report?
Yes, the market keyword associated with the report is "Algorithmic It Operations For Financial Services," which aids in identifying and referencing the specific market segment covered.
12. How do I determine which pricing option suits my needs best?
The pricing options vary based on user requirements and access needs. Individual users may opt for single-user licenses, while businesses requiring broader access may choose multi-user or enterprise licenses for cost-effective access to the report.
13. Are there any additional resources or data provided in the Algorithmic It Operations For Financial Services report?
While the report offers comprehensive insights, it's advisable to review the specific contents or supplementary materials provided to ascertain if additional resources or data are available.
14. How can I stay updated on further developments or reports in the Algorithmic It Operations For Financial Services?
To stay informed about further developments, trends, and reports in the Algorithmic It Operations For Financial Services, consider subscribing to industry newsletters, following relevant companies and organizations, or regularly checking reputable industry news sources and publications.
Methodology
Step 1 - Identification of Relevant Samples Size from Population Database


Step 2 - Approaches for Defining Global Market Size (Value, Volume* & Price*)

Note*: In applicable scenarios
Step 3 - Data Sources
Primary Research
- Web Analytics
- Survey Reports
- Research Institute
- Latest Research Reports
- Opinion Leaders
Secondary Research
- Annual Reports
- White Paper
- Latest Press Release
- Industry Association
- Paid Database
- Investor Presentations

Step 4 - Data Triangulation
Involves using different sources of information in order to increase the validity of a study
These sources are likely to be stakeholders in a program - participants, other researchers, program staff, other community members, and so on.
Then we put all data in single framework & apply various statistical tools to find out the dynamic on the market.
During the analysis stage, feedback from the stakeholder groups would be compared to determine areas of agreement as well as areas of divergence