

Key Insights
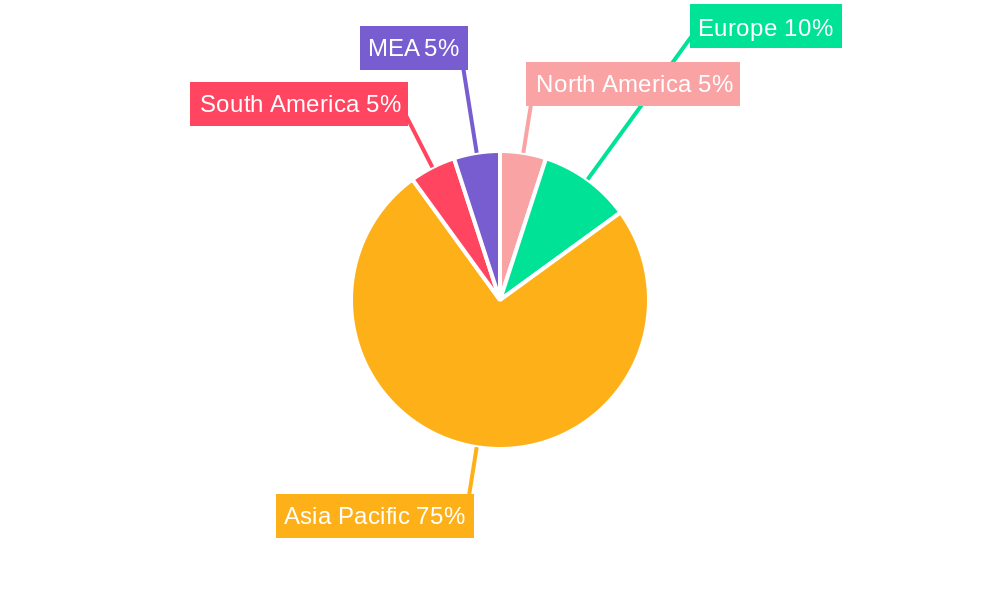
The Asia-Pacific (APAC) bunker fuel market is poised for substantial growth, fueled by escalating maritime trade and a growing demand for sustainable fuel solutions. Projections indicate a robust Compound Annual Growth Rate (CAGR) of 5.8%, driving the market size from an estimated 83.9 billion in the base year 2025 to significant future expansion. Key growth drivers include the expanding container shipping sector, increased tanker fleet operations supporting regional energy flows, and rising energy consumption across APAC economies. A pivotal trend is the industry's transition towards cleaner fuels, such as Very-Low Sulfur Fuel Oil (VLSFO) and Liquefied Natural Gas (LNG), largely influenced by stringent environmental regulations aimed at mitigating marine pollution. Despite potential headwinds from fluctuating fuel prices, the long-term outlook remains optimistic, underpinned by consistent growth in maritime activity and the ongoing shift to cleaner energy sources. Major economies such as China, Japan, India, and South Korea are expected to be significant growth centers due to their substantial shipping volumes and economic development. The increasing adoption of LNG as a marine fuel will further reshape market dynamics, prompting the development of specialized bunkering infrastructure and logistics networks. The competitive landscape features a blend of global energy giants like Total SA, ExxonMobil, and BP, alongside prominent regional players.
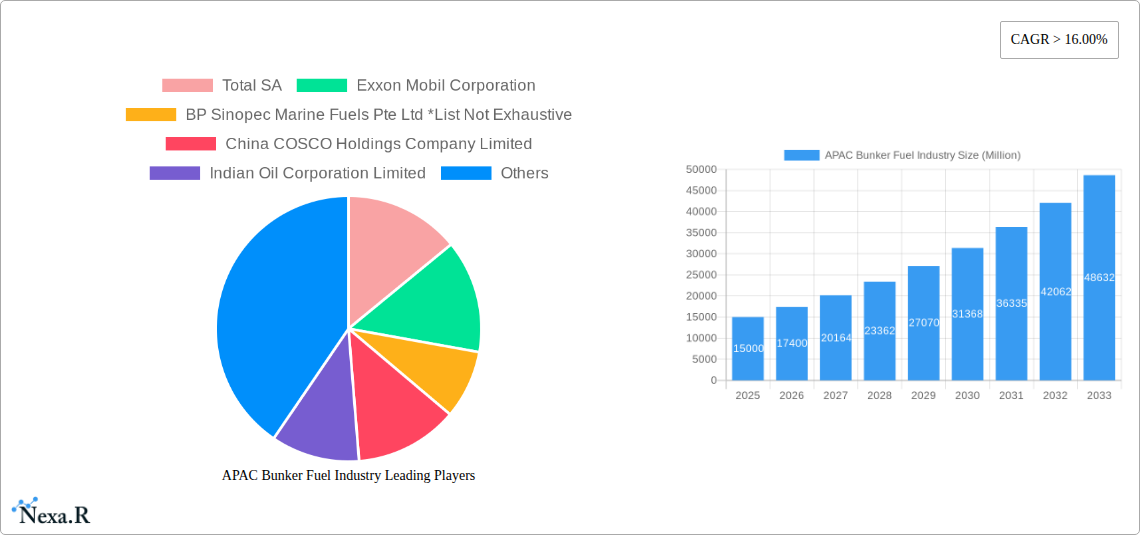
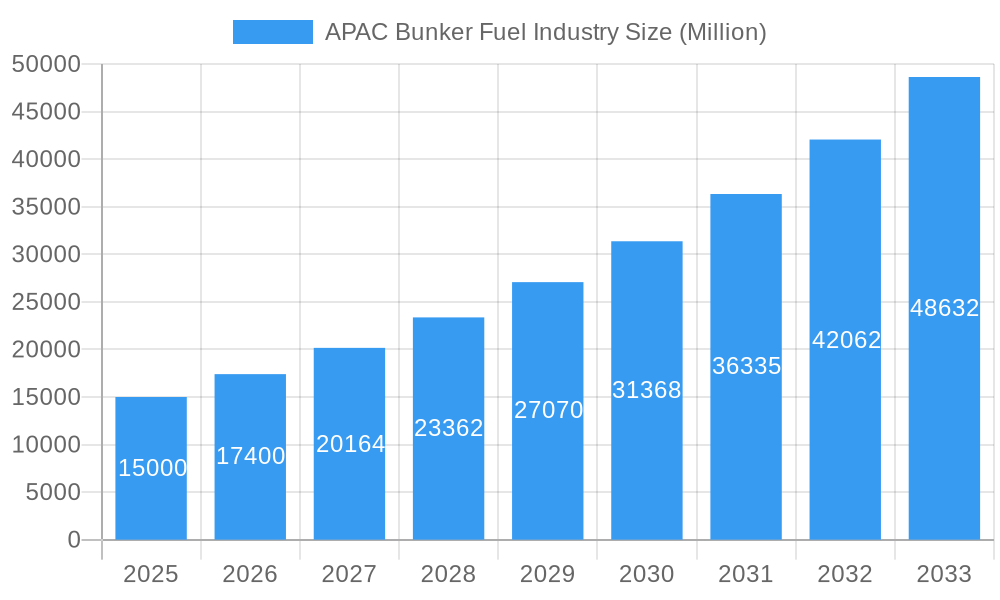
APAC Bunker Fuel Industry Market Size (In Billion)
Market segmentation within the APAC bunker fuel sector highlights a strong preference for VLSFO, primarily driven by global sulfur emission regulations. High Sulfur Fuel Oil (HSFO) continues to hold a share, particularly in applications with less stringent emission controls. Vessel types exhibit a direct correlation with overall market expansion, with container ships and tankers being the primary consumers of bunker fuel. The sustained growth of e-commerce and global trade will further stimulate demand in these segments. While challenges persist, including volatile oil prices and geopolitical uncertainties, the long-term prospects for the APAC bunker fuel market remain positive, supported by fundamental economic growth and increasing maritime trade. Successful navigation of environmental regulations and the adoption of innovative fuel technologies will be crucial for industry participants to maintain competitiveness and leverage the market's growth potential.
APAC Bunker Fuel Industry Company Market Share
APAC Bunker Fuel Industry Market Report: 2019-2033
This comprehensive report provides an in-depth analysis of the Asia-Pacific (APAC) bunker fuel industry, encompassing market dynamics, growth trends, key players, and future outlook. The study covers the period 2019-2033, with a base year of 2025 and a forecast period of 2025-2033. The report segments the market by fuel type (HSFO, VLSFO, MGO, LNG, Others) and vessel type (Containers, Tankers, General Cargo, Bulk Carriers, Others), offering granular insights into this vital maritime sector. Key players analyzed include Total SA, Exxon Mobil Corporation, BP Sinopec Marine Fuels Pte Ltd, China COSCO Holdings Company Limited, Indian Oil Corporation Limited, Royal Dutch Shell PLC, Ocean Network Express PTE Ltd, and Chimbusco Pan Nation Petro-Chemical Co Ltd, though the list is not exhaustive. The report is designed for industry professionals, investors, and strategic decision-makers seeking a detailed understanding of this dynamic market.
APAC Bunker Fuel Industry Market Dynamics & Structure
The APAC bunker fuel market is characterized by moderate concentration, with a few major players holding significant market share. Technological innovation, driven by stricter environmental regulations (e.g., IMO 2020), is reshaping the landscape. The regulatory framework, including sulfur emission limits and carbon intensity reduction targets, significantly influences market dynamics. Competition from alternative fuels like LNG is intensifying, while M&A activity remains relatively consistent.
- Market Concentration: The top 5 players control approximately xx% of the market in 2025.
- Technological Innovation: Investment in cleaner fuel technologies and digitalization of supply chains is substantial, with an estimated xx million USD invested annually.
- Regulatory Framework: IMO 2020 and subsequent regulations are key drivers, impacting fuel demand and pricing.
- Competitive Substitutes: LNG and other alternative fuels pose a growing threat, currently holding xx% market share.
- M&A Activity: An average of xx M&A deals were recorded annually during the historical period (2019-2024), totaling approximately xx million USD in value.
- Innovation Barriers: High initial investment costs for alternative fuel infrastructure and limited availability remain challenges.
APAC Bunker Fuel Industry Growth Trends & Insights
The APAC bunker fuel market witnessed significant growth during the historical period (2019-2024), driven primarily by increasing global trade and shipping activity. The market size is estimated to be xx million units in 2025, with a CAGR of xx% during the forecast period (2025-2033). The adoption rate of cleaner fuels like VLSFO and LNG is accelerating, driven by environmental regulations and cost considerations. Technological advancements in fuel efficiency and emission reduction technologies are further influencing growth. Consumer behavior is shifting towards cleaner and more sustainable bunker fuels, impacting demand for HSFO.
Dominant Regions, Countries, or Segments in APAP Bunker Fuel Industry
The dominant segments within the APAC bunker fuel market are driven by several interconnected factors. China and Singapore stand out as major regional hubs, while VLSFO is the dominant fuel type owing to stringent environmental regulations. The container shipping segment leads in volume, reflecting the region's robust export-oriented economies.
- Leading Region: Northeast Asia (China, Japan, South Korea) accounts for approximately xx% of total market volume.
- Leading Country: China dominates, with a market share of approximately xx% in 2025, fueled by its massive import/export activities.
- Leading Fuel Type: VLSFO is the leading fuel type, with xx million units consumed in 2025, driven by IMO 2020 regulations.
- Leading Vessel Type: Container ships are the dominant vessel type, accounting for xx% of total fuel consumption.
- Key Drivers: Strong economic growth in several APAC nations, expansion of port infrastructure, and rising container shipping volumes.
APAC Bunker Fuel Industry Product Landscape
The APAC bunker fuel market features a range of products tailored to specific vessel types and environmental regulations. Significant innovations focus on reducing sulfur content and improving fuel efficiency. The introduction of biofuels and other alternative fuels presents significant opportunities, promising improvements in environmental performance and cost-effectiveness. Unique selling propositions often center on fuel quality, reliability of supply, and adherence to stringent emission standards.
Key Drivers, Barriers & Challenges in APAC Bunker Fuel Industry
Key drivers include rising global trade, expanding port infrastructure, and increasing demand for efficient and environmentally friendly fuels. However, challenges include volatile crude oil prices, stringent environmental regulations, and potential supply chain disruptions. These factors can significantly impact market growth and profitability. The implementation of carbon pricing mechanisms and the development of alternative fuel infrastructure pose further challenges.
Emerging Opportunities in APAP Bunker Fuel Industry
Significant opportunities exist in the adoption of alternative fuels (LNG, biofuels), advancements in fuel efficiency technologies, and expansion into underserved markets. Innovative business models and strategic partnerships can unlock substantial growth potential.
Growth Accelerators in the APAC Bunker Fuel Industry
Technological advancements in fuel efficiency and emission reduction technologies will play a pivotal role in driving long-term growth. Strategic partnerships to secure supply chains and develop alternative fuel infrastructure will also be vital. Expansion into emerging markets and the adoption of sustainable practices will further accelerate market expansion.
Key Players Shaping the APAC Bunker Fuel Industry Market
- TotalEnergies SE
- ExxonMobil Corporation
- BP
- BP Sinopec Marine Fuels Pte Ltd
- China COSCO Holdings Company Limited
- Indian Oil Corporation Limited
- Royal Dutch Shell PLC
- Ocean Network Express PTE Ltd
- Chimbusco Pan Nation Petro-Chemical Co Ltd
Notable Milestones in APAC Bunker Fuel Industry Sector
- 2020: Implementation of IMO 2020 sulfur cap significantly shifts market dynamics towards VLSFO.
- 2021: Several major players announce significant investments in LNG bunkering infrastructure.
- 2022: Increased focus on biofuels and other alternative fuels as potential solutions for decarbonization.
- xx/xx/xxxx: [Insert notable milestone with date and brief description]
- xx/xx/xxxx: [Insert notable milestone with date and brief description]
In-Depth APAC Bunker Fuel Industry Market Outlook
The future of the APAC bunker fuel market is bright, driven by strong economic growth, rising trade volumes, and the ongoing transition towards cleaner fuels. Strategic investments in alternative fuel infrastructure and technology will be key to unlocking the substantial growth potential of this dynamic market. Companies that successfully adapt to stricter environmental regulations and embrace technological innovation will be best positioned to thrive in the years to come.
APAC Bunker Fuel Industry Segmentation
-
1. Fuel Type
- 1.1. High Sulfur Fuel Oil (HSFO)
- 1.2. Very-Low Sulfur Fuel Oil (VLSFO)
- 1.3. Marine Gas Oil (MGO)
- 1.4. Liquefied Natural Gas (MGO)
- 1.5. Others
-
2. Vessel Type
- 2.1. Containers
- 2.2. Tankers
- 2.3. General Cargo
- 2.4. Bulk Carrier
- 2.5. Others
-
3. Geography
- 3.1. China
- 3.2. India
- 3.3. Singapore
- 3.4. Rest of Asia-Pacific
APAC Bunker Fuel Industry Segmentation By Geography
- 1. China
- 2. India
- 3. Singapore
- 4. Rest of Asia Pacific
APAC Bunker Fuel Industry Regional Market Share
Geographic Coverage of APAC Bunker Fuel Industry
APAC Bunker Fuel Industry REPORT HIGHLIGHTS
| Aspects | Details |
|---|---|
| Study Period | 2020-2034 |
| Base Year | 2025 |
| Estimated Year | 2026 |
| Forecast Period | 2026-2034 |
| Historical Period | 2020-2025 |
| Growth Rate | CAGR of 5.8% from 2020-2034 |
| Segmentation |
|
Table of Contents
- 1. Introduction
- 1.1. Research Scope
- 1.2. Market Segmentation
- 1.3. Research Objective
- 1.4. Definitions and Assumptions
- 2. Executive Summary
- 2.1. Market Snapshot
- 3. Market Dynamics
- 3.1. Market Drivers
- 3.2. Market Restrains
- 3.3. Market Trends
- 3.4. Market Opportunities
- 4. Market Factor Analysis
- 4.1. Porters Five Forces
- 4.1.1. Bargaining Power of Suppliers
- 4.1.2. Bargaining Power of Buyers
- 4.1.3. Threat of New Entrants
- 4.1.4. Threat of Substitutes
- 4.1.5. Competitive Rivalry
- 4.2. PESTEL analysis
- 4.3. BCG Analysis
- 4.3.1. Stars (High Growth, High Market Share)
- 4.3.2. Cash Cows (Low Growth, High Market Share)
- 4.3.3. Question Mark (High Growth, Low Market Share)
- 4.3.4. Dogs (Low Growth, Low Market Share)
- 4.4. Ansoff Matrix Analysis
- 4.5. Supply Chain Analysis
- 4.6. Regulatory Landscape
- 4.7. Current Market Potential and Opportunity Assessment (TAM–SAM–SOM Framework)
- 4.8. NRP Analyst Note
- 4.1. Porters Five Forces
- 5. Market Analysis, Insights and Forecast 2021-2033
- 5.1. Market Analysis, Insights and Forecast - by Fuel Type
- 5.1.1. High Sulfur Fuel Oil (HSFO)
- 5.1.2. Very-Low Sulfur Fuel Oil (VLSFO)
- 5.1.3. Marine Gas Oil (MGO)
- 5.1.4. Liquefied Natural Gas (MGO)
- 5.1.5. Others
- 5.2. Market Analysis, Insights and Forecast - by Vessel Type
- 5.2.1. Containers
- 5.2.2. Tankers
- 5.2.3. General Cargo
- 5.2.4. Bulk Carrier
- 5.2.5. Others
- 5.3. Market Analysis, Insights and Forecast - by Geography
- 5.3.1. China
- 5.3.2. India
- 5.3.3. Singapore
- 5.3.4. Rest of Asia-Pacific
- 5.4. Market Analysis, Insights and Forecast - by Region
- 5.4.1. China
- 5.4.2. India
- 5.4.3. Singapore
- 5.4.4. Rest of Asia Pacific
- 5.1. Market Analysis, Insights and Forecast - by Fuel Type
- 6. Global APAC Bunker Fuel Industry Analysis, Insights and Forecast, 2021-2033
- 6.1. Market Analysis, Insights and Forecast - by Fuel Type
- 6.1.1. High Sulfur Fuel Oil (HSFO)
- 6.1.2. Very-Low Sulfur Fuel Oil (VLSFO)
- 6.1.3. Marine Gas Oil (MGO)
- 6.1.4. Liquefied Natural Gas (MGO)
- 6.1.5. Others
- 6.2. Market Analysis, Insights and Forecast - by Vessel Type
- 6.2.1. Containers
- 6.2.2. Tankers
- 6.2.3. General Cargo
- 6.2.4. Bulk Carrier
- 6.2.5. Others
- 6.3. Market Analysis, Insights and Forecast - by Geography
- 6.3.1. China
- 6.3.2. India
- 6.3.3. Singapore
- 6.3.4. Rest of Asia-Pacific
- 6.1. Market Analysis, Insights and Forecast - by Fuel Type
- 7. China APAC Bunker Fuel Industry Analysis, Insights and Forecast, 2020-2032
- 7.1. Market Analysis, Insights and Forecast - by Fuel Type
- 7.1.1. High Sulfur Fuel Oil (HSFO)
- 7.1.2. Very-Low Sulfur Fuel Oil (VLSFO)
- 7.1.3. Marine Gas Oil (MGO)
- 7.1.4. Liquefied Natural Gas (MGO)
- 7.1.5. Others
- 7.2. Market Analysis, Insights and Forecast - by Vessel Type
- 7.2.1. Containers
- 7.2.2. Tankers
- 7.2.3. General Cargo
- 7.2.4. Bulk Carrier
- 7.2.5. Others
- 7.3. Market Analysis, Insights and Forecast - by Geography
- 7.3.1. China
- 7.3.2. India
- 7.3.3. Singapore
- 7.3.4. Rest of Asia-Pacific
- 7.1. Market Analysis, Insights and Forecast - by Fuel Type
- 8. India APAC Bunker Fuel Industry Analysis, Insights and Forecast, 2020-2032
- 8.1. Market Analysis, Insights and Forecast - by Fuel Type
- 8.1.1. High Sulfur Fuel Oil (HSFO)
- 8.1.2. Very-Low Sulfur Fuel Oil (VLSFO)
- 8.1.3. Marine Gas Oil (MGO)
- 8.1.4. Liquefied Natural Gas (MGO)
- 8.1.5. Others
- 8.2. Market Analysis, Insights and Forecast - by Vessel Type
- 8.2.1. Containers
- 8.2.2. Tankers
- 8.2.3. General Cargo
- 8.2.4. Bulk Carrier
- 8.2.5. Others
- 8.3. Market Analysis, Insights and Forecast - by Geography
- 8.3.1. China
- 8.3.2. India
- 8.3.3. Singapore
- 8.3.4. Rest of Asia-Pacific
- 8.1. Market Analysis, Insights and Forecast - by Fuel Type
- 9. Singapore APAC Bunker Fuel Industry Analysis, Insights and Forecast, 2020-2032
- 9.1. Market Analysis, Insights and Forecast - by Fuel Type
- 9.1.1. High Sulfur Fuel Oil (HSFO)
- 9.1.2. Very-Low Sulfur Fuel Oil (VLSFO)
- 9.1.3. Marine Gas Oil (MGO)
- 9.1.4. Liquefied Natural Gas (MGO)
- 9.1.5. Others
- 9.2. Market Analysis, Insights and Forecast - by Vessel Type
- 9.2.1. Containers
- 9.2.2. Tankers
- 9.2.3. General Cargo
- 9.2.4. Bulk Carrier
- 9.2.5. Others
- 9.3. Market Analysis, Insights and Forecast - by Geography
- 9.3.1. China
- 9.3.2. India
- 9.3.3. Singapore
- 9.3.4. Rest of Asia-Pacific
- 9.1. Market Analysis, Insights and Forecast - by Fuel Type
- 10. Rest of Asia Pacific APAC Bunker Fuel Industry Analysis, Insights and Forecast, 2020-2032
- 10.1. Market Analysis, Insights and Forecast - by Fuel Type
- 10.1.1. High Sulfur Fuel Oil (HSFO)
- 10.1.2. Very-Low Sulfur Fuel Oil (VLSFO)
- 10.1.3. Marine Gas Oil (MGO)
- 10.1.4. Liquefied Natural Gas (MGO)
- 10.1.5. Others
- 10.2. Market Analysis, Insights and Forecast - by Vessel Type
- 10.2.1. Containers
- 10.2.2. Tankers
- 10.2.3. General Cargo
- 10.2.4. Bulk Carrier
- 10.2.5. Others
- 10.3. Market Analysis, Insights and Forecast - by Geography
- 10.3.1. China
- 10.3.2. India
- 10.3.3. Singapore
- 10.3.4. Rest of Asia-Pacific
- 10.1. Market Analysis, Insights and Forecast - by Fuel Type
- 11. Competitive Analysis
- 11.1. Company Profiles
- 11.1.1 Total SA
- 11.1.1.1. Company Overview
- 11.1.1.2. Products
- 11.1.1.3. Company Financials
- 11.1.1.4. SWOT Analysis
- 11.1.2 Exxon Mobil Corporation
- 11.1.2.1. Company Overview
- 11.1.2.2. Products
- 11.1.2.3. Company Financials
- 11.1.2.4. SWOT Analysis
- 11.1.3 BP Sinopec Marine Fuels Pte Ltd *List Not Exhaustive
- 11.1.3.1. Company Overview
- 11.1.3.2. Products
- 11.1.3.3. Company Financials
- 11.1.3.4. SWOT Analysis
- 11.1.4 China COSCO Holdings Company Limited
- 11.1.4.1. Company Overview
- 11.1.4.2. Products
- 11.1.4.3. Company Financials
- 11.1.4.4. SWOT Analysis
- 11.1.5 Indian Oil Corporation Limited
- 11.1.5.1. Company Overview
- 11.1.5.2. Products
- 11.1.5.3. Company Financials
- 11.1.5.4. SWOT Analysis
- 11.1.6 Royal Dutch Shell PLC
- 11.1.6.1. Company Overview
- 11.1.6.2. Products
- 11.1.6.3. Company Financials
- 11.1.6.4. SWOT Analysis
- 11.1.7 Ocean Network Express PTE Ltd
- 11.1.7.1. Company Overview
- 11.1.7.2. Products
- 11.1.7.3. Company Financials
- 11.1.7.4. SWOT Analysis
- 11.1.8 Chimbusco Pan Nation Petro-Chemical Co Ltd
- 11.1.8.1. Company Overview
- 11.1.8.2. Products
- 11.1.8.3. Company Financials
- 11.1.8.4. SWOT Analysis
- 11.1.1 Total SA
- 11.2. Market Entropy
- 11.2.1 Company's Key Areas Served
- 11.2.2 Recent Developments
- 11.3. Company Market Share Analysis 2025
- 11.3.1 Top 5 Companies Market Share Analysis
- 11.3.2 Top 3 Companies Market Share Analysis
- 11.4. List of Potential Customers
- 12. Research Methodology
List of Figures
- Figure 1: Global APAC Bunker Fuel Industry Revenue Breakdown (billion, %) by Region 2025 & 2033
- Figure 2: China APAC Bunker Fuel Industry Revenue (billion), by Fuel Type 2025 & 2033
- Figure 3: China APAC Bunker Fuel Industry Revenue Share (%), by Fuel Type 2025 & 2033
- Figure 4: China APAC Bunker Fuel Industry Revenue (billion), by Vessel Type 2025 & 2033
- Figure 5: China APAC Bunker Fuel Industry Revenue Share (%), by Vessel Type 2025 & 2033
- Figure 6: China APAC Bunker Fuel Industry Revenue (billion), by Geography 2025 & 2033
- Figure 7: China APAC Bunker Fuel Industry Revenue Share (%), by Geography 2025 & 2033
- Figure 8: China APAC Bunker Fuel Industry Revenue (billion), by Country 2025 & 2033
- Figure 9: China APAC Bunker Fuel Industry Revenue Share (%), by Country 2025 & 2033
- Figure 10: India APAC Bunker Fuel Industry Revenue (billion), by Fuel Type 2025 & 2033
- Figure 11: India APAC Bunker Fuel Industry Revenue Share (%), by Fuel Type 2025 & 2033
- Figure 12: India APAC Bunker Fuel Industry Revenue (billion), by Vessel Type 2025 & 2033
- Figure 13: India APAC Bunker Fuel Industry Revenue Share (%), by Vessel Type 2025 & 2033
- Figure 14: India APAC Bunker Fuel Industry Revenue (billion), by Geography 2025 & 2033
- Figure 15: India APAC Bunker Fuel Industry Revenue Share (%), by Geography 2025 & 2033
- Figure 16: India APAC Bunker Fuel Industry Revenue (billion), by Country 2025 & 2033
- Figure 17: India APAC Bunker Fuel Industry Revenue Share (%), by Country 2025 & 2033
- Figure 18: Singapore APAC Bunker Fuel Industry Revenue (billion), by Fuel Type 2025 & 2033
- Figure 19: Singapore APAC Bunker Fuel Industry Revenue Share (%), by Fuel Type 2025 & 2033
- Figure 20: Singapore APAC Bunker Fuel Industry Revenue (billion), by Vessel Type 2025 & 2033
- Figure 21: Singapore APAC Bunker Fuel Industry Revenue Share (%), by Vessel Type 2025 & 2033
- Figure 22: Singapore APAC Bunker Fuel Industry Revenue (billion), by Geography 2025 & 2033
- Figure 23: Singapore APAC Bunker Fuel Industry Revenue Share (%), by Geography 2025 & 2033
- Figure 24: Singapore APAC Bunker Fuel Industry Revenue (billion), by Country 2025 & 2033
- Figure 25: Singapore APAC Bunker Fuel Industry Revenue Share (%), by Country 2025 & 2033
- Figure 26: Rest of Asia Pacific APAC Bunker Fuel Industry Revenue (billion), by Fuel Type 2025 & 2033
- Figure 27: Rest of Asia Pacific APAC Bunker Fuel Industry Revenue Share (%), by Fuel Type 2025 & 2033
- Figure 28: Rest of Asia Pacific APAC Bunker Fuel Industry Revenue (billion), by Vessel Type 2025 & 2033
- Figure 29: Rest of Asia Pacific APAC Bunker Fuel Industry Revenue Share (%), by Vessel Type 2025 & 2033
- Figure 30: Rest of Asia Pacific APAC Bunker Fuel Industry Revenue (billion), by Geography 2025 & 2033
- Figure 31: Rest of Asia Pacific APAC Bunker Fuel Industry Revenue Share (%), by Geography 2025 & 2033
- Figure 32: Rest of Asia Pacific APAC Bunker Fuel Industry Revenue (billion), by Country 2025 & 2033
- Figure 33: Rest of Asia Pacific APAC Bunker Fuel Industry Revenue Share (%), by Country 2025 & 2033
List of Tables
- Table 1: Global APAC Bunker Fuel Industry Revenue billion Forecast, by Fuel Type 2020 & 2033
- Table 2: Global APAC Bunker Fuel Industry Revenue billion Forecast, by Vessel Type 2020 & 2033
- Table 3: Global APAC Bunker Fuel Industry Revenue billion Forecast, by Geography 2020 & 2033
- Table 4: Global APAC Bunker Fuel Industry Revenue billion Forecast, by Region 2020 & 2033
- Table 5: Global APAC Bunker Fuel Industry Revenue billion Forecast, by Fuel Type 2020 & 2033
- Table 6: Global APAC Bunker Fuel Industry Revenue billion Forecast, by Vessel Type 2020 & 2033
- Table 7: Global APAC Bunker Fuel Industry Revenue billion Forecast, by Geography 2020 & 2033
- Table 8: Global APAC Bunker Fuel Industry Revenue billion Forecast, by Country 2020 & 2033
- Table 9: Global APAC Bunker Fuel Industry Revenue billion Forecast, by Fuel Type 2020 & 2033
- Table 10: Global APAC Bunker Fuel Industry Revenue billion Forecast, by Vessel Type 2020 & 2033
- Table 11: Global APAC Bunker Fuel Industry Revenue billion Forecast, by Geography 2020 & 2033
- Table 12: Global APAC Bunker Fuel Industry Revenue billion Forecast, by Country 2020 & 2033
- Table 13: Global APAC Bunker Fuel Industry Revenue billion Forecast, by Fuel Type 2020 & 2033
- Table 14: Global APAC Bunker Fuel Industry Revenue billion Forecast, by Vessel Type 2020 & 2033
- Table 15: Global APAC Bunker Fuel Industry Revenue billion Forecast, by Geography 2020 & 2033
- Table 16: Global APAC Bunker Fuel Industry Revenue billion Forecast, by Country 2020 & 2033
- Table 17: Global APAC Bunker Fuel Industry Revenue billion Forecast, by Fuel Type 2020 & 2033
- Table 18: Global APAC Bunker Fuel Industry Revenue billion Forecast, by Vessel Type 2020 & 2033
- Table 19: Global APAC Bunker Fuel Industry Revenue billion Forecast, by Geography 2020 & 2033
- Table 20: Global APAC Bunker Fuel Industry Revenue billion Forecast, by Country 2020 & 2033
Frequently Asked Questions
1. What is the projected Compound Annual Growth Rate (CAGR) of the APAC Bunker Fuel Industry?
The projected CAGR is approximately 5.8%.
2. Which companies are prominent players in the APAC Bunker Fuel Industry?
Key companies in the market include Total SA, Exxon Mobil Corporation, BP Sinopec Marine Fuels Pte Ltd *List Not Exhaustive, China COSCO Holdings Company Limited, Indian Oil Corporation Limited, Royal Dutch Shell PLC, Ocean Network Express PTE Ltd, Chimbusco Pan Nation Petro-Chemical Co Ltd.
3. What are the main segments of the APAC Bunker Fuel Industry?
The market segments include Fuel Type, Vessel Type, Geography.
4. Can you provide details about the market size?
The market size is estimated to be USD 83.9 billion as of 2022.
5. What are some drivers contributing to market growth?
Increasing Demand for Oil and Gas4.; Presence of Proven Oil and Gas Reserves.
6. What are the notable trends driving market growth?
VLSFO to Witness Significant Growth.
7. Are there any restraints impacting market growth?
Volatile Oil and Gas Prices.
8. Can you provide examples of recent developments in the market?
N/A
9. What pricing options are available for accessing the report?
Pricing options include single-user, multi-user, and enterprise licenses priced at USD 4750, USD 5250, and USD 8750 respectively.
10. Is the market size provided in terms of value or volume?
The market size is provided in terms of value, measured in billion.
11. Are there any specific market keywords associated with the report?
Yes, the market keyword associated with the report is "APAC Bunker Fuel Industry," which aids in identifying and referencing the specific market segment covered.
12. How do I determine which pricing option suits my needs best?
The pricing options vary based on user requirements and access needs. Individual users may opt for single-user licenses, while businesses requiring broader access may choose multi-user or enterprise licenses for cost-effective access to the report.
13. Are there any additional resources or data provided in the APAC Bunker Fuel Industry report?
While the report offers comprehensive insights, it's advisable to review the specific contents or supplementary materials provided to ascertain if additional resources or data are available.
14. How can I stay updated on further developments or reports in the APAC Bunker Fuel Industry?
To stay informed about further developments, trends, and reports in the APAC Bunker Fuel Industry, consider subscribing to industry newsletters, following relevant companies and organizations, or regularly checking reputable industry news sources and publications.
Methodology
Step 1 - Identification of Relevant Samples Size from Population Database


Step 2 - Approaches for Defining Global Market Size (Value, Volume* & Price*)

Note*: In applicable scenarios
Step 3 - Data Sources
Primary Research
- Web Analytics
- Survey Reports
- Research Institute
- Latest Research Reports
- Opinion Leaders
Secondary Research
- Annual Reports
- White Paper
- Latest Press Release
- Industry Association
- Paid Database
- Investor Presentations

Step 4 - Data Triangulation
Involves using different sources of information in order to increase the validity of a study
These sources are likely to be stakeholders in a program - participants, other researchers, program staff, other community members, and so on.
Then we put all data in single framework & apply various statistical tools to find out the dynamic on the market.
During the analysis stage, feedback from the stakeholder groups would be compared to determine areas of agreement as well as areas of divergence