

Key Insights
The Artificial Lift Systems market is poised for significant expansion, projected to reach $7.65 billion by 2025 and grow at a Compound Annual Growth Rate (CAGR) of 5.1% through 2033. This robust growth is propelled by escalating oil and gas exploration and production activities globally. Technological innovations, including the integration of smart sensors and data analytics in Electric Submersible Pumps (ESPs) and Progressive Cavity Pumps (PCPs), are enhancing operational efficiency and optimizing production. The industry's embrace of automation and digitalization further fuels market growth through predictive maintenance and improved decision-making. Key market drivers include the increasing demand for enhanced oil recovery (EOR) techniques and the development of unconventional resources. Challenges such as volatile oil prices, stringent environmental regulations, and high initial investment costs are being navigated through strategic advancements. The market is segmented by system type, with ESPs currently dominating, while PCPs gain traction for challenging well conditions, and rod lift systems remain prevalent in mature fields. Geographically, North America and the Middle East & Africa (MEA) are anticipated to lead market revenue due to extensive oil and gas operations and infrastructure investments.
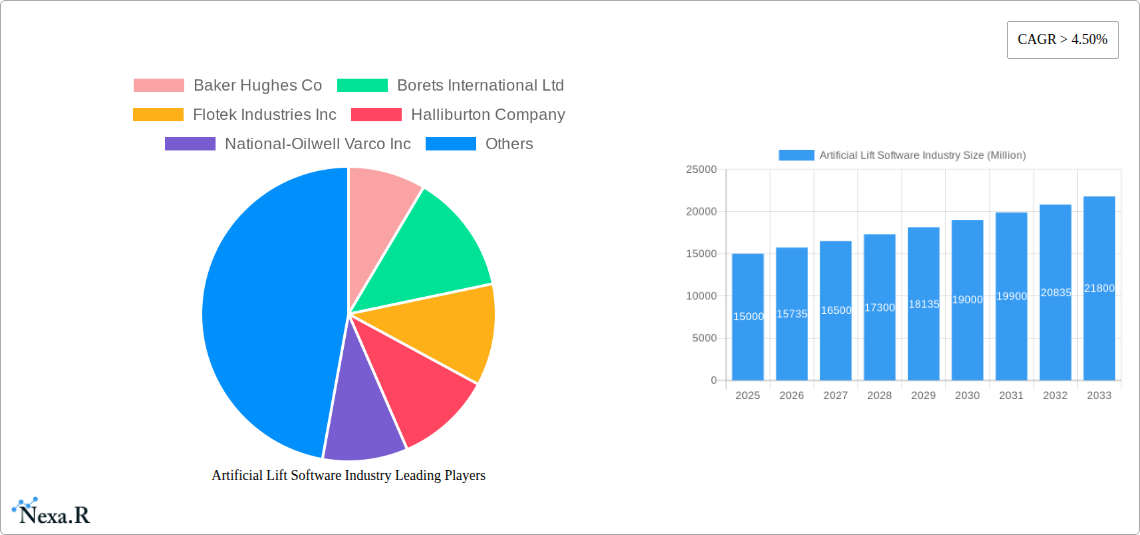
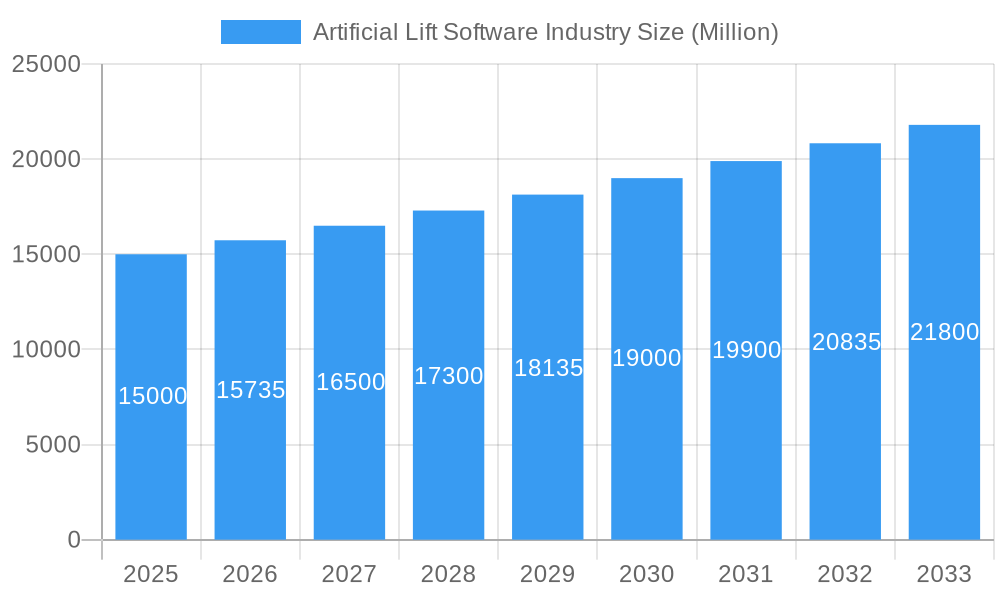
Artificial Lift Software Industry Market Size (In Billion)
The competitive arena features major global players like Baker Hughes, Halliburton, Schlumberger, and Weatherford, alongside specialized regional firms. These companies are actively pursuing strategic alliances, mergers, acquisitions, and continuous technological innovation to strengthen their market standing. The ongoing expansion of unconventional oil and gas production, particularly shale, presents substantial opportunities for artificial lift system providers. A growing emphasis on energy efficiency and reduced carbon emissions will also accelerate the adoption of advanced, environmentally conscious artificial lift technologies. This convergence of growth drivers, market challenges, and technological progress paints a promising future for the Artificial Lift Systems market.
Artificial Lift Software Industry Company Market Share
Artificial Lift Software Market Report: 2019-2033
This comprehensive report provides an in-depth analysis of the Artificial Lift Software market, encompassing market dynamics, growth trends, regional insights, product landscape, key players, and future outlook. The study period spans from 2019 to 2033, with 2025 serving as the base and estimated year. This report is essential for industry professionals, investors, and strategists seeking a clear understanding of this dynamic sector. The report covers the parent market of Oil and Gas industry and its child market, Artificial Lift Software, providing granular insights into various segments like Electric Submersible Pump (ESP) Systems, Progressive Cavity Pump (PCP) Systems, Rod Lift Systems, and Others. The market value is presented in Million USD.
Artificial Lift Software Industry Market Dynamics & Structure
The Artificial Lift Software market is characterized by moderate concentration, with key players like Baker Hughes Co, Borets International Ltd, Flotek Industries Inc, Halliburton Company, National-Oilwell Varco Inc, Alkhorayef Commercial Co, Weatherford International Ltd, Schlumberger Limited, and Dover Corp competing for market share. Technological innovation, driven by the need for enhanced efficiency and reduced operational costs in oil and gas production, is a key driver. Regulatory frameworks, particularly those concerning environmental protection and safety, significantly influence market dynamics. The market also faces competition from alternative artificial lift methods.
- Market Concentration: Moderately concentrated, with top 5 players holding xx% market share in 2024.
- Technological Innovation: Focus on AI, machine learning, and cloud-based solutions for improved well optimization and predictive maintenance.
- Regulatory Landscape: Stringent environmental regulations and safety standards impact technology adoption and operational costs.
- Competitive Substitutes: Alternative artificial lift methods such as gas lift and hydraulic fracturing pose competition.
- M&A Activity: xx M&A deals recorded between 2019 and 2024, primarily focused on technology acquisition and market expansion. The average deal size was xx Million USD.
- Innovation Barriers: High initial investment costs, integration complexities, and data security concerns.
Artificial Lift Software Industry Growth Trends & Insights
The global artificial lift software market is projected to witness significant growth during the forecast period (2025-2033). Driven by increasing demand for efficient oil and gas extraction, technological advancements, and the growing adoption of digitalization in the energy sector, the market is expected to expand at a Compound Annual Growth Rate (CAGR) of xx% from 2025 to 2033, reaching a market size of xx Million USD by 2033. Market penetration is currently at xx%, with considerable room for growth, particularly in developing economies. The shift towards data-driven decision-making and predictive maintenance is further fueling market expansion. Technological disruptions, such as the integration of IoT and AI, are revolutionizing operational efficiencies and predictive capabilities, leading to increased adoption rates. Consumer behavior is shifting towards solutions offering higher ROI, improved safety, and reduced environmental impact.
Dominant Regions, Countries, or Segments in Artificial Lift Software Industry
North America currently dominates the artificial lift software market, holding xx% of the global market share in 2024, followed by Europe and the Middle East. This dominance is primarily driven by factors such as high oil and gas production, advanced technological infrastructure, and significant investments in digitalization within the energy sector. However, the Asia-Pacific region is expected to exhibit the highest growth rate during the forecast period, driven by increasing energy demand and expanding exploration and production activities.
- Electric Submersible Pump (ESP) Systems: Largest segment by revenue, accounting for xx% of the market in 2024, driven by its high efficiency and suitability for various well conditions. Growth is fuelled by advancements in motor and control technologies.
- Progressive Cavity Pump (PCP) Systems: Moderate market share (xx%) with steady growth prospects. This segment benefits from its ability to handle high viscosity fluids.
- Rod Lift Systems: Holds a smaller market share (xx%) but is expected to experience growth due to cost-effectiveness and suitability for shallow wells.
- Other Systems: This segment includes various other technologies like hydraulic pumps, which are expected to have a xx% market share in 2024.
Artificial Lift Software Industry Product Landscape
Artificial lift software solutions are constantly evolving, integrating advanced analytics, machine learning, and cloud computing. These advancements offer enhanced predictive maintenance capabilities, real-time well optimization, and improved decision-making. Unique selling propositions include the ability to integrate with existing infrastructure, seamless data visualization, and customized reporting features. Key performance metrics include reduced operational costs, increased production efficiency, and minimized downtime.
Key Drivers, Barriers & Challenges in Artificial Lift Software Industry
Key Drivers:
- Rising demand for enhanced oil and gas production efficiency.
- Growing adoption of digitalization and automation in the energy sector.
- Technological advancements in artificial intelligence (AI), machine learning (ML), and the Internet of Things (IoT).
- Stringent regulatory requirements for improved safety and environmental protection.
Challenges & Restraints:
- High initial investment costs for software implementation and integration.
- Complexity in data integration from various sources.
- Cybersecurity concerns related to data security and integrity.
- Limited availability of skilled personnel to operate and maintain the software. This shortage impacts market growth by approximately xx% annually.
Emerging Opportunities in Artificial Lift Software Industry
- Expansion into untapped markets, particularly in developing economies with growing energy demands.
- Development of integrated software solutions that incorporate data from various sources for holistic well management.
- Integration of advanced analytics and AI for real-time optimization and predictive maintenance.
- Focus on sustainability and environmental impact reduction through optimized energy consumption and reduced emissions.
Growth Accelerators in the Artificial Lift Software Industry
The artificial lift software market's long-term growth will be driven by the continuous development and adoption of innovative technologies. Strategic partnerships between software providers and oil and gas companies will play a crucial role in accelerating market expansion. The increasing focus on digital transformation within the oil and gas industry will further fuel market growth.
Key Players Shaping the Artificial Lift Software Industry Market
- Baker Hughes Co
- Borets International Ltd
- Flotek Industries Inc
- Halliburton Company
- National-Oilwell Varco Inc
- Alkhorayef Commercial Co
- Weatherford International Ltd
- Schlumberger Limited
- Dover Corp
Notable Milestones in Artificial Lift Software Industry Sector
- February 2022: Upwing launches Magnetic Drive System (MDS), enhancing safety and simplifying deployment.
- August 2021: ChampionX Technologies introduces XSPOC production optimization software, boosting well efficiencies.
- April 2021: Ambyint's applications become available on Microsoft Azure, expanding accessibility for E&P companies.
In-Depth Artificial Lift Software Industry Market Outlook
The artificial lift software market presents significant long-term growth potential. Continued technological advancements, strategic collaborations, and increasing digitalization across the oil and gas sector will drive market expansion. Companies focusing on developing user-friendly, scalable, and secure solutions will be well-positioned to capitalize on emerging opportunities and secure a dominant market position. The market is poised for substantial growth, driven by a combination of technological innovation and the evolving needs of the oil and gas industry.
Artificial Lift Software Industry Segmentation
-
1. Type
- 1.1. Electric Submersible Pump System
- 1.2. Progressive Cavity Pump System
- 1.3. Rod Lift System
- 1.4. Others
Artificial Lift Software Industry Segmentation By Geography
- 1. North America
- 2. Asia Pacific
- 3. Europe
- 4. South America
- 5. Middle East and Africa
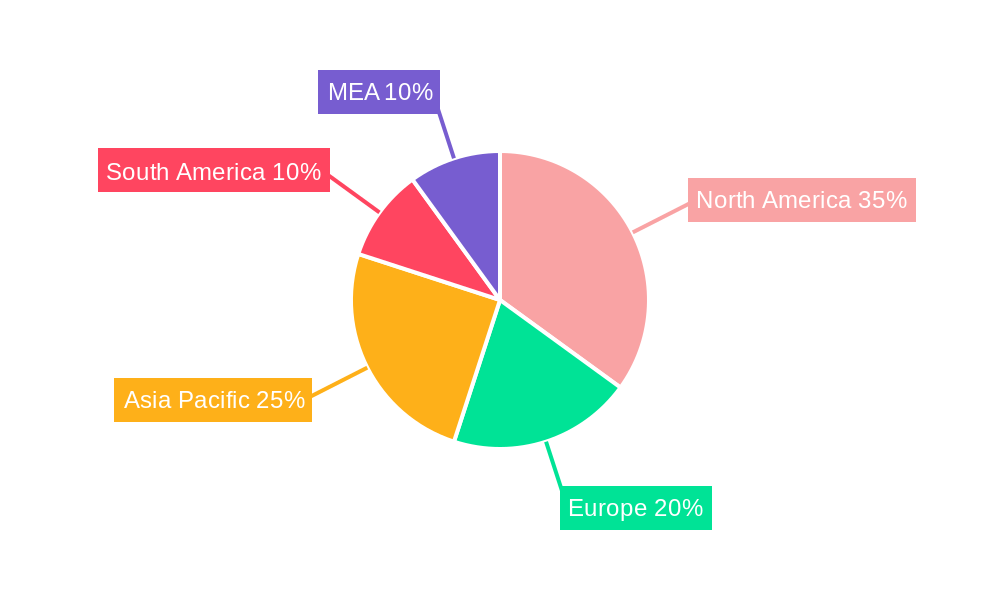
Artificial Lift Software Industry Regional Market Share
Geographic Coverage of Artificial Lift Software Industry
Artificial Lift Software Industry REPORT HIGHLIGHTS
| Aspects | Details |
|---|---|
| Study Period | 2020-2034 |
| Base Year | 2025 |
| Estimated Year | 2026 |
| Forecast Period | 2026-2034 |
| Historical Period | 2020-2025 |
| Growth Rate | CAGR of 5.1% from 2020-2034 |
| Segmentation |
|
Table of Contents
- 1. Introduction
- 1.1. Research Scope
- 1.2. Market Segmentation
- 1.3. Research Methodology
- 1.4. Definitions and Assumptions
- 2. Executive Summary
- 2.1. Introduction
- 3. Market Dynamics
- 3.1. Introduction
- 3.2. Market Drivers
- 3.2.1. 4.; Government Initiatives and Increasing Private Investments
- 3.3. Market Restrains
- 3.3.1. 4.; Declining Lithium-ion Battery Prices
- 3.4. Market Trends
- 3.4.1. Electric Submersible Pump (ESP) System to Dominate the Market
- 4. Market Factor Analysis
- 4.1. Porters Five Forces
- 4.2. Supply/Value Chain
- 4.3. PESTEL analysis
- 4.4. Market Entropy
- 4.5. Patent/Trademark Analysis
- 5. Global Artificial Lift Software Industry Analysis, Insights and Forecast, 2020-2032
- 5.1. Market Analysis, Insights and Forecast - by Type
- 5.1.1. Electric Submersible Pump System
- 5.1.2. Progressive Cavity Pump System
- 5.1.3. Rod Lift System
- 5.1.4. Others
- 5.2. Market Analysis, Insights and Forecast - by Region
- 5.2.1. North America
- 5.2.2. Asia Pacific
- 5.2.3. Europe
- 5.2.4. South America
- 5.2.5. Middle East and Africa
- 5.1. Market Analysis, Insights and Forecast - by Type
- 6. North America Artificial Lift Software Industry Analysis, Insights and Forecast, 2020-2032
- 6.1. Market Analysis, Insights and Forecast - by Type
- 6.1.1. Electric Submersible Pump System
- 6.1.2. Progressive Cavity Pump System
- 6.1.3. Rod Lift System
- 6.1.4. Others
- 6.1. Market Analysis, Insights and Forecast - by Type
- 7. Asia Pacific Artificial Lift Software Industry Analysis, Insights and Forecast, 2020-2032
- 7.1. Market Analysis, Insights and Forecast - by Type
- 7.1.1. Electric Submersible Pump System
- 7.1.2. Progressive Cavity Pump System
- 7.1.3. Rod Lift System
- 7.1.4. Others
- 7.1. Market Analysis, Insights and Forecast - by Type
- 8. Europe Artificial Lift Software Industry Analysis, Insights and Forecast, 2020-2032
- 8.1. Market Analysis, Insights and Forecast - by Type
- 8.1.1. Electric Submersible Pump System
- 8.1.2. Progressive Cavity Pump System
- 8.1.3. Rod Lift System
- 8.1.4. Others
- 8.1. Market Analysis, Insights and Forecast - by Type
- 9. South America Artificial Lift Software Industry Analysis, Insights and Forecast, 2020-2032
- 9.1. Market Analysis, Insights and Forecast - by Type
- 9.1.1. Electric Submersible Pump System
- 9.1.2. Progressive Cavity Pump System
- 9.1.3. Rod Lift System
- 9.1.4. Others
- 9.1. Market Analysis, Insights and Forecast - by Type
- 10. Middle East and Africa Artificial Lift Software Industry Analysis, Insights and Forecast, 2020-2032
- 10.1. Market Analysis, Insights and Forecast - by Type
- 10.1.1. Electric Submersible Pump System
- 10.1.2. Progressive Cavity Pump System
- 10.1.3. Rod Lift System
- 10.1.4. Others
- 10.1. Market Analysis, Insights and Forecast - by Type
- 11. Competitive Analysis
- 11.1. Global Market Share Analysis 2025
- 11.2. Company Profiles
- 11.2.1 Baker Hughes Co
- 11.2.1.1. Overview
- 11.2.1.2. Products
- 11.2.1.3. SWOT Analysis
- 11.2.1.4. Recent Developments
- 11.2.1.5. Financials (Based on Availability)
- 11.2.2 Borets International Ltd
- 11.2.2.1. Overview
- 11.2.2.2. Products
- 11.2.2.3. SWOT Analysis
- 11.2.2.4. Recent Developments
- 11.2.2.5. Financials (Based on Availability)
- 11.2.3 Flotek Industries Inc
- 11.2.3.1. Overview
- 11.2.3.2. Products
- 11.2.3.3. SWOT Analysis
- 11.2.3.4. Recent Developments
- 11.2.3.5. Financials (Based on Availability)
- 11.2.4 Halliburton Company
- 11.2.4.1. Overview
- 11.2.4.2. Products
- 11.2.4.3. SWOT Analysis
- 11.2.4.4. Recent Developments
- 11.2.4.5. Financials (Based on Availability)
- 11.2.5 National-Oilwell Varco Inc
- 11.2.5.1. Overview
- 11.2.5.2. Products
- 11.2.5.3. SWOT Analysis
- 11.2.5.4. Recent Developments
- 11.2.5.5. Financials (Based on Availability)
- 11.2.6 Alkhorayef Commercial Co*List Not Exhaustive
- 11.2.6.1. Overview
- 11.2.6.2. Products
- 11.2.6.3. SWOT Analysis
- 11.2.6.4. Recent Developments
- 11.2.6.5. Financials (Based on Availability)
- 11.2.7 Weatherford International Ltd
- 11.2.7.1. Overview
- 11.2.7.2. Products
- 11.2.7.3. SWOT Analysis
- 11.2.7.4. Recent Developments
- 11.2.7.5. Financials (Based on Availability)
- 11.2.8 Schlumberger Limited
- 11.2.8.1. Overview
- 11.2.8.2. Products
- 11.2.8.3. SWOT Analysis
- 11.2.8.4. Recent Developments
- 11.2.8.5. Financials (Based on Availability)
- 11.2.9 Dover Corp
- 11.2.9.1. Overview
- 11.2.9.2. Products
- 11.2.9.3. SWOT Analysis
- 11.2.9.4. Recent Developments
- 11.2.9.5. Financials (Based on Availability)
- 11.2.1 Baker Hughes Co
List of Figures
- Figure 1: Global Artificial Lift Software Industry Revenue Breakdown (billion, %) by Region 2025 & 2033
- Figure 2: North America Artificial Lift Software Industry Revenue (billion), by Type 2025 & 2033
- Figure 3: North America Artificial Lift Software Industry Revenue Share (%), by Type 2025 & 2033
- Figure 4: North America Artificial Lift Software Industry Revenue (billion), by Country 2025 & 2033
- Figure 5: North America Artificial Lift Software Industry Revenue Share (%), by Country 2025 & 2033
- Figure 6: Asia Pacific Artificial Lift Software Industry Revenue (billion), by Type 2025 & 2033
- Figure 7: Asia Pacific Artificial Lift Software Industry Revenue Share (%), by Type 2025 & 2033
- Figure 8: Asia Pacific Artificial Lift Software Industry Revenue (billion), by Country 2025 & 2033
- Figure 9: Asia Pacific Artificial Lift Software Industry Revenue Share (%), by Country 2025 & 2033
- Figure 10: Europe Artificial Lift Software Industry Revenue (billion), by Type 2025 & 2033
- Figure 11: Europe Artificial Lift Software Industry Revenue Share (%), by Type 2025 & 2033
- Figure 12: Europe Artificial Lift Software Industry Revenue (billion), by Country 2025 & 2033
- Figure 13: Europe Artificial Lift Software Industry Revenue Share (%), by Country 2025 & 2033
- Figure 14: South America Artificial Lift Software Industry Revenue (billion), by Type 2025 & 2033
- Figure 15: South America Artificial Lift Software Industry Revenue Share (%), by Type 2025 & 2033
- Figure 16: South America Artificial Lift Software Industry Revenue (billion), by Country 2025 & 2033
- Figure 17: South America Artificial Lift Software Industry Revenue Share (%), by Country 2025 & 2033
- Figure 18: Middle East and Africa Artificial Lift Software Industry Revenue (billion), by Type 2025 & 2033
- Figure 19: Middle East and Africa Artificial Lift Software Industry Revenue Share (%), by Type 2025 & 2033
- Figure 20: Middle East and Africa Artificial Lift Software Industry Revenue (billion), by Country 2025 & 2033
- Figure 21: Middle East and Africa Artificial Lift Software Industry Revenue Share (%), by Country 2025 & 2033
List of Tables
- Table 1: Global Artificial Lift Software Industry Revenue billion Forecast, by Type 2020 & 2033
- Table 2: Global Artificial Lift Software Industry Revenue billion Forecast, by Region 2020 & 2033
- Table 3: Global Artificial Lift Software Industry Revenue billion Forecast, by Type 2020 & 2033
- Table 4: Global Artificial Lift Software Industry Revenue billion Forecast, by Country 2020 & 2033
- Table 5: Global Artificial Lift Software Industry Revenue billion Forecast, by Type 2020 & 2033
- Table 6: Global Artificial Lift Software Industry Revenue billion Forecast, by Country 2020 & 2033
- Table 7: Global Artificial Lift Software Industry Revenue billion Forecast, by Type 2020 & 2033
- Table 8: Global Artificial Lift Software Industry Revenue billion Forecast, by Country 2020 & 2033
- Table 9: Global Artificial Lift Software Industry Revenue billion Forecast, by Type 2020 & 2033
- Table 10: Global Artificial Lift Software Industry Revenue billion Forecast, by Country 2020 & 2033
- Table 11: Global Artificial Lift Software Industry Revenue billion Forecast, by Type 2020 & 2033
- Table 12: Global Artificial Lift Software Industry Revenue billion Forecast, by Country 2020 & 2033
Frequently Asked Questions
1. What is the projected Compound Annual Growth Rate (CAGR) of the Artificial Lift Software Industry?
The projected CAGR is approximately 5.1%.
2. Which companies are prominent players in the Artificial Lift Software Industry?
Key companies in the market include Baker Hughes Co, Borets International Ltd, Flotek Industries Inc, Halliburton Company, National-Oilwell Varco Inc, Alkhorayef Commercial Co*List Not Exhaustive, Weatherford International Ltd, Schlumberger Limited, Dover Corp.
3. What are the main segments of the Artificial Lift Software Industry?
The market segments include Type.
4. Can you provide details about the market size?
The market size is estimated to be USD 7.65 billion as of 2022.
5. What are some drivers contributing to market growth?
4.; Government Initiatives and Increasing Private Investments.
6. What are the notable trends driving market growth?
Electric Submersible Pump (ESP) System to Dominate the Market.
7. Are there any restraints impacting market growth?
4.; Declining Lithium-ion Battery Prices.
8. Can you provide examples of recent developments in the market?
In February 2022, the Upwing Magnetic Drive System (MDS) hermetically isolates all the failure-prone electrical components from the harsh production fluids by placing them in the well's annulus as part of the permanent completion. It also simplifies deployment and intervention using a slickline for the system's mechanical string.
9. What pricing options are available for accessing the report?
Pricing options include single-user, multi-user, and enterprise licenses priced at USD 4750, USD 5250, and USD 8750 respectively.
10. Is the market size provided in terms of value or volume?
The market size is provided in terms of value, measured in billion.
11. Are there any specific market keywords associated with the report?
Yes, the market keyword associated with the report is "Artificial Lift Software Industry," which aids in identifying and referencing the specific market segment covered.
12. How do I determine which pricing option suits my needs best?
The pricing options vary based on user requirements and access needs. Individual users may opt for single-user licenses, while businesses requiring broader access may choose multi-user or enterprise licenses for cost-effective access to the report.
13. Are there any additional resources or data provided in the Artificial Lift Software Industry report?
While the report offers comprehensive insights, it's advisable to review the specific contents or supplementary materials provided to ascertain if additional resources or data are available.
14. How can I stay updated on further developments or reports in the Artificial Lift Software Industry?
To stay informed about further developments, trends, and reports in the Artificial Lift Software Industry, consider subscribing to industry newsletters, following relevant companies and organizations, or regularly checking reputable industry news sources and publications.
Methodology
Step 1 - Identification of Relevant Samples Size from Population Database


Step 2 - Approaches for Defining Global Market Size (Value, Volume* & Price*)

Note*: In applicable scenarios
Step 3 - Data Sources
Primary Research
- Web Analytics
- Survey Reports
- Research Institute
- Latest Research Reports
- Opinion Leaders
Secondary Research
- Annual Reports
- White Paper
- Latest Press Release
- Industry Association
- Paid Database
- Investor Presentations

Step 4 - Data Triangulation
Involves using different sources of information in order to increase the validity of a study
These sources are likely to be stakeholders in a program - participants, other researchers, program staff, other community members, and so on.
Then we put all data in single framework & apply various statistical tools to find out the dynamic on the market.
During the analysis stage, feedback from the stakeholder groups would be compared to determine areas of agreement as well as areas of divergence