

Key Insights
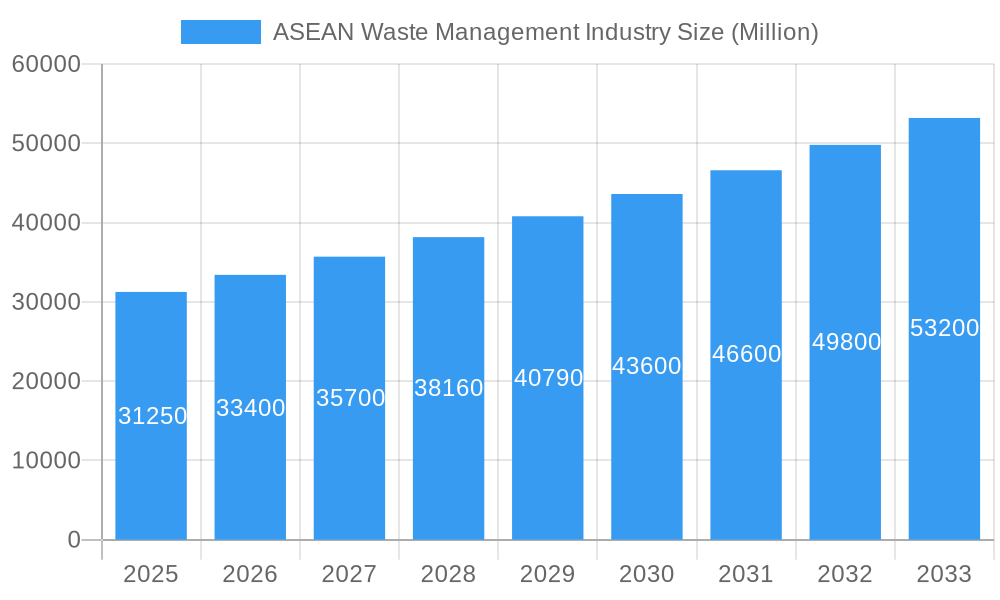
The ASEAN waste management industry, valued at $31.25 billion in 2025, is experiencing robust growth, projected to expand at a Compound Annual Growth Rate (CAGR) of 6.74% from 2025 to 2033. This significant expansion is fueled by several key drivers. Rapid urbanization across the ASEAN region is leading to increased waste generation, necessitating more sophisticated and efficient waste management solutions. Growing environmental awareness among governments and citizens is driving demand for sustainable waste disposal practices, including recycling and waste-to-energy initiatives. Furthermore, stringent government regulations aimed at reducing landfill reliance and promoting circular economy principles are creating a favorable environment for industry growth. Key players such as Sembcorp Environmental Management, Veolia, and Remondis are actively investing in expanding their operations and technological capabilities to capitalize on this burgeoning market. The industry is segmented by waste type (municipal solid waste, industrial waste, hazardous waste), treatment method (landfill, incineration, recycling, composting), and service type (collection, processing, disposal). While data on specific segment shares is unavailable, it's likely that municipal solid waste management currently dominates, given the high population density and urbanization levels in the region. Future growth will likely be driven by increased investment in recycling infrastructure and waste-to-energy projects, addressing the limitations of current landfill-centric approaches.
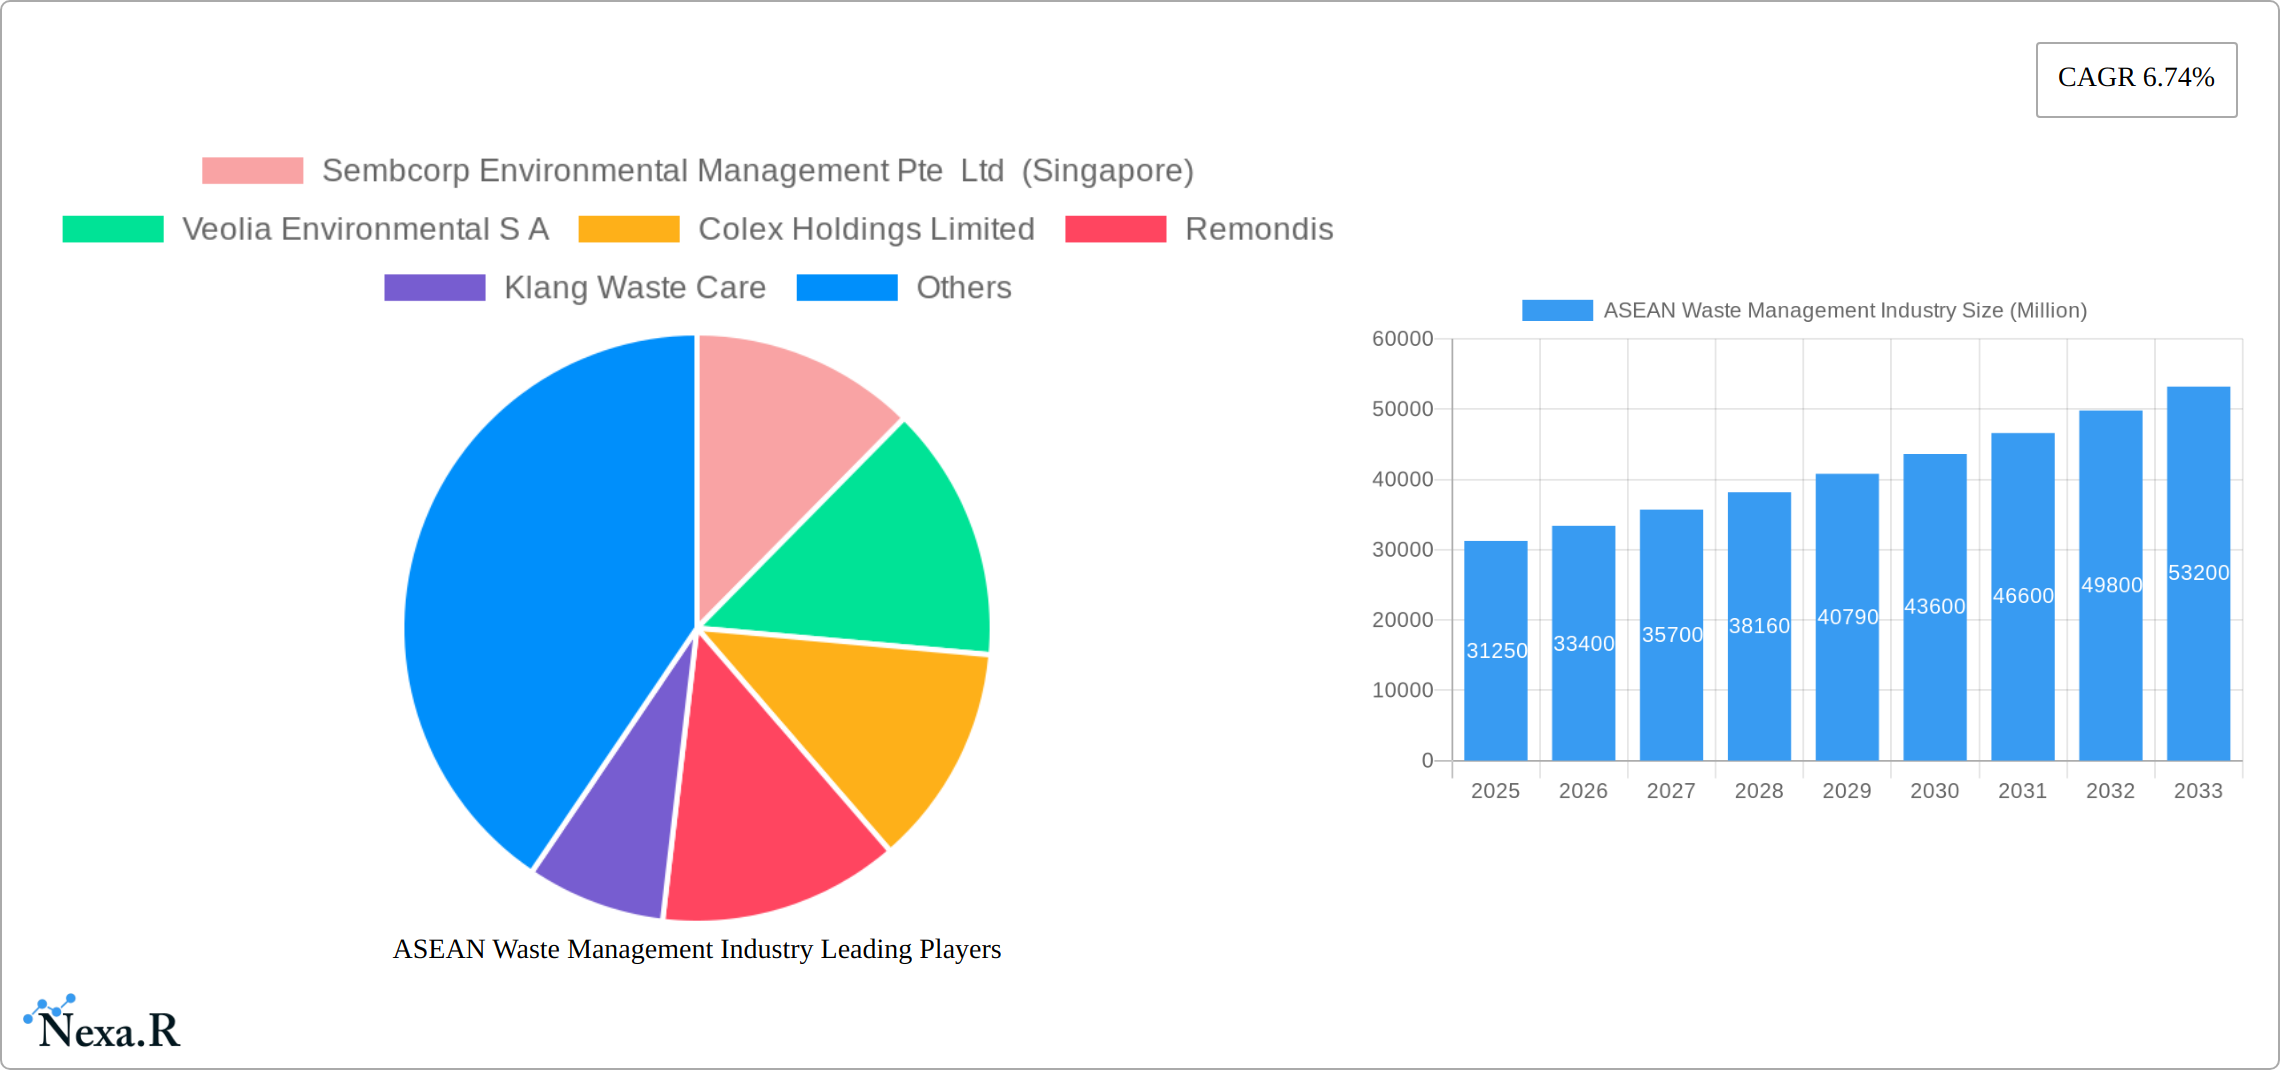
ASEAN Waste Management Industry Market Size (In Billion)
Challenges remain, however. Insufficient infrastructure in certain regions hinders efficient waste collection and processing. Lack of awareness and inconsistent waste segregation practices among the population continue to impede recycling efforts. Furthermore, securing sufficient funding for large-scale infrastructure projects and technological upgrades presents an ongoing hurdle. Despite these constraints, the long-term outlook for the ASEAN waste management industry remains positive, driven by sustained economic growth, increasing environmental consciousness, and supportive government policies. Strategic partnerships between public and private sectors will be crucial in overcoming existing infrastructural and operational bottlenecks, facilitating the transition towards a more sustainable and efficient waste management system.
ASEAN Waste Management Industry Company Market Share
ASEAN Waste Management Industry: 2019-2033 Market Report
This comprehensive report provides an in-depth analysis of the ASEAN waste management industry, encompassing market dynamics, growth trends, key players, and future opportunities. The study period covers 2019-2033, with a base year of 2025 and a forecast period of 2025-2033. This report is essential for investors, industry professionals, and policymakers seeking to understand and capitalize on the burgeoning waste management sector in Southeast Asia. The report analyzes parent markets (waste management) and child markets (e.g., recycling, waste-to-energy).
Keywords: ASEAN waste management, waste recycling, waste-to-energy, Southeast Asia waste management market, environmental services ASEAN, waste management solutions ASEAN, circular economy ASEAN, sustainable waste management, waste management regulations ASEAN, market size ASEAN waste management, waste management industry growth, waste management companies ASEAN.
ASEAN Waste Management Industry Market Dynamics & Structure
The ASEAN waste management market is experiencing dynamic evolution, characterized by a diverse ecosystem of large multinational corporations and agile local enterprises. While the market remains moderately concentrated, with key players dominating specific waste streams such as industrial waste, technological innovation is rapidly reshaping the landscape. Driven by escalating environmental consciousness and increasingly stringent regulatory mandates, advancements in waste sorting, advanced recycling techniques, and efficient waste-to-energy solutions are at the forefront of this transformation. Navigating varying regulatory frameworks across ASEAN nations presents both strategic opportunities and challenges for market participants, influencing investment decisions and the pace of technological adoption. The burgeoning embrace of circular economy principles is unlocking novel business models and competitive avenues, simultaneously intensifying the drive for operational excellence. Although merger and acquisition (M&A) activity has historically been subdued, a projected uptick is anticipated as established entities pursue market expansion and broader geographical footprints.
- Market Concentration: Moderate, with an estimated XX% market share held by the top 5 players in 2025. This indicates a balanced competitive environment with room for emerging players.
- Technological Innovation: Fueled by breakthroughs in automated waste sorting, advanced material recovery, and efficient waste-to-energy conversion. Key barriers include substantial initial capital outlays and a developing skilled labor pool.
- Regulatory Frameworks: Significant divergence exists across ASEAN countries, creating a complex but opportunity-rich environment. Stricter environmental legislation is a powerful catalyst for adopting cleaner and more sustainable waste management technologies.
- Competitive Substitutes: While direct substitutes are limited, traditional waste disposal methods, particularly landfilling, continue to pose a significant competitive challenge, especially in regions with less developed infrastructure.
- End-User Demographics: Rapid urbanization and increasing per capita consumption are fundamentally driving waste generation volumes, necessitating continuous innovation and expansion of waste management services.
- M&A Trends: A trend towards increased M&A activity is anticipated over the forecast period, following a moderate level of transactions in recent years. The total deal value in 2024 reached an estimated XX Million, signaling growing consolidation efforts.
ASEAN Waste Management Industry Growth Trends & Insights
The ASEAN waste management market is experiencing robust growth, driven by factors such as increasing urbanization, rising per capita income, and stricter environmental regulations. The market size, valued at xx Million in 2024, is projected to reach xx Million by 2033, exhibiting a Compound Annual Growth Rate (CAGR) of xx% during the forecast period. Adoption rates for advanced waste management technologies are increasing gradually, albeit unevenly across different countries and segments. Technological disruptions, particularly in areas like AI-powered waste sorting and advanced recycling processes, are shaping market dynamics. Consumer behavior is shifting towards greater environmental consciousness, increasing demand for sustainable waste management practices.
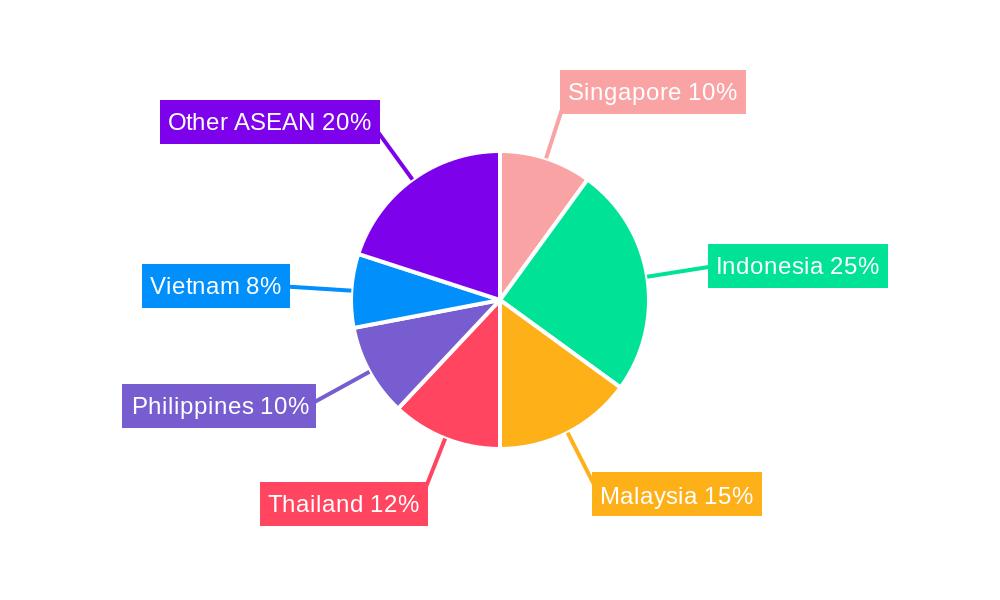
Dominant Regions, Countries, or Segments in ASEAN Waste Management Industry
Singapore, Indonesia, Malaysia, and Thailand stand out as the vanguard markets within the ASEAN waste management sector. This leadership is attributed to their substantial populations, robust economic activity, and comparatively advanced waste management infrastructure. Singapore, with its cutting-edge recycling technologies and rigorous environmental standards, commands a significant presence in specialized waste management segments. Indonesia, owing to its immense demographic scale and expanding industrial base, presents a substantial demand for comprehensive industrial waste management solutions. Malaysia's strategic emphasis on resource recovery is actively stimulating investments in advanced recycling and waste-to-energy projects. In Thailand, the vibrant tourism sector contributes significantly to waste generation, creating a dynamic market for waste collection and processing services.
- Key Drivers:
- Sustained Economic Growth: A primary engine for increased waste generation and a corresponding rise in investments towards modern waste management infrastructure.
- Proactive Government Policies and Regulations: Increasingly stringent environmental mandates are a critical impetus for the adoption of more sustainable and efficient waste management practices.
- Heightened Environmental Awareness: A growing public consciousness regarding pollution and resource depletion is directly translating into a higher demand for superior waste management solutions.
- Technological Advancements: Innovations in waste sorting, recycling, and waste-to-energy technologies are progressively enhancing the efficiency and economic viability of waste management operations.
- Dominance Factors: Market size and scale, the prevailing level of economic development, the stringency and enforcement of environmental regulations, and the accessibility and adoption of advanced waste management technologies are the pivotal determinants of regional dominance.
ASEAN Waste Management Industry Product Landscape
The ASEAN waste management market offers a diverse range of products and services, including waste collection, transportation, processing, recycling, and disposal solutions. Technological advancements are evident in automated waste sorting systems, advanced recycling technologies (e.g., chemical recycling of plastics), and innovative waste-to-energy plants. These products are tailored to meet specific needs, with unique selling propositions focusing on efficiency, sustainability, and cost-effectiveness. The trend is towards integrated solutions that incorporate multiple stages of waste management, optimizing resource recovery and minimizing environmental impact.
Key Drivers, Barriers & Challenges in ASEAN Waste Management Industry
Key Drivers: The ASEAN waste management industry is propelled by a confluence of factors including rapid urbanization, escalating disposable incomes, progressively stringent environmental regulations, a heightened public awareness concerning waste-related issues, and proactive government initiatives championing the circular economy. Furthermore, technological advancements, such as the integration of AI in waste sorting and the continuous improvement of recycling methodologies, are significantly contributing to market expansion and efficiency gains.
Challenges: A significant impediment to market growth is the constrained availability of funding and investment in essential infrastructure, particularly in the less developed economies within ASEAN. The scarcity of a skilled workforce and specialized technical expertise presents a considerable hurdle for the successful deployment and operation of sophisticated waste management technologies. Inconsistent and fragmented regulatory frameworks across different ASEAN nations, coupled with a lack of standardized waste management practices, introduce complexities for businesses operating in the region. The presence and influence of the informal waste sector also pose challenges, complicating management efforts and hindering the transition towards more formalized, efficient, and sustainable waste management systems.
Emerging Opportunities in ASEAN Waste Management Industry
Significant growth potential lies within the largely untapped markets of rural areas and smaller urban centers across the ASEAN region. The escalating demand for sustainable packaging solutions and effective plastic waste recycling mechanisms is paving the way for innovative business models and technologies. The development and widespread adoption of advanced recycling techniques, such as chemical recycling, are poised to play a pivotal role in addressing the persistent issue of plastic waste accumulation. Moreover, evolving consumer preferences that increasingly favor eco-friendly products are creating a burgeoning market for environmentally conscious waste management services and solutions.
Growth Accelerators in the ASEAN Waste Management Industry
The acceleration of growth in the ASEAN waste management industry is intrinsically linked to technological advancements, particularly in AI-driven waste sorting and sophisticated recycling processes, which promise to elevate efficiency and resource recovery rates significantly. The forging of strategic partnerships between private sector entities and governmental bodies is paramount for the successful development of sustainable waste management infrastructure and the effective implementation of supportive policies. The expansion and optimization of waste-to-energy projects are also critical growth catalysts, offering a dual benefit of reducing landfill reliance and generating valuable renewable energy resources.
Key Players Shaping the ASEAN Waste Management Industry Market
- Sembcorp Environmental Management Pte Ltd (Singapore)
- Veolia Environmental S A
- Colex Holdings Limited
- Remondis
- Klang Waste Care
- Starpal Pte Ltd
- Blue Planet Environmental Solutions
- Greenway Environmental
- PT Prasadha Pamunah Limbah Industri - PPLI
- Boon Poh Refuse Disposal Pte Ltd
- Suez Environment
- Earth Recycling Services Ltd
- ALBA Group Asia
- Se Cure Waste Management
(List Not Exhaustive)
Notable Milestones in ASEAN Waste Management Industry Sector
- December 2022: Rebottle, a cooperative venture between Singapore Polytechnic (SP) and SembWaste, aims to significantly boost PET bottle recycling in Singapore.
- June 2022: PT Prasadha Pamunah Waste Industries (PPLI) establishes a representative office in the Wijayakusuma Industrial Area, Indonesia, signifying expansion in a key ASEAN market.
In-Depth ASEAN Waste Management Industry Market Outlook
The ASEAN waste management market is poised for continued strong growth, driven by technological innovation, supportive government policies, and increasing environmental awareness. Strategic partnerships and investments in infrastructure will be key to unlocking the sector's full potential, promoting a transition towards a more sustainable and circular economy in the region. The focus on reducing landfill reliance, increasing resource recovery, and the adoption of cleaner technologies will shape the future landscape of the industry.
ASEAN Waste Management Industry Segmentation
-
1. Waste type
- 1.1. Industrial waste
- 1.2. Municipal solid waste
- 1.3. E-waste
- 1.4. Other Waste types
-
2. Disposal methods
- 2.1. Collection
- 2.2. Landfill
- 2.3. Others
-
3. Geography
- 3.1. Indonesia
- 3.2. Thailand
- 3.3. Malaysia
- 3.4. Singapore
- 3.5. Rest of ASEAN
ASEAN Waste Management Industry Segmentation By Geography
- 1. Indonesia
- 2. Thailand
- 3. Malaysia
- 4. Singapore
- 5. Rest of ASEAN
ASEAN Waste Management Industry Regional Market Share
Geographic Coverage of ASEAN Waste Management Industry
ASEAN Waste Management Industry REPORT HIGHLIGHTS
| Aspects | Details |
|---|---|
| Study Period | 2020-2034 |
| Base Year | 2025 |
| Estimated Year | 2026 |
| Forecast Period | 2026-2034 |
| Historical Period | 2020-2025 |
| Growth Rate | CAGR of 6.74% from 2020-2034 |
| Segmentation |
|
Table of Contents
- 1. Introduction
- 1.1. Research Scope
- 1.2. Market Segmentation
- 1.3. Research Objective
- 1.4. Definitions and Assumptions
- 2. Executive Summary
- 2.1. Market Snapshot
- 3. Market Dynamics
- 3.1. Market Drivers
- 3.2. Market Restrains
- 3.3. Market Trends
- 3.4. Market Opportunities
- 4. Market Factor Analysis
- 4.1. Porters Five Forces
- 4.1.1. Bargaining Power of Suppliers
- 4.1.2. Bargaining Power of Buyers
- 4.1.3. Threat of New Entrants
- 4.1.4. Threat of Substitutes
- 4.1.5. Competitive Rivalry
- 4.2. PESTEL analysis
- 4.3. BCG Analysis
- 4.3.1. Stars (High Growth, High Market Share)
- 4.3.2. Cash Cows (Low Growth, High Market Share)
- 4.3.3. Question Mark (High Growth, Low Market Share)
- 4.3.4. Dogs (Low Growth, Low Market Share)
- 4.4. Ansoff Matrix Analysis
- 4.5. Supply Chain Analysis
- 4.6. Regulatory Landscape
- 4.7. Current Market Potential and Opportunity Assessment (TAM–SAM–SOM Framework)
- 4.8. NRP Analyst Note
- 4.1. Porters Five Forces
- 5. Market Analysis, Insights and Forecast 2021-2033
- 5.1. Market Analysis, Insights and Forecast - by Waste type
- 5.1.1. Industrial waste
- 5.1.2. Municipal solid waste
- 5.1.3. E-waste
- 5.1.4. Other Waste types
- 5.2. Market Analysis, Insights and Forecast - by Disposal methods
- 5.2.1. Collection
- 5.2.2. Landfill
- 5.2.3. Others
- 5.3. Market Analysis, Insights and Forecast - by Geography
- 5.3.1. Indonesia
- 5.3.2. Thailand
- 5.3.3. Malaysia
- 5.3.4. Singapore
- 5.3.5. Rest of ASEAN
- 5.4. Market Analysis, Insights and Forecast - by Region
- 5.4.1. Indonesia
- 5.4.2. Thailand
- 5.4.3. Malaysia
- 5.4.4. Singapore
- 5.4.5. Rest of ASEAN
- 5.1. Market Analysis, Insights and Forecast - by Waste type
- 6. Global ASEAN Waste Management Industry Analysis, Insights and Forecast, 2021-2033
- 6.1. Market Analysis, Insights and Forecast - by Waste type
- 6.1.1. Industrial waste
- 6.1.2. Municipal solid waste
- 6.1.3. E-waste
- 6.1.4. Other Waste types
- 6.2. Market Analysis, Insights and Forecast - by Disposal methods
- 6.2.1. Collection
- 6.2.2. Landfill
- 6.2.3. Others
- 6.3. Market Analysis, Insights and Forecast - by Geography
- 6.3.1. Indonesia
- 6.3.2. Thailand
- 6.3.3. Malaysia
- 6.3.4. Singapore
- 6.3.5. Rest of ASEAN
- 6.1. Market Analysis, Insights and Forecast - by Waste type
- 7. Indonesia ASEAN Waste Management Industry Analysis, Insights and Forecast, 2020-2032
- 7.1. Market Analysis, Insights and Forecast - by Waste type
- 7.1.1. Industrial waste
- 7.1.2. Municipal solid waste
- 7.1.3. E-waste
- 7.1.4. Other Waste types
- 7.2. Market Analysis, Insights and Forecast - by Disposal methods
- 7.2.1. Collection
- 7.2.2. Landfill
- 7.2.3. Others
- 7.3. Market Analysis, Insights and Forecast - by Geography
- 7.3.1. Indonesia
- 7.3.2. Thailand
- 7.3.3. Malaysia
- 7.3.4. Singapore
- 7.3.5. Rest of ASEAN
- 7.1. Market Analysis, Insights and Forecast - by Waste type
- 8. Thailand ASEAN Waste Management Industry Analysis, Insights and Forecast, 2020-2032
- 8.1. Market Analysis, Insights and Forecast - by Waste type
- 8.1.1. Industrial waste
- 8.1.2. Municipal solid waste
- 8.1.3. E-waste
- 8.1.4. Other Waste types
- 8.2. Market Analysis, Insights and Forecast - by Disposal methods
- 8.2.1. Collection
- 8.2.2. Landfill
- 8.2.3. Others
- 8.3. Market Analysis, Insights and Forecast - by Geography
- 8.3.1. Indonesia
- 8.3.2. Thailand
- 8.3.3. Malaysia
- 8.3.4. Singapore
- 8.3.5. Rest of ASEAN
- 8.1. Market Analysis, Insights and Forecast - by Waste type
- 9. Malaysia ASEAN Waste Management Industry Analysis, Insights and Forecast, 2020-2032
- 9.1. Market Analysis, Insights and Forecast - by Waste type
- 9.1.1. Industrial waste
- 9.1.2. Municipal solid waste
- 9.1.3. E-waste
- 9.1.4. Other Waste types
- 9.2. Market Analysis, Insights and Forecast - by Disposal methods
- 9.2.1. Collection
- 9.2.2. Landfill
- 9.2.3. Others
- 9.3. Market Analysis, Insights and Forecast - by Geography
- 9.3.1. Indonesia
- 9.3.2. Thailand
- 9.3.3. Malaysia
- 9.3.4. Singapore
- 9.3.5. Rest of ASEAN
- 9.1. Market Analysis, Insights and Forecast - by Waste type
- 10. Singapore ASEAN Waste Management Industry Analysis, Insights and Forecast, 2020-2032
- 10.1. Market Analysis, Insights and Forecast - by Waste type
- 10.1.1. Industrial waste
- 10.1.2. Municipal solid waste
- 10.1.3. E-waste
- 10.1.4. Other Waste types
- 10.2. Market Analysis, Insights and Forecast - by Disposal methods
- 10.2.1. Collection
- 10.2.2. Landfill
- 10.2.3. Others
- 10.3. Market Analysis, Insights and Forecast - by Geography
- 10.3.1. Indonesia
- 10.3.2. Thailand
- 10.3.3. Malaysia
- 10.3.4. Singapore
- 10.3.5. Rest of ASEAN
- 10.1. Market Analysis, Insights and Forecast - by Waste type
- 11. Rest of ASEAN ASEAN Waste Management Industry Analysis, Insights and Forecast, 2020-2032
- 11.1. Market Analysis, Insights and Forecast - by Waste type
- 11.1.1. Industrial waste
- 11.1.2. Municipal solid waste
- 11.1.3. E-waste
- 11.1.4. Other Waste types
- 11.2. Market Analysis, Insights and Forecast - by Disposal methods
- 11.2.1. Collection
- 11.2.2. Landfill
- 11.2.3. Others
- 11.3. Market Analysis, Insights and Forecast - by Geography
- 11.3.1. Indonesia
- 11.3.2. Thailand
- 11.3.3. Malaysia
- 11.3.4. Singapore
- 11.3.5. Rest of ASEAN
- 11.1. Market Analysis, Insights and Forecast - by Waste type
- 12. Competitive Analysis
- 12.1. Company Profiles
- 12.1.1 Sembcorp Environmental Management Pte Ltd (Singapore)
- 12.1.1.1. Company Overview
- 12.1.1.2. Products
- 12.1.1.3. Company Financials
- 12.1.1.4. SWOT Analysis
- 12.1.2 Veolia Environmental S A
- 12.1.2.1. Company Overview
- 12.1.2.2. Products
- 12.1.2.3. Company Financials
- 12.1.2.4. SWOT Analysis
- 12.1.3 Colex Holdings Limited
- 12.1.3.1. Company Overview
- 12.1.3.2. Products
- 12.1.3.3. Company Financials
- 12.1.3.4. SWOT Analysis
- 12.1.4 Remondis
- 12.1.4.1. Company Overview
- 12.1.4.2. Products
- 12.1.4.3. Company Financials
- 12.1.4.4. SWOT Analysis
- 12.1.5 Klang Waste Care
- 12.1.5.1. Company Overview
- 12.1.5.2. Products
- 12.1.5.3. Company Financials
- 12.1.5.4. SWOT Analysis
- 12.1.6 Starpal Pte Ltd
- 12.1.6.1. Company Overview
- 12.1.6.2. Products
- 12.1.6.3. Company Financials
- 12.1.6.4. SWOT Analysis
- 12.1.7 Blue Planet Environmental Solutions
- 12.1.7.1. Company Overview
- 12.1.7.2. Products
- 12.1.7.3. Company Financials
- 12.1.7.4. SWOT Analysis
- 12.1.8 Greenway Environmental
- 12.1.8.1. Company Overview
- 12.1.8.2. Products
- 12.1.8.3. Company Financials
- 12.1.8.4. SWOT Analysis
- 12.1.9 PT Prasadha Pamunah Limbah Industri - PPLI
- 12.1.9.1. Company Overview
- 12.1.9.2. Products
- 12.1.9.3. Company Financials
- 12.1.9.4. SWOT Analysis
- 12.1.10 Boon Poh Refuse Disposal Pte Ltd
- 12.1.10.1. Company Overview
- 12.1.10.2. Products
- 12.1.10.3. Company Financials
- 12.1.10.4. SWOT Analysis
- 12.1.11 Suez Environment
- 12.1.11.1. Company Overview
- 12.1.11.2. Products
- 12.1.11.3. Company Financials
- 12.1.11.4. SWOT Analysis
- 12.1.12 Earth Recycling Services Ltd
- 12.1.12.1. Company Overview
- 12.1.12.2. Products
- 12.1.12.3. Company Financials
- 12.1.12.4. SWOT Analysis
- 12.1.13 ALBA Group Asia
- 12.1.13.1. Company Overview
- 12.1.13.2. Products
- 12.1.13.3. Company Financials
- 12.1.13.4. SWOT Analysis
- 12.1.14 Se Cure Waste Management**List Not Exhaustive
- 12.1.14.1. Company Overview
- 12.1.14.2. Products
- 12.1.14.3. Company Financials
- 12.1.14.4. SWOT Analysis
- 12.1.1 Sembcorp Environmental Management Pte Ltd (Singapore)
- 12.2. Market Entropy
- 12.2.1 Company's Key Areas Served
- 12.2.2 Recent Developments
- 12.3. Company Market Share Analysis 2025
- 12.3.1 Top 5 Companies Market Share Analysis
- 12.3.2 Top 3 Companies Market Share Analysis
- 12.4. List of Potential Customers
- 13. Research Methodology
List of Figures
- Figure 1: Global ASEAN Waste Management Industry Revenue Breakdown (Million, %) by Region 2025 & 2033
- Figure 2: Global ASEAN Waste Management Industry Volume Breakdown (Billion, %) by Region 2025 & 2033
- Figure 3: Indonesia ASEAN Waste Management Industry Revenue (Million), by Waste type 2025 & 2033
- Figure 4: Indonesia ASEAN Waste Management Industry Volume (Billion), by Waste type 2025 & 2033
- Figure 5: Indonesia ASEAN Waste Management Industry Revenue Share (%), by Waste type 2025 & 2033
- Figure 6: Indonesia ASEAN Waste Management Industry Volume Share (%), by Waste type 2025 & 2033
- Figure 7: Indonesia ASEAN Waste Management Industry Revenue (Million), by Disposal methods 2025 & 2033
- Figure 8: Indonesia ASEAN Waste Management Industry Volume (Billion), by Disposal methods 2025 & 2033
- Figure 9: Indonesia ASEAN Waste Management Industry Revenue Share (%), by Disposal methods 2025 & 2033
- Figure 10: Indonesia ASEAN Waste Management Industry Volume Share (%), by Disposal methods 2025 & 2033
- Figure 11: Indonesia ASEAN Waste Management Industry Revenue (Million), by Geography 2025 & 2033
- Figure 12: Indonesia ASEAN Waste Management Industry Volume (Billion), by Geography 2025 & 2033
- Figure 13: Indonesia ASEAN Waste Management Industry Revenue Share (%), by Geography 2025 & 2033
- Figure 14: Indonesia ASEAN Waste Management Industry Volume Share (%), by Geography 2025 & 2033
- Figure 15: Indonesia ASEAN Waste Management Industry Revenue (Million), by Country 2025 & 2033
- Figure 16: Indonesia ASEAN Waste Management Industry Volume (Billion), by Country 2025 & 2033
- Figure 17: Indonesia ASEAN Waste Management Industry Revenue Share (%), by Country 2025 & 2033
- Figure 18: Indonesia ASEAN Waste Management Industry Volume Share (%), by Country 2025 & 2033
- Figure 19: Thailand ASEAN Waste Management Industry Revenue (Million), by Waste type 2025 & 2033
- Figure 20: Thailand ASEAN Waste Management Industry Volume (Billion), by Waste type 2025 & 2033
- Figure 21: Thailand ASEAN Waste Management Industry Revenue Share (%), by Waste type 2025 & 2033
- Figure 22: Thailand ASEAN Waste Management Industry Volume Share (%), by Waste type 2025 & 2033
- Figure 23: Thailand ASEAN Waste Management Industry Revenue (Million), by Disposal methods 2025 & 2033
- Figure 24: Thailand ASEAN Waste Management Industry Volume (Billion), by Disposal methods 2025 & 2033
- Figure 25: Thailand ASEAN Waste Management Industry Revenue Share (%), by Disposal methods 2025 & 2033
- Figure 26: Thailand ASEAN Waste Management Industry Volume Share (%), by Disposal methods 2025 & 2033
- Figure 27: Thailand ASEAN Waste Management Industry Revenue (Million), by Geography 2025 & 2033
- Figure 28: Thailand ASEAN Waste Management Industry Volume (Billion), by Geography 2025 & 2033
- Figure 29: Thailand ASEAN Waste Management Industry Revenue Share (%), by Geography 2025 & 2033
- Figure 30: Thailand ASEAN Waste Management Industry Volume Share (%), by Geography 2025 & 2033
- Figure 31: Thailand ASEAN Waste Management Industry Revenue (Million), by Country 2025 & 2033
- Figure 32: Thailand ASEAN Waste Management Industry Volume (Billion), by Country 2025 & 2033
- Figure 33: Thailand ASEAN Waste Management Industry Revenue Share (%), by Country 2025 & 2033
- Figure 34: Thailand ASEAN Waste Management Industry Volume Share (%), by Country 2025 & 2033
- Figure 35: Malaysia ASEAN Waste Management Industry Revenue (Million), by Waste type 2025 & 2033
- Figure 36: Malaysia ASEAN Waste Management Industry Volume (Billion), by Waste type 2025 & 2033
- Figure 37: Malaysia ASEAN Waste Management Industry Revenue Share (%), by Waste type 2025 & 2033
- Figure 38: Malaysia ASEAN Waste Management Industry Volume Share (%), by Waste type 2025 & 2033
- Figure 39: Malaysia ASEAN Waste Management Industry Revenue (Million), by Disposal methods 2025 & 2033
- Figure 40: Malaysia ASEAN Waste Management Industry Volume (Billion), by Disposal methods 2025 & 2033
- Figure 41: Malaysia ASEAN Waste Management Industry Revenue Share (%), by Disposal methods 2025 & 2033
- Figure 42: Malaysia ASEAN Waste Management Industry Volume Share (%), by Disposal methods 2025 & 2033
- Figure 43: Malaysia ASEAN Waste Management Industry Revenue (Million), by Geography 2025 & 2033
- Figure 44: Malaysia ASEAN Waste Management Industry Volume (Billion), by Geography 2025 & 2033
- Figure 45: Malaysia ASEAN Waste Management Industry Revenue Share (%), by Geography 2025 & 2033
- Figure 46: Malaysia ASEAN Waste Management Industry Volume Share (%), by Geography 2025 & 2033
- Figure 47: Malaysia ASEAN Waste Management Industry Revenue (Million), by Country 2025 & 2033
- Figure 48: Malaysia ASEAN Waste Management Industry Volume (Billion), by Country 2025 & 2033
- Figure 49: Malaysia ASEAN Waste Management Industry Revenue Share (%), by Country 2025 & 2033
- Figure 50: Malaysia ASEAN Waste Management Industry Volume Share (%), by Country 2025 & 2033
- Figure 51: Singapore ASEAN Waste Management Industry Revenue (Million), by Waste type 2025 & 2033
- Figure 52: Singapore ASEAN Waste Management Industry Volume (Billion), by Waste type 2025 & 2033
- Figure 53: Singapore ASEAN Waste Management Industry Revenue Share (%), by Waste type 2025 & 2033
- Figure 54: Singapore ASEAN Waste Management Industry Volume Share (%), by Waste type 2025 & 2033
- Figure 55: Singapore ASEAN Waste Management Industry Revenue (Million), by Disposal methods 2025 & 2033
- Figure 56: Singapore ASEAN Waste Management Industry Volume (Billion), by Disposal methods 2025 & 2033
- Figure 57: Singapore ASEAN Waste Management Industry Revenue Share (%), by Disposal methods 2025 & 2033
- Figure 58: Singapore ASEAN Waste Management Industry Volume Share (%), by Disposal methods 2025 & 2033
- Figure 59: Singapore ASEAN Waste Management Industry Revenue (Million), by Geography 2025 & 2033
- Figure 60: Singapore ASEAN Waste Management Industry Volume (Billion), by Geography 2025 & 2033
- Figure 61: Singapore ASEAN Waste Management Industry Revenue Share (%), by Geography 2025 & 2033
- Figure 62: Singapore ASEAN Waste Management Industry Volume Share (%), by Geography 2025 & 2033
- Figure 63: Singapore ASEAN Waste Management Industry Revenue (Million), by Country 2025 & 2033
- Figure 64: Singapore ASEAN Waste Management Industry Volume (Billion), by Country 2025 & 2033
- Figure 65: Singapore ASEAN Waste Management Industry Revenue Share (%), by Country 2025 & 2033
- Figure 66: Singapore ASEAN Waste Management Industry Volume Share (%), by Country 2025 & 2033
- Figure 67: Rest of ASEAN ASEAN Waste Management Industry Revenue (Million), by Waste type 2025 & 2033
- Figure 68: Rest of ASEAN ASEAN Waste Management Industry Volume (Billion), by Waste type 2025 & 2033
- Figure 69: Rest of ASEAN ASEAN Waste Management Industry Revenue Share (%), by Waste type 2025 & 2033
- Figure 70: Rest of ASEAN ASEAN Waste Management Industry Volume Share (%), by Waste type 2025 & 2033
- Figure 71: Rest of ASEAN ASEAN Waste Management Industry Revenue (Million), by Disposal methods 2025 & 2033
- Figure 72: Rest of ASEAN ASEAN Waste Management Industry Volume (Billion), by Disposal methods 2025 & 2033
- Figure 73: Rest of ASEAN ASEAN Waste Management Industry Revenue Share (%), by Disposal methods 2025 & 2033
- Figure 74: Rest of ASEAN ASEAN Waste Management Industry Volume Share (%), by Disposal methods 2025 & 2033
- Figure 75: Rest of ASEAN ASEAN Waste Management Industry Revenue (Million), by Geography 2025 & 2033
- Figure 76: Rest of ASEAN ASEAN Waste Management Industry Volume (Billion), by Geography 2025 & 2033
- Figure 77: Rest of ASEAN ASEAN Waste Management Industry Revenue Share (%), by Geography 2025 & 2033
- Figure 78: Rest of ASEAN ASEAN Waste Management Industry Volume Share (%), by Geography 2025 & 2033
- Figure 79: Rest of ASEAN ASEAN Waste Management Industry Revenue (Million), by Country 2025 & 2033
- Figure 80: Rest of ASEAN ASEAN Waste Management Industry Volume (Billion), by Country 2025 & 2033
- Figure 81: Rest of ASEAN ASEAN Waste Management Industry Revenue Share (%), by Country 2025 & 2033
- Figure 82: Rest of ASEAN ASEAN Waste Management Industry Volume Share (%), by Country 2025 & 2033
List of Tables
- Table 1: Global ASEAN Waste Management Industry Revenue Million Forecast, by Waste type 2020 & 2033
- Table 2: Global ASEAN Waste Management Industry Volume Billion Forecast, by Waste type 2020 & 2033
- Table 3: Global ASEAN Waste Management Industry Revenue Million Forecast, by Disposal methods 2020 & 2033
- Table 4: Global ASEAN Waste Management Industry Volume Billion Forecast, by Disposal methods 2020 & 2033
- Table 5: Global ASEAN Waste Management Industry Revenue Million Forecast, by Geography 2020 & 2033
- Table 6: Global ASEAN Waste Management Industry Volume Billion Forecast, by Geography 2020 & 2033
- Table 7: Global ASEAN Waste Management Industry Revenue Million Forecast, by Region 2020 & 2033
- Table 8: Global ASEAN Waste Management Industry Volume Billion Forecast, by Region 2020 & 2033
- Table 9: Global ASEAN Waste Management Industry Revenue Million Forecast, by Waste type 2020 & 2033
- Table 10: Global ASEAN Waste Management Industry Volume Billion Forecast, by Waste type 2020 & 2033
- Table 11: Global ASEAN Waste Management Industry Revenue Million Forecast, by Disposal methods 2020 & 2033
- Table 12: Global ASEAN Waste Management Industry Volume Billion Forecast, by Disposal methods 2020 & 2033
- Table 13: Global ASEAN Waste Management Industry Revenue Million Forecast, by Geography 2020 & 2033
- Table 14: Global ASEAN Waste Management Industry Volume Billion Forecast, by Geography 2020 & 2033
- Table 15: Global ASEAN Waste Management Industry Revenue Million Forecast, by Country 2020 & 2033
- Table 16: Global ASEAN Waste Management Industry Volume Billion Forecast, by Country 2020 & 2033
- Table 17: Global ASEAN Waste Management Industry Revenue Million Forecast, by Waste type 2020 & 2033
- Table 18: Global ASEAN Waste Management Industry Volume Billion Forecast, by Waste type 2020 & 2033
- Table 19: Global ASEAN Waste Management Industry Revenue Million Forecast, by Disposal methods 2020 & 2033
- Table 20: Global ASEAN Waste Management Industry Volume Billion Forecast, by Disposal methods 2020 & 2033
- Table 21: Global ASEAN Waste Management Industry Revenue Million Forecast, by Geography 2020 & 2033
- Table 22: Global ASEAN Waste Management Industry Volume Billion Forecast, by Geography 2020 & 2033
- Table 23: Global ASEAN Waste Management Industry Revenue Million Forecast, by Country 2020 & 2033
- Table 24: Global ASEAN Waste Management Industry Volume Billion Forecast, by Country 2020 & 2033
- Table 25: Global ASEAN Waste Management Industry Revenue Million Forecast, by Waste type 2020 & 2033
- Table 26: Global ASEAN Waste Management Industry Volume Billion Forecast, by Waste type 2020 & 2033
- Table 27: Global ASEAN Waste Management Industry Revenue Million Forecast, by Disposal methods 2020 & 2033
- Table 28: Global ASEAN Waste Management Industry Volume Billion Forecast, by Disposal methods 2020 & 2033
- Table 29: Global ASEAN Waste Management Industry Revenue Million Forecast, by Geography 2020 & 2033
- Table 30: Global ASEAN Waste Management Industry Volume Billion Forecast, by Geography 2020 & 2033
- Table 31: Global ASEAN Waste Management Industry Revenue Million Forecast, by Country 2020 & 2033
- Table 32: Global ASEAN Waste Management Industry Volume Billion Forecast, by Country 2020 & 2033
- Table 33: Global ASEAN Waste Management Industry Revenue Million Forecast, by Waste type 2020 & 2033
- Table 34: Global ASEAN Waste Management Industry Volume Billion Forecast, by Waste type 2020 & 2033
- Table 35: Global ASEAN Waste Management Industry Revenue Million Forecast, by Disposal methods 2020 & 2033
- Table 36: Global ASEAN Waste Management Industry Volume Billion Forecast, by Disposal methods 2020 & 2033
- Table 37: Global ASEAN Waste Management Industry Revenue Million Forecast, by Geography 2020 & 2033
- Table 38: Global ASEAN Waste Management Industry Volume Billion Forecast, by Geography 2020 & 2033
- Table 39: Global ASEAN Waste Management Industry Revenue Million Forecast, by Country 2020 & 2033
- Table 40: Global ASEAN Waste Management Industry Volume Billion Forecast, by Country 2020 & 2033
- Table 41: Global ASEAN Waste Management Industry Revenue Million Forecast, by Waste type 2020 & 2033
- Table 42: Global ASEAN Waste Management Industry Volume Billion Forecast, by Waste type 2020 & 2033
- Table 43: Global ASEAN Waste Management Industry Revenue Million Forecast, by Disposal methods 2020 & 2033
- Table 44: Global ASEAN Waste Management Industry Volume Billion Forecast, by Disposal methods 2020 & 2033
- Table 45: Global ASEAN Waste Management Industry Revenue Million Forecast, by Geography 2020 & 2033
- Table 46: Global ASEAN Waste Management Industry Volume Billion Forecast, by Geography 2020 & 2033
- Table 47: Global ASEAN Waste Management Industry Revenue Million Forecast, by Country 2020 & 2033
- Table 48: Global ASEAN Waste Management Industry Volume Billion Forecast, by Country 2020 & 2033
Frequently Asked Questions
1. What is the projected Compound Annual Growth Rate (CAGR) of the ASEAN Waste Management Industry?
The projected CAGR is approximately 6.74%.
2. Which companies are prominent players in the ASEAN Waste Management Industry?
Key companies in the market include Sembcorp Environmental Management Pte Ltd (Singapore), Veolia Environmental S A, Colex Holdings Limited, Remondis, Klang Waste Care, Starpal Pte Ltd, Blue Planet Environmental Solutions, Greenway Environmental, PT Prasadha Pamunah Limbah Industri - PPLI, Boon Poh Refuse Disposal Pte Ltd, Suez Environment, Earth Recycling Services Ltd, ALBA Group Asia, Se Cure Waste Management**List Not Exhaustive.
3. What are the main segments of the ASEAN Waste Management Industry?
The market segments include Waste type, Disposal methods, Geography.
4. Can you provide details about the market size?
The market size is estimated to be USD 31.25 Million as of 2022.
5. What are some drivers contributing to market growth?
N/A
6. What are the notable trends driving market growth?
Indonesia Advances Zero-Plastic Waste Ambitions with Public-Private Partnership to Build Waste Management Capacity and Capability.
7. Are there any restraints impacting market growth?
N/A
8. Can you provide examples of recent developments in the market?
December 2022: A cooperative venture called Rebottle between Singapore Polytechnic (SP) and SembWaste, a fully owned subsidiary of Sembcorp Industries (Sembcorp) intends to increase the amount of PET bottles that are recycled in Singapore, beginning with the Punggol Shore area.June 2022: The introduction of a representative office in the Wijayakusuma Industrial Area was conducted on Thursday, June 30, 2022, making it a significant day in the history of PT Prasadha Pamunah Waste Industries (PPLI). The Wijayakusuma Industrial Estate's management, PT KIW, has leased space to the newly established PT PPLI representative office (Persero). Selling land for industrial usage, renting Ready-to-Use Factory Buildings (BPSP), and leasing space for offices are all part of PT KIW's primary business. The PT PPLI-DESI representative office will be opened with the intention of being a dependable partner for businesses, the Indonesian government, and other stakeholders, and contributing to Indonesia's economic and environmental growth.
9. What pricing options are available for accessing the report?
Pricing options include single-user, multi-user, and enterprise licenses priced at USD 4750, USD 5250, and USD 8750 respectively.
10. Is the market size provided in terms of value or volume?
The market size is provided in terms of value, measured in Million and volume, measured in Billion.
11. Are there any specific market keywords associated with the report?
Yes, the market keyword associated with the report is "ASEAN Waste Management Industry," which aids in identifying and referencing the specific market segment covered.
12. How do I determine which pricing option suits my needs best?
The pricing options vary based on user requirements and access needs. Individual users may opt for single-user licenses, while businesses requiring broader access may choose multi-user or enterprise licenses for cost-effective access to the report.
13. Are there any additional resources or data provided in the ASEAN Waste Management Industry report?
While the report offers comprehensive insights, it's advisable to review the specific contents or supplementary materials provided to ascertain if additional resources or data are available.
14. How can I stay updated on further developments or reports in the ASEAN Waste Management Industry?
To stay informed about further developments, trends, and reports in the ASEAN Waste Management Industry, consider subscribing to industry newsletters, following relevant companies and organizations, or regularly checking reputable industry news sources and publications.
Methodology
Step 1 - Identification of Relevant Samples Size from Population Database


Step 2 - Approaches for Defining Global Market Size (Value, Volume* & Price*)

Note*: In applicable scenarios
Step 3 - Data Sources
Primary Research
- Web Analytics
- Survey Reports
- Research Institute
- Latest Research Reports
- Opinion Leaders
Secondary Research
- Annual Reports
- White Paper
- Latest Press Release
- Industry Association
- Paid Database
- Investor Presentations

Step 4 - Data Triangulation
Involves using different sources of information in order to increase the validity of a study
These sources are likely to be stakeholders in a program - participants, other researchers, program staff, other community members, and so on.
Then we put all data in single framework & apply various statistical tools to find out the dynamic on the market.
During the analysis stage, feedback from the stakeholder groups would be compared to determine areas of agreement as well as areas of divergence