

Key Insights
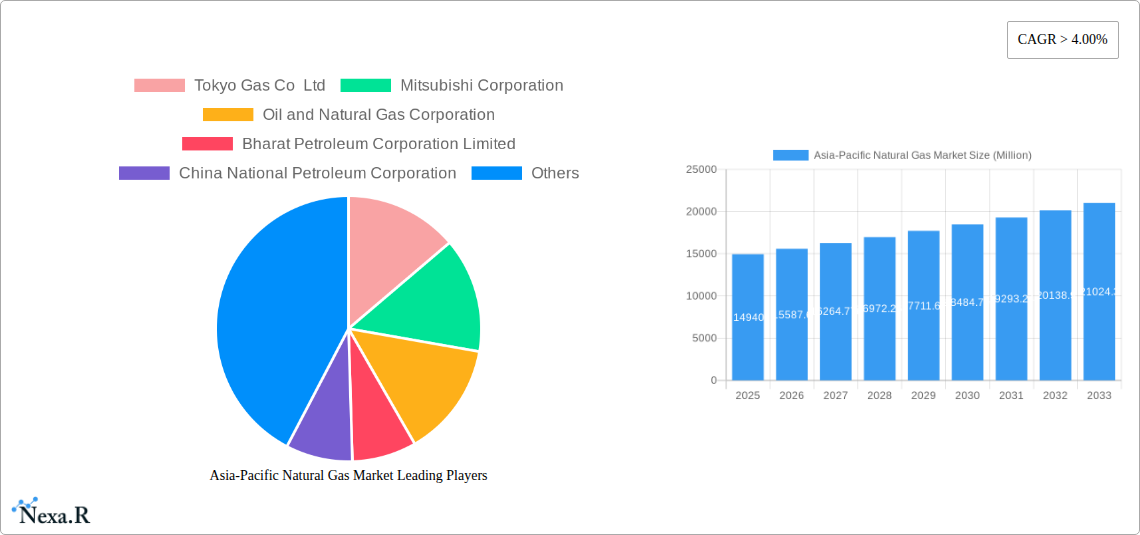
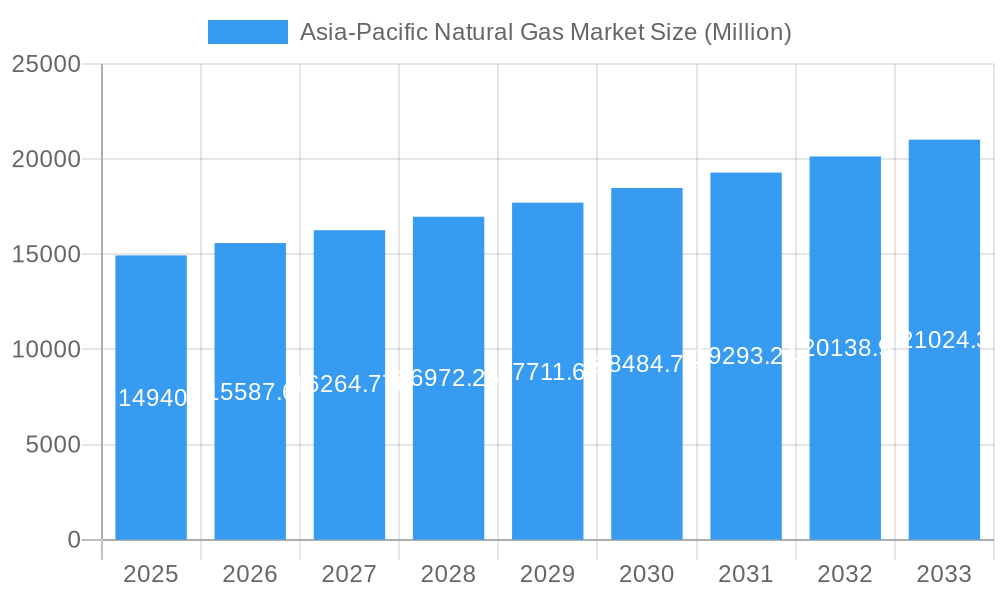
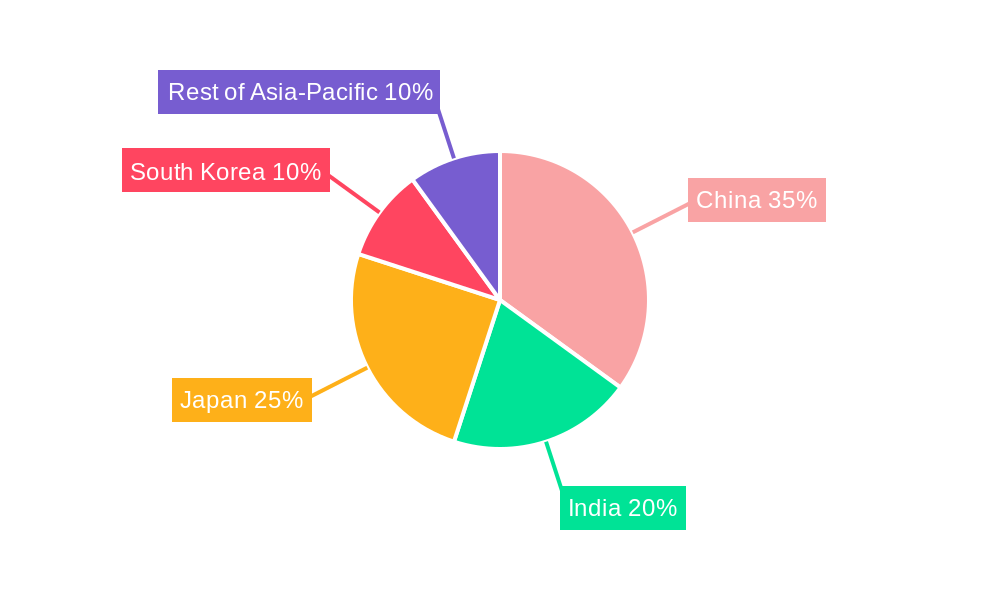
The Asia-Pacific Natural Gas Market, valued at $14,940 million in 2025, is poised for robust growth, exhibiting a Compound Annual Growth Rate (CAGR) exceeding 4.00% from 2025 to 2033. This expansion is driven by several key factors. Increasing industrialization across the region, particularly in countries like China, India, and South Korea, fuels a significant demand for natural gas in power generation and industrial processes. Furthermore, government initiatives promoting cleaner energy sources and reducing reliance on coal are bolstering natural gas adoption. The rising urban population and improving living standards are also driving residential natural gas consumption. Growth in the transportation sector, specifically in LNG-powered vehicles, further contributes to market expansion. While infrastructure limitations in some areas and price volatility remain challenges, the overall market outlook remains positive, fueled by consistent economic growth and energy diversification strategies across the Asia-Pacific region. The market segmentation reveals significant opportunities within unconventional natural gas sources, as exploration and extraction technologies advance. Major players such as Tokyo Gas Co Ltd, Mitsubishi Corporation, and GAIL Limited are strategically positioned to capitalize on this growth, leveraging their established networks and expertise in the natural gas value chain. The dominance of countries like China, India, and Japan within the Asia-Pacific region underscores their crucial role in shaping the market’s future trajectory.
Asia-Pacific Natural Gas Market Market Size (In Billion)
The substantial growth projected for the Asia-Pacific Natural Gas Market is underpinned by the region's rapidly developing economies and increasing energy needs. The diverse applications of natural gas, ranging from electricity generation to industrial processes and residential heating, ensure a broad and resilient market. Competition among major players will intensify as they strive to secure supply sources and enhance their market share. Technological advancements in LNG transportation and storage are expected to improve efficiency and reduce costs, further stimulating market growth. However, ongoing geopolitical uncertainties and environmental concerns related to methane emissions necessitate a focus on sustainable practices and responsible resource management. The continued investment in infrastructure development, particularly pipelines and LNG terminals, will be pivotal in ensuring the reliable and efficient distribution of natural gas across the Asia-Pacific region, thereby unlocking the market’s full potential.
Asia-Pacific Natural Gas Market Company Market Share
Asia-Pacific Natural Gas Market Report: 2019-2033
This comprehensive report provides an in-depth analysis of the Asia-Pacific natural gas market, encompassing historical data (2019-2024), the base year (2025), and a detailed forecast (2025-2033). It delves into market dynamics, growth trends, dominant segments, and key players, offering invaluable insights for industry professionals, investors, and strategic decision-makers. The report segments the market by type (conventional, unconventional, LNG), application (power generation, industrial, residential, transportation), and end-user industry (utilities, industrial, residential, transportation). The market size is presented in million units throughout the report.
Asia-Pacific Natural Gas Market Dynamics & Structure
The Asia-Pacific natural gas market is characterized by a moderately concentrated structure, with several major players holding significant market share. However, the market exhibits considerable dynamism due to ongoing technological innovation, evolving regulatory frameworks, and the emergence of competitive substitutes like renewable energy sources. Mergers and acquisitions (M&A) activity is relatively frequent, reflecting strategic consolidation and expansion efforts within the industry.
- Market Concentration: The top five players hold approximately xx% of the market share in 2025, indicating a moderately concentrated market structure.
- Technological Innovation: The adoption of advanced exploration and extraction technologies, such as hydraulic fracturing and LNG regasification, is driving efficiency gains and expanding accessible reserves. However, high initial investment costs and environmental concerns pose significant barriers.
- Regulatory Frameworks: Government policies focused on energy security and environmental sustainability are shaping market dynamics, influencing investment decisions and the adoption of cleaner energy solutions. Varying regulatory landscapes across different countries in the region create complexities for market participants.
- Competitive Product Substitutes: Renewable energy sources, such as solar and wind power, pose a growing competitive threat, particularly as their costs continue to decline. This is forcing natural gas producers to focus on efficiency and cost reduction to maintain competitiveness.
- End-User Demographics: The increasing urbanization and industrialization in the Asia-Pacific region are driving substantial growth in the demand for natural gas across various sectors. This is particularly evident in the power generation and industrial sectors.
- M&A Trends: The number of M&A deals in the Asia-Pacific natural gas market averaged xx per year during the historical period (2019-2024), indicating considerable consolidation and strategic alliances. Deal values totaled approximately xx million units over the same period.
Asia-Pacific Natural Gas Market Growth Trends & Insights
The Asia-Pacific natural gas market is projected to experience robust growth throughout the forecast period (2025-2033). Driven by strong economic growth, rising energy demand, and supportive government policies, the market is expected to expand significantly. The increasing adoption of natural gas in power generation and industrial applications is a major driver of this growth. Technological advancements, such as improvements in LNG transportation and storage, are also contributing factors. Consumer behavior is shifting towards cleaner energy sources, boosting the demand for natural gas as a relatively cleaner fossil fuel compared to coal. The market is poised for continued expansion, with the Compound Annual Growth Rate (CAGR) expected to be xx% from 2025 to 2033, driven by consistent investments in infrastructure development and the ongoing shift towards a less carbon-intensive energy mix. Market penetration in key sectors like power generation will reach xx% by 2033.
Dominant Regions, Countries, or Segments in Asia-Pacific Natural Gas Market
China and India are the dominant markets within the Asia-Pacific region, driven by their large populations, rapid economic growth, and significant energy needs. Within the segments, Liquefied Natural Gas (LNG) is experiencing the fastest growth, fuelled by robust international trade and flexible transportation options. The power generation sector is the largest consumer of natural gas, and its growth reflects rising electricity demand across the region.
- Key Drivers in China: Government support for infrastructure development, massive industrialization, and rising electricity demand contribute to China's dominance.
- Key Drivers in India: Government initiatives aiming to increase the natural gas share in the energy mix to 15% by 2030, coupled with rising residential and industrial consumption, fuel India's market growth.
- LNG Segment Dominance: The flexibility and ease of transportation of LNG, coupled with rising global LNG trade, drives this segment's growth.
- Power Generation Sector Leadership: Power generation remains the largest consumer of natural gas, driven by the increasing demand for electricity in rapidly developing economies.
Asia-Pacific Natural Gas Market Product Landscape
The Asia-Pacific natural gas market encompasses a range of products, including conventional and unconventional natural gas, as well as liquefied natural gas (LNG). Continuous innovation focuses on improving extraction efficiency, reducing environmental impacts, and enhancing transportation infrastructure. Advanced technologies, such as enhanced oil recovery (EOR) techniques, are employed to maximize resource utilization and reduce production costs. The unique selling propositions often center on the cost-effectiveness, energy density, and relative cleanliness compared to other fossil fuels, making it attractive for various applications.
Key Drivers, Barriers & Challenges in Asia-Pacific Natural Gas Market
Key Drivers:
- Increasing energy demand fueled by rapid economic growth and population increase across the Asia-Pacific region.
- Government initiatives promoting natural gas as a cleaner and more efficient alternative to coal.
- Technological advancements enhancing exploration, extraction, and transportation efficiency.
Key Challenges and Restraints:
- Geopolitical instability and price volatility impacting natural gas supply chains.
- Environmental concerns related to methane emissions and the carbon footprint of natural gas production.
- Competition from renewable energy sources and the need for sustained investment in infrastructure development.
Emerging Opportunities in Asia-Pacific Natural Gas Market
- Growing demand for natural gas in the transportation sector, including compressed natural gas (CNG) for vehicles.
- Expanding opportunities in emerging economies with limited access to reliable energy sources.
- Potential for developing innovative applications of natural gas in industrial processes and as a feedstock for chemicals.
Growth Accelerators in the Asia-Pacific Natural Gas Market Industry
Long-term growth will be driven by sustained investment in infrastructure development, technological advancements enabling efficient resource utilization, and strategic partnerships among major industry players. Government policies supporting the transition towards a less carbon-intensive energy mix, coupled with ongoing exploration and discoveries of new natural gas reserves, will further bolster market expansion.
Key Players Shaping the Asia-Pacific Natural Gas Market Market
Notable Milestones in Asia-Pacific Natural Gas Market Sector
- July 2022: The Indian government targets a 15% share of natural gas in the energy mix by 2030, from 6.3%, with 95.21 lakh PNG domestic connections and 4531 CNG transport stations established by 31 May 2022.
- May 2022: CNOOC awards USD 2.42 billion contracts for 12 LNG tankers, each capable of carrying 108 million cubic meters of re-gasified LNG, slated for commissioning between 2024 and 2027.
- January 2022: GAIL (India) Ltd commences India's first hydrogen-natural gas mixing project in Indore, supplying hydrogen-blended natural gas to Avantika Gas Ltd.
In-Depth Asia-Pacific Natural Gas Market Market Outlook
The Asia-Pacific natural gas market is poised for sustained growth, driven by the increasing energy demands of a rapidly developing region. The strategic partnerships between national energy providers and international companies, along with advancements in exploration and extraction technologies, represent a significant potential for market expansion. Future opportunities lie in the optimization of existing infrastructure, the exploration of untapped reserves, and the development of innovative applications, ensuring a robust and resilient natural gas market in the Asia-Pacific region for years to come.
Asia-Pacific Natural Gas Market Segmentation
- 1. China
- 2. India
- 3. Japan
- 4. South Korea
- 5. Rest of Asia-Pacific
Asia-Pacific Natural Gas Market Segmentation By Geography
-
1. Asia Pacific
- 1.1. China
- 1.2. Japan
- 1.3. South Korea
- 1.4. India
- 1.5. Australia
- 1.6. New Zealand
- 1.7. Indonesia
- 1.8. Malaysia
- 1.9. Singapore
- 1.10. Thailand
- 1.11. Vietnam
- 1.12. Philippines
Asia-Pacific Natural Gas Market Regional Market Share
Geographic Coverage of Asia-Pacific Natural Gas Market
Asia-Pacific Natural Gas Market REPORT HIGHLIGHTS
| Aspects | Details |
|---|---|
| Study Period | 2020-2034 |
| Base Year | 2025 |
| Estimated Year | 2026 |
| Forecast Period | 2026-2034 |
| Historical Period | 2020-2025 |
| Growth Rate | CAGR of > 4.00% from 2020-2034 |
| Segmentation |
|
Table of Contents
- 1. Introduction
- 1.1. Research Scope
- 1.2. Market Segmentation
- 1.3. Research Objective
- 1.4. Definitions and Assumptions
- 2. Executive Summary
- 2.1. Market Snapshot
- 3. Market Dynamics
- 3.1. Market Drivers
- 3.2. Market Restrains
- 3.3. Market Trends
- 3.4. Market Opportunities
- 4. Market Factor Analysis
- 4.1. Porters Five Forces
- 4.1.1. Bargaining Power of Suppliers
- 4.1.2. Bargaining Power of Buyers
- 4.1.3. Threat of New Entrants
- 4.1.4. Threat of Substitutes
- 4.1.5. Competitive Rivalry
- 4.2. PESTEL analysis
- 4.3. BCG Analysis
- 4.3.1. Stars (High Growth, High Market Share)
- 4.3.2. Cash Cows (Low Growth, High Market Share)
- 4.3.3. Question Mark (High Growth, Low Market Share)
- 4.3.4. Dogs (Low Growth, Low Market Share)
- 4.4. Ansoff Matrix Analysis
- 4.5. Supply Chain Analysis
- 4.6. Regulatory Landscape
- 4.7. Current Market Potential and Opportunity Assessment (TAM–SAM–SOM Framework)
- 4.8. NRP Analyst Note
- 4.1. Porters Five Forces
- 5. Market Analysis, Insights and Forecast 2021-2033
- 5.1. Market Analysis, Insights and Forecast - by China
- 5.2. Market Analysis, Insights and Forecast - by India
- 5.3. Market Analysis, Insights and Forecast - by Japan
- 5.4. Market Analysis, Insights and Forecast - by South Korea
- 5.5. Market Analysis, Insights and Forecast - by Rest of Asia-Pacific
- 5.6. Market Analysis, Insights and Forecast - by Region
- 5.6.1. Asia Pacific
- 6. Asia-Pacific Natural Gas Market Analysis, Insights and Forecast, 2021-2033
- 6.1. Market Analysis, Insights and Forecast - by China
- 6.2. Market Analysis, Insights and Forecast - by India
- 6.3. Market Analysis, Insights and Forecast - by Japan
- 6.4. Market Analysis, Insights and Forecast - by South Korea
- 6.5. Market Analysis, Insights and Forecast - by Rest of Asia-Pacific
- 7. Competitive Analysis
- 7.1. Company Profiles
- 7.1.1 Tokyo Gas Co Ltd
- 7.1.1.1. Company Overview
- 7.1.1.2. Products
- 7.1.1.3. Company Financials
- 7.1.1.4. SWOT Analysis
- 7.1.2 Mitsubishi Corporation
- 7.1.2.1. Company Overview
- 7.1.2.2. Products
- 7.1.2.3. Company Financials
- 7.1.2.4. SWOT Analysis
- 7.1.3 Oil and Natural Gas Corporation
- 7.1.3.1. Company Overview
- 7.1.3.2. Products
- 7.1.3.3. Company Financials
- 7.1.3.4. SWOT Analysis
- 7.1.4 Bharat Petroleum Corporation Limited
- 7.1.4.1. Company Overview
- 7.1.4.2. Products
- 7.1.4.3. Company Financials
- 7.1.4.4. SWOT Analysis
- 7.1.5 China National Petroleum Corporation
- 7.1.5.1. Company Overview
- 7.1.5.2. Products
- 7.1.5.3. Company Financials
- 7.1.5.4. SWOT Analysis
- 7.1.6 Korea Gas Corporation
- 7.1.6.1. Company Overview
- 7.1.6.2. Products
- 7.1.6.3. Company Financials
- 7.1.6.4. SWOT Analysis
- 7.1.7 China Petroleum & Chemical Corporation
- 7.1.7.1. Company Overview
- 7.1.7.2. Products
- 7.1.7.3. Company Financials
- 7.1.7.4. SWOT Analysis
- 7.1.8 Chevron Corporation
- 7.1.8.1. Company Overview
- 7.1.8.2. Products
- 7.1.8.3. Company Financials
- 7.1.8.4. SWOT Analysis
- 7.1.9 GAIL Limited
- 7.1.9.1. Company Overview
- 7.1.9.2. Products
- 7.1.9.3. Company Financials
- 7.1.9.4. SWOT Analysis
- 7.1.10 ENN Energy Holdings Limited*List Not Exhaustive
- 7.1.10.1. Company Overview
- 7.1.10.2. Products
- 7.1.10.3. Company Financials
- 7.1.10.4. SWOT Analysis
- 7.1.1 Tokyo Gas Co Ltd
- 7.2. Market Entropy
- 7.2.1 Company's Key Areas Served
- 7.2.2 Recent Developments
- 7.3. Company Market Share Analysis 2025
- 7.3.1 Top 5 Companies Market Share Analysis
- 7.3.2 Top 3 Companies Market Share Analysis
- 7.4. List of Potential Customers
- 8. Research Methodology
List of Figures
- Figure 1: Asia-Pacific Natural Gas Market Revenue Breakdown (Million, %) by Product 2025 & 2033
- Figure 2: Asia-Pacific Natural Gas Market Share (%) by Company 2025
List of Tables
- Table 1: Asia-Pacific Natural Gas Market Revenue Million Forecast, by China 2020 & 2033
- Table 2: Asia-Pacific Natural Gas Market Volume K Tons Forecast, by China 2020 & 2033
- Table 3: Asia-Pacific Natural Gas Market Revenue Million Forecast, by India 2020 & 2033
- Table 4: Asia-Pacific Natural Gas Market Volume K Tons Forecast, by India 2020 & 2033
- Table 5: Asia-Pacific Natural Gas Market Revenue Million Forecast, by Japan 2020 & 2033
- Table 6: Asia-Pacific Natural Gas Market Volume K Tons Forecast, by Japan 2020 & 2033
- Table 7: Asia-Pacific Natural Gas Market Revenue Million Forecast, by South Korea 2020 & 2033
- Table 8: Asia-Pacific Natural Gas Market Volume K Tons Forecast, by South Korea 2020 & 2033
- Table 9: Asia-Pacific Natural Gas Market Revenue Million Forecast, by Rest of Asia-Pacific 2020 & 2033
- Table 10: Asia-Pacific Natural Gas Market Volume K Tons Forecast, by Rest of Asia-Pacific 2020 & 2033
- Table 11: Asia-Pacific Natural Gas Market Revenue Million Forecast, by Region 2020 & 2033
- Table 12: Asia-Pacific Natural Gas Market Volume K Tons Forecast, by Region 2020 & 2033
- Table 13: Asia-Pacific Natural Gas Market Revenue Million Forecast, by China 2020 & 2033
- Table 14: Asia-Pacific Natural Gas Market Volume K Tons Forecast, by China 2020 & 2033
- Table 15: Asia-Pacific Natural Gas Market Revenue Million Forecast, by India 2020 & 2033
- Table 16: Asia-Pacific Natural Gas Market Volume K Tons Forecast, by India 2020 & 2033
- Table 17: Asia-Pacific Natural Gas Market Revenue Million Forecast, by Japan 2020 & 2033
- Table 18: Asia-Pacific Natural Gas Market Volume K Tons Forecast, by Japan 2020 & 2033
- Table 19: Asia-Pacific Natural Gas Market Revenue Million Forecast, by South Korea 2020 & 2033
- Table 20: Asia-Pacific Natural Gas Market Volume K Tons Forecast, by South Korea 2020 & 2033
- Table 21: Asia-Pacific Natural Gas Market Revenue Million Forecast, by Rest of Asia-Pacific 2020 & 2033
- Table 22: Asia-Pacific Natural Gas Market Volume K Tons Forecast, by Rest of Asia-Pacific 2020 & 2033
- Table 23: Asia-Pacific Natural Gas Market Revenue Million Forecast, by Country 2020 & 2033
- Table 24: Asia-Pacific Natural Gas Market Volume K Tons Forecast, by Country 2020 & 2033
- Table 25: China Asia-Pacific Natural Gas Market Revenue (Million) Forecast, by Application 2020 & 2033
- Table 26: China Asia-Pacific Natural Gas Market Volume (K Tons) Forecast, by Application 2020 & 2033
- Table 27: Japan Asia-Pacific Natural Gas Market Revenue (Million) Forecast, by Application 2020 & 2033
- Table 28: Japan Asia-Pacific Natural Gas Market Volume (K Tons) Forecast, by Application 2020 & 2033
- Table 29: South Korea Asia-Pacific Natural Gas Market Revenue (Million) Forecast, by Application 2020 & 2033
- Table 30: South Korea Asia-Pacific Natural Gas Market Volume (K Tons) Forecast, by Application 2020 & 2033
- Table 31: India Asia-Pacific Natural Gas Market Revenue (Million) Forecast, by Application 2020 & 2033
- Table 32: India Asia-Pacific Natural Gas Market Volume (K Tons) Forecast, by Application 2020 & 2033
- Table 33: Australia Asia-Pacific Natural Gas Market Revenue (Million) Forecast, by Application 2020 & 2033
- Table 34: Australia Asia-Pacific Natural Gas Market Volume (K Tons) Forecast, by Application 2020 & 2033
- Table 35: New Zealand Asia-Pacific Natural Gas Market Revenue (Million) Forecast, by Application 2020 & 2033
- Table 36: New Zealand Asia-Pacific Natural Gas Market Volume (K Tons) Forecast, by Application 2020 & 2033
- Table 37: Indonesia Asia-Pacific Natural Gas Market Revenue (Million) Forecast, by Application 2020 & 2033
- Table 38: Indonesia Asia-Pacific Natural Gas Market Volume (K Tons) Forecast, by Application 2020 & 2033
- Table 39: Malaysia Asia-Pacific Natural Gas Market Revenue (Million) Forecast, by Application 2020 & 2033
- Table 40: Malaysia Asia-Pacific Natural Gas Market Volume (K Tons) Forecast, by Application 2020 & 2033
- Table 41: Singapore Asia-Pacific Natural Gas Market Revenue (Million) Forecast, by Application 2020 & 2033
- Table 42: Singapore Asia-Pacific Natural Gas Market Volume (K Tons) Forecast, by Application 2020 & 2033
- Table 43: Thailand Asia-Pacific Natural Gas Market Revenue (Million) Forecast, by Application 2020 & 2033
- Table 44: Thailand Asia-Pacific Natural Gas Market Volume (K Tons) Forecast, by Application 2020 & 2033
- Table 45: Vietnam Asia-Pacific Natural Gas Market Revenue (Million) Forecast, by Application 2020 & 2033
- Table 46: Vietnam Asia-Pacific Natural Gas Market Volume (K Tons) Forecast, by Application 2020 & 2033
- Table 47: Philippines Asia-Pacific Natural Gas Market Revenue (Million) Forecast, by Application 2020 & 2033
- Table 48: Philippines Asia-Pacific Natural Gas Market Volume (K Tons) Forecast, by Application 2020 & 2033
Frequently Asked Questions
1. What is the projected Compound Annual Growth Rate (CAGR) of the Asia-Pacific Natural Gas Market?
The projected CAGR is approximately > 4.00%.
2. Which companies are prominent players in the Asia-Pacific Natural Gas Market?
Key companies in the market include Tokyo Gas Co Ltd, Mitsubishi Corporation, Oil and Natural Gas Corporation, Bharat Petroleum Corporation Limited, China National Petroleum Corporation, Korea Gas Corporation, China Petroleum & Chemical Corporation, Chevron Corporation, GAIL Limited, ENN Energy Holdings Limited*List Not Exhaustive.
3. What are the main segments of the Asia-Pacific Natural Gas Market?
The market segments include China, India, Japan, South Korea, Rest of Asia-Pacific.
4. Can you provide details about the market size?
The market size is estimated to be USD 14940 Million as of 2022.
5. What are some drivers contributing to market growth?
4.; Increasing Electricity Demand4.; Rsing Investments in the Coal Industry.
6. What are the notable trends driving market growth?
Increasing Investments in Natural Gas Production to Drive the Market.
7. Are there any restraints impacting market growth?
4.; Increasing Installation of Renewable Energy Sources.
8. Can you provide examples of recent developments in the market?
July 2022: The Indian government announced that it had set a target to raise the share of natural gas in the energy mix to 15% by 2030 from the current 6.3%. According to the data demonstrated by the Ministry of Petroleum & Natural Gas, 95.21 lakh PNG (Domestic) connections have been provided, and the authorized entities have established 4531 CNG (Transport) stations as of 31 May 2022.
9. What pricing options are available for accessing the report?
Pricing options include single-user, multi-user, and enterprise licenses priced at USD 4750, USD 5250, and USD 8750 respectively.
10. Is the market size provided in terms of value or volume?
The market size is provided in terms of value, measured in Million and volume, measured in K Tons.
11. Are there any specific market keywords associated with the report?
Yes, the market keyword associated with the report is "Asia-Pacific Natural Gas Market," which aids in identifying and referencing the specific market segment covered.
12. How do I determine which pricing option suits my needs best?
The pricing options vary based on user requirements and access needs. Individual users may opt for single-user licenses, while businesses requiring broader access may choose multi-user or enterprise licenses for cost-effective access to the report.
13. Are there any additional resources or data provided in the Asia-Pacific Natural Gas Market report?
While the report offers comprehensive insights, it's advisable to review the specific contents or supplementary materials provided to ascertain if additional resources or data are available.
14. How can I stay updated on further developments or reports in the Asia-Pacific Natural Gas Market?
To stay informed about further developments, trends, and reports in the Asia-Pacific Natural Gas Market, consider subscribing to industry newsletters, following relevant companies and organizations, or regularly checking reputable industry news sources and publications.
Methodology
Step 1 - Identification of Relevant Samples Size from Population Database


Step 2 - Approaches for Defining Global Market Size (Value, Volume* & Price*)

Note*: In applicable scenarios
Step 3 - Data Sources
Primary Research
- Web Analytics
- Survey Reports
- Research Institute
- Latest Research Reports
- Opinion Leaders
Secondary Research
- Annual Reports
- White Paper
- Latest Press Release
- Industry Association
- Paid Database
- Investor Presentations

Step 4 - Data Triangulation
Involves using different sources of information in order to increase the validity of a study
These sources are likely to be stakeholders in a program - participants, other researchers, program staff, other community members, and so on.
Then we put all data in single framework & apply various statistical tools to find out the dynamic on the market.
During the analysis stage, feedback from the stakeholder groups would be compared to determine areas of agreement as well as areas of divergence