

Key Insights
The global Automated Sample Preparation market is poised for significant expansion, projected to reach approximately $1.5 billion in 2025, with an estimated Compound Annual Growth Rate (CAGR) of around 7.5% throughout the forecast period of 2025-2033. This robust growth is primarily fueled by the increasing demand for high-throughput screening and analysis across various industries, including pharmaceuticals, biotechnology, environmental testing, and food & beverage. The inherent need for enhanced accuracy, reduced human error, and faster turnaround times in complex analytical processes, particularly in regulated environments, strongly drives the adoption of automated sample preparation solutions. Furthermore, advancements in robotics, artificial intelligence, and liquid handling technologies are continuously expanding the capabilities and applications of these systems, making them indispensable tools for modern laboratories.
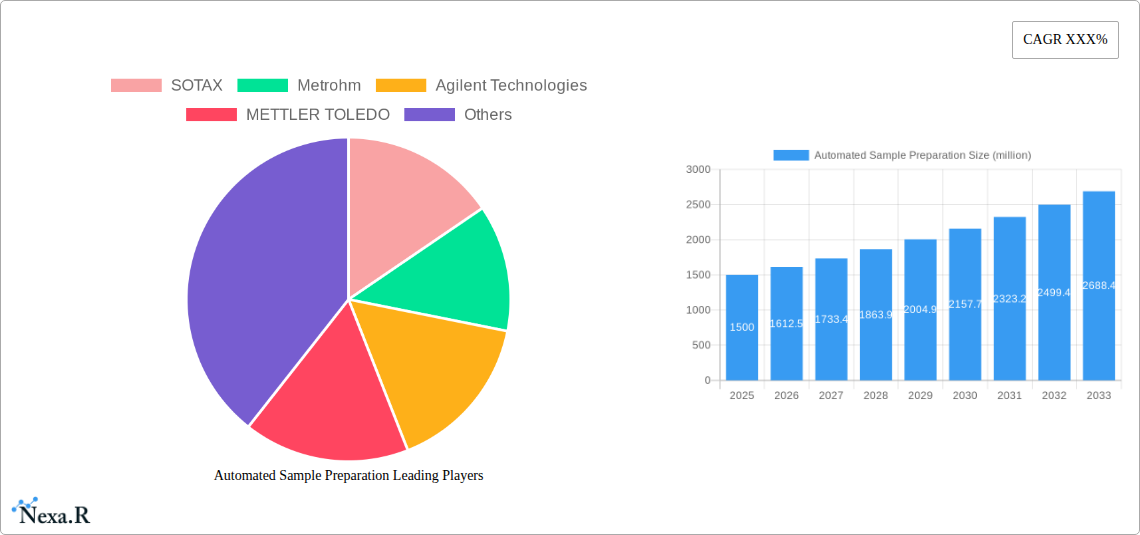
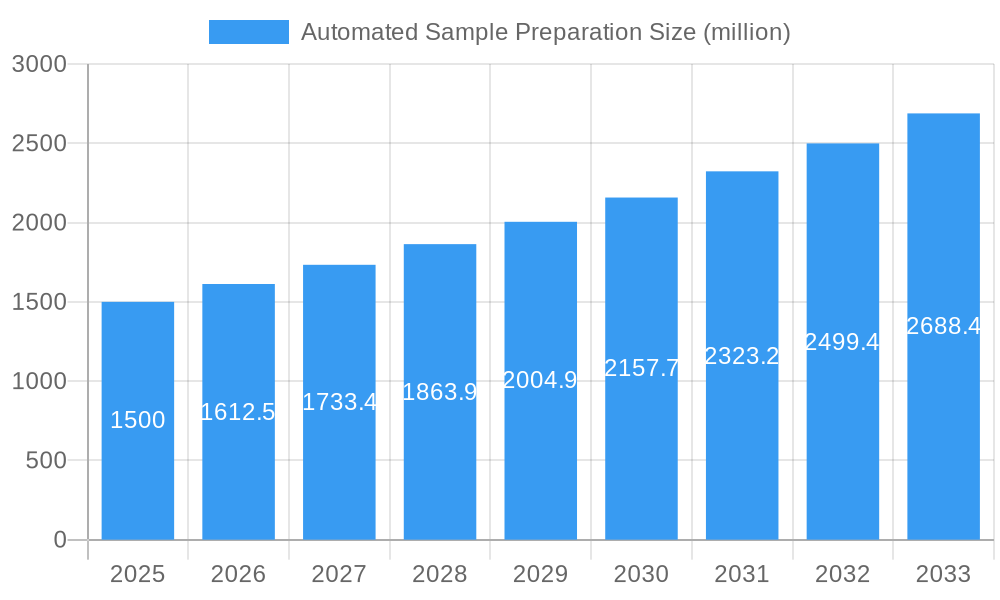
Automated Sample Preparation Market Size (In Billion)
The market is segmented into key applications, with Industry Use, encompassing pharmaceutical and clinical diagnostics, dominating the landscape due to stringent quality control requirements and the massive scale of drug discovery and development. Laboratory Use also represents a substantial segment, driven by academic research and contract research organizations seeking to optimize their analytical workflows. In terms of type, High-Performance Liquid Chromatography (HPLC) and Ultra-High-Performance Liquid Chromatography (UHPLC) remain critical technologies, with automated sample preparation systems designed to seamlessly integrate with these analytical platforms. Key market players such as SOTAX, Metrohm, Agilent Technologies, and METTLER TOLEDO are instrumental in shaping the market through continuous innovation and strategic collaborations, offering a diverse range of solutions to meet evolving customer needs. Geographically, North America and Europe are anticipated to lead the market share, owing to well-established research infrastructure and a high concentration of pharmaceutical and biotech companies. However, the Asia Pacific region is expected to witness the fastest growth, propelled by increasing R&D investments and a burgeoning demand for advanced analytical techniques.
Automated Sample Preparation Company Market Share
Comprehensive Report: Automated Sample Preparation Market Analysis & Future Outlook (2019-2033)
This in-depth report provides a detailed analysis of the global Automated Sample Preparation market, encompassing market dynamics, growth trends, regional dominance, product landscape, key drivers, challenges, emerging opportunities, and future outlook. With a study period spanning from 2019 to 2033, a base year of 2025, and a forecast period of 2025-2033, this report offers critical insights for industry stakeholders. The analysis is segmented by Application (Industry Use, Laboratory Use, Others) and Type (HPLC, UHPLC).
Automated Sample Preparation Market Dynamics & Structure
The global Automated Sample Preparation market exhibits a moderately concentrated structure, with a few key players like SOTAX, Metrohm, Agilent Technologies, and METTLER TOLEDO dominating market share. Technological innovation is a primary driver, fueled by the increasing demand for higher throughput, improved accuracy, and reduced human error in analytical laboratories across pharmaceutical, biotechnology, environmental, and food safety sectors. Regulatory frameworks, such as stringent quality control mandates in the pharmaceutical industry, further propel the adoption of automated solutions. Competitive product substitutes, primarily manual sample preparation methods, are gradually being displaced by the efficiency and reliability of automated systems. End-user demographics are shifting towards research institutions, contract research organizations (CROs), and large-scale manufacturing facilities increasingly recognizing the cost-saving and productivity benefits. Merger and acquisition (M&A) trends are observed as companies seek to expand their product portfolios, technological capabilities, and market reach. For instance, the acquisition of complementary technologies or smaller innovative firms is a recurring theme.
- Market Concentration: Dominated by a few leading players, indicating a mature but evolving competitive landscape.
- Technological Innovation Drivers: Focus on miniaturization, AI integration for method optimization, and cloud-based data management solutions.
- Regulatory Frameworks: Increasing stringency in pharmaceutical and environmental testing drives demand for validated automated processes.
- Competitive Product Substitutes: Manual methods face pressure due to lower throughput and higher error rates.
- End-User Demographics: Growing adoption by pharmaceutical R&D, CROs, and quality control departments.
- M&A Trends: Strategic acquisitions to enhance product offerings and global presence are prevalent.
Automated Sample Preparation Growth Trends & Insights
The Automated Sample Preparation market is poised for robust growth, driven by an increasing global demand for precise and efficient analytical processes across various industries. The market size is projected to expand from an estimated $1,500 million in 2025 to $2,300 million by 2033, exhibiting a Compound Annual Growth Rate (CAGR) of approximately 5.5% during the forecast period. This growth is underpinned by escalating adoption rates of automated solutions, particularly in high-throughput screening (HTS) applications within the pharmaceutical and biotechnology sectors. Technological disruptions, such as the integration of robotics, artificial intelligence (AI) for method development, and advanced liquid handling systems, are revolutionizing sample preparation, leading to improved accuracy and reduced turnaround times.
Consumer behavior shifts are also playing a pivotal role, with a growing emphasis on data integrity, reproducibility, and the need to minimize human error in laboratory settings. This has led to a heightened preference for automated systems that offer validated protocols and standardized workflows. The market penetration of automated sample preparation solutions is expected to rise significantly as more laboratories realize the long-term economic benefits and improved analytical outcomes.
XXX, a leading market research firm, highlights that the increasing complexity of analytical assays, coupled with the need for greater sensitivity and specificity in detecting trace amounts of analytes, is further fueling the demand for advanced automated sample preparation techniques. The pharmaceutical industry, in particular, is a major contributor to this growth, driven by drug discovery and development processes that require rapid and reliable sample handling. Similarly, the environmental monitoring sector is witnessing increased adoption of automated systems to cope with the growing volume of samples and the need for timely analysis of pollutants.
- Market Size Evolution: Projected to reach $2,300 million by 2033 from an estimated $1,500 million in 2025.
- Adoption Rates: Steadily increasing, especially in pharmaceutical and biotechnology research and development.
- Technological Disruptions: Integration of robotics, AI, and advanced liquid handling systems are key.
- Consumer Behavior Shifts: Focus on data integrity, reproducibility, and minimizing human error.
- Market Penetration: Expected to increase as laboratories recognize cost and efficiency benefits.
- Key Industry Drivers: Pharmaceutical R&D, environmental testing, and food safety analysis.
Dominant Regions, Countries, or Segments in Automated Sample Preparation
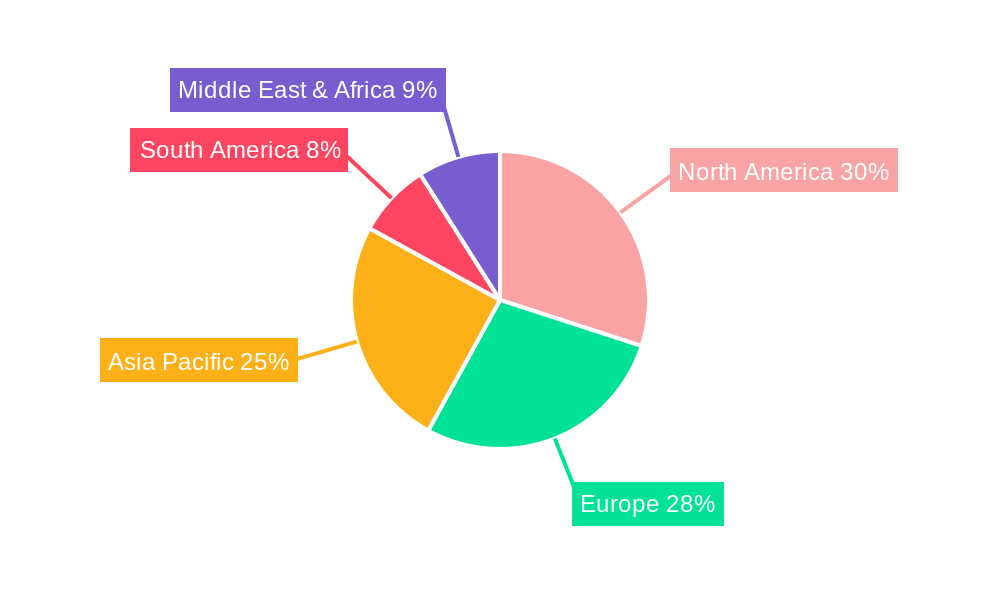
The Laboratory Use segment, particularly within North America and Europe, currently dominates the global Automated Sample Preparation market, driven by a confluence of factors including robust research and development infrastructure, stringent regulatory requirements, and a high concentration of leading pharmaceutical and biotechnology companies. North America, with countries like the United States and Canada, accounts for an estimated 35% of the global market share in 2025, primarily due to its advanced healthcare system, significant investment in life sciences research, and the presence of numerous contract research organizations (CROs) that heavily rely on efficient sample processing.
Europe, closely following with approximately 30% market share in 2025, benefits from strong government funding for scientific research, a well-established pharmaceutical industry, and a proactive approach towards adopting cutting-edge laboratory technologies. The segment's dominance is further amplified by the widespread adoption of HPLC and UHPLC systems, which are critical analytical tools in these regions, necessitating sophisticated automated sample preparation to match their analytical capabilities.
- Dominant Region: North America (estimated 35% market share in 2025), followed by Europe (estimated 30% market share in 2025).
- Dominant Segment: Laboratory Use, encompassing pharmaceutical, biotech, academic research, and clinical laboratories.
- Key Type Segments: HPLC and UHPLC are the primary chromatography techniques driving demand for automated sample preparation.
- Drivers in Dominant Regions:
- Economic Policies: Government initiatives supporting R&D and life sciences innovation.
- Infrastructure: Advanced laboratory facilities and widespread availability of analytical instruments.
- Regulatory Frameworks: Strict quality control and compliance mandates in pharmaceuticals and environmental testing.
- Industry Presence: High concentration of pharmaceutical, biotechnology, and CRO companies.
- Growth Potential: While mature, these regions continue to drive innovation and adoption of next-generation automated sample preparation solutions. Emerging markets in Asia-Pacific are showing rapid growth potential.
Automated Sample Preparation Product Landscape
The Automated Sample Preparation market is characterized by continuous product innovation focused on enhancing efficiency, accuracy, and versatility. Leading companies are introducing compact, modular systems capable of performing a wide range of sample preparation techniques, including solid-phase extraction (SPE), liquid-liquid extraction (LLE), and derivatization, directly integrated with analytical instruments like HPLC and UHPLC. Performance metrics are consistently improving, with advancements in precision liquid handling, reduced sample carryover, and faster processing times, often achieving over 98% accuracy for critical assays. Unique selling propositions revolve around user-friendly software interfaces, intelligent method optimization algorithms, and robust integration capabilities with existing laboratory information management systems (LIMS). Technological advancements include the development of automated unattended operation, minimizing human intervention and increasing laboratory throughput by an estimated 20-30%.
Key Drivers, Barriers & Challenges in Automated Sample Preparation
Key Drivers: The primary forces propelling the Automated Sample Preparation market are the escalating need for high-throughput analysis, the demand for enhanced accuracy and reproducibility in sensitive analytical workflows, and the increasing regulatory scrutiny across industries like pharmaceuticals and environmental testing. Technological advancements, such as miniaturization, automation of complex protocols, and the integration of AI for method optimization, are crucial growth accelerators. Economic factors like the drive for cost reduction through reduced labor and reagent consumption also play a significant role.
- Technological Advancements: Automation of complex workflows and improved precision.
- Regulatory Compliance: Stringent requirements in pharmaceutical and environmental sectors.
- Cost-Effectiveness: Reduced labor and reagent expenses.
- Industry Growth: Expansion of pharmaceutical R&D and diagnostic testing.
Barriers & Challenges: Despite the strong growth trajectory, the market faces challenges such as the high initial capital investment required for automated systems, which can be a barrier for smaller laboratories. The complexity of integrating new automated systems with existing legacy equipment and IT infrastructures can also pose significant hurdles. Furthermore, the need for specialized training for personnel to operate and maintain these sophisticated instruments, alongside concerns about instrument downtime and potential supply chain disruptions for critical consumables and spare parts, present ongoing challenges. The competitive pressure from established manual methods, especially in niche applications where cost is paramount, also remains a restraint.
- High Initial Investment: Significant capital outlay can deter smaller organizations.
- Integration Complexity: Challenges in integrating with existing lab equipment and LIMS.
- Skilled Workforce Requirement: Need for trained personnel for operation and maintenance.
- Supply Chain Vulnerabilities: Potential disruptions affecting consumables and spare parts.
- Competitive Landscape: Persistence of manual methods in certain cost-sensitive applications.
Emerging Opportunities in Automated Sample Preparation
Emerging opportunities in the Automated Sample Preparation market are driven by the expansion of personalized medicine, requiring complex biomarker analysis from small sample volumes. The growth of point-of-care diagnostics and decentralized testing offers a significant avenue for compact, automated sample preparation modules. Furthermore, the increasing adoption of AI and machine learning for predictive sample preparation, optimizing protocols based on historical data and sample characteristics, presents a substantial untapped market. The growing focus on sustainable laboratory practices is also creating opportunities for automation solutions that minimize solvent usage and waste generation, aligning with environmental, social, and governance (ESG) initiatives. The burgeoning field of omics research, including genomics, proteomics, and metabolomics, demands highly reproducible and efficient sample preparation, further fueling demand for advanced automated systems.
Growth Accelerators in the Automated Sample Preparation Industry
Several key catalysts are accelerating the long-term growth of the Automated Sample Preparation industry. These include relentless technological breakthroughs in robotics, sensor technology, and artificial intelligence, enabling more sophisticated and autonomous sample handling. Strategic partnerships between instrument manufacturers and software developers are leading to integrated solutions that streamline workflows from sample introduction to data analysis. Market expansion strategies, particularly targeting emerging economies with rapidly developing pharmaceutical and research sectors, are also significant growth drivers. The increasing outsourcing of research and development activities to CROs further amplifies the demand for efficient and scalable automated sample preparation solutions. The growing emphasis on data integrity and regulatory compliance across industries is a constant push factor, ensuring sustained investment in automated technologies.
Key Players Shaping the Automated Sample Preparation Market
- SOTAX
- Metrohm
- Agilent Technologies
- METTLER TOLEDO
Notable Milestones in Automated Sample Preparation Sector
- 2019: Launch of advanced SPE automation platforms with enhanced throughput capabilities.
- 2020: Increased integration of AI-driven method optimization in sample preparation workflows.
- 2021: Emergence of modular and scalable automated sample preparation systems for diverse applications.
- 2022: Significant advancements in liquid handling precision and reduced carryover in automated systems.
- 2023: Growing adoption of cloud-based solutions for remote monitoring and control of automated sample preparation instruments.
- 2024: Introduction of novel sample preparation techniques automated for complex matrices in environmental analysis.
In-Depth Automated Sample Preparation Market Outlook
The future outlook for the Automated Sample Preparation market is exceptionally promising, driven by an ongoing paradigm shift towards greater laboratory efficiency, accuracy, and data integrity. Growth accelerators such as continuous technological innovation, including the burgeoning integration of AI and machine learning for intelligent method development, alongside strategic collaborations, are poised to redefine sample preparation processes. Market expansion into emerging economies, coupled with the persistent demand from established pharmaceutical and biotechnology sectors, will fuel substantial growth. The increasing need for high-content screening and precision medicine applications will further solidify the market's upward trajectory, presenting lucrative opportunities for companies that can offer versatile, reliable, and cost-effective automated solutions.
Automated Sample Preparation Segmentation
-
1. Application
- 1.1. Industry Use
- 1.2. Laboratory Use
- 1.3. Others
-
2. Type
- 2.1. HPLC
- 2.2. UHPLC
Automated Sample Preparation Segmentation By Geography
-
1. North America
- 1.1. United States
- 1.2. Canada
- 1.3. Mexico
-
2. South America
- 2.1. Brazil
- 2.2. Argentina
- 2.3. Rest of South America
-
3. Europe
- 3.1. United Kingdom
- 3.2. Germany
- 3.3. France
- 3.4. Italy
- 3.5. Spain
- 3.6. Russia
- 3.7. Benelux
- 3.8. Nordics
- 3.9. Rest of Europe
-
4. Middle East & Africa
- 4.1. Turkey
- 4.2. Israel
- 4.3. GCC
- 4.4. North Africa
- 4.5. South Africa
- 4.6. Rest of Middle East & Africa
-
5. Asia Pacific
- 5.1. China
- 5.2. India
- 5.3. Japan
- 5.4. South Korea
- 5.5. ASEAN
- 5.6. Oceania
- 5.7. Rest of Asia Pacific
Automated Sample Preparation Regional Market Share
Geographic Coverage of Automated Sample Preparation
Automated Sample Preparation REPORT HIGHLIGHTS
| Aspects | Details |
|---|---|
| Study Period | 2020-2034 |
| Base Year | 2025 |
| Estimated Year | 2026 |
| Forecast Period | 2026-2034 |
| Historical Period | 2020-2025 |
| Growth Rate | CAGR of XXX% from 2020-2034 |
| Segmentation |
|
Table of Contents
- 1. Introduction
- 1.1. Research Scope
- 1.2. Market Segmentation
- 1.3. Research Methodology
- 1.4. Definitions and Assumptions
- 2. Executive Summary
- 2.1. Introduction
- 3. Market Dynamics
- 3.1. Introduction
- 3.2. Market Drivers
- 3.3. Market Restrains
- 3.4. Market Trends
- 4. Market Factor Analysis
- 4.1. Porters Five Forces
- 4.2. Supply/Value Chain
- 4.3. PESTEL analysis
- 4.4. Market Entropy
- 4.5. Patent/Trademark Analysis
- 5. Global Automated Sample Preparation Analysis, Insights and Forecast, 2020-2032
- 5.1. Market Analysis, Insights and Forecast - by Application
- 5.1.1. Industry Use
- 5.1.2. Laboratory Use
- 5.1.3. Others
- 5.2. Market Analysis, Insights and Forecast - by Type
- 5.2.1. HPLC
- 5.2.2. UHPLC
- 5.3. Market Analysis, Insights and Forecast - by Region
- 5.3.1. North America
- 5.3.2. South America
- 5.3.3. Europe
- 5.3.4. Middle East & Africa
- 5.3.5. Asia Pacific
- 5.1. Market Analysis, Insights and Forecast - by Application
- 6. North America Automated Sample Preparation Analysis, Insights and Forecast, 2020-2032
- 6.1. Market Analysis, Insights and Forecast - by Application
- 6.1.1. Industry Use
- 6.1.2. Laboratory Use
- 6.1.3. Others
- 6.2. Market Analysis, Insights and Forecast - by Type
- 6.2.1. HPLC
- 6.2.2. UHPLC
- 6.1. Market Analysis, Insights and Forecast - by Application
- 7. South America Automated Sample Preparation Analysis, Insights and Forecast, 2020-2032
- 7.1. Market Analysis, Insights and Forecast - by Application
- 7.1.1. Industry Use
- 7.1.2. Laboratory Use
- 7.1.3. Others
- 7.2. Market Analysis, Insights and Forecast - by Type
- 7.2.1. HPLC
- 7.2.2. UHPLC
- 7.1. Market Analysis, Insights and Forecast - by Application
- 8. Europe Automated Sample Preparation Analysis, Insights and Forecast, 2020-2032
- 8.1. Market Analysis, Insights and Forecast - by Application
- 8.1.1. Industry Use
- 8.1.2. Laboratory Use
- 8.1.3. Others
- 8.2. Market Analysis, Insights and Forecast - by Type
- 8.2.1. HPLC
- 8.2.2. UHPLC
- 8.1. Market Analysis, Insights and Forecast - by Application
- 9. Middle East & Africa Automated Sample Preparation Analysis, Insights and Forecast, 2020-2032
- 9.1. Market Analysis, Insights and Forecast - by Application
- 9.1.1. Industry Use
- 9.1.2. Laboratory Use
- 9.1.3. Others
- 9.2. Market Analysis, Insights and Forecast - by Type
- 9.2.1. HPLC
- 9.2.2. UHPLC
- 9.1. Market Analysis, Insights and Forecast - by Application
- 10. Asia Pacific Automated Sample Preparation Analysis, Insights and Forecast, 2020-2032
- 10.1. Market Analysis, Insights and Forecast - by Application
- 10.1.1. Industry Use
- 10.1.2. Laboratory Use
- 10.1.3. Others
- 10.2. Market Analysis, Insights and Forecast - by Type
- 10.2.1. HPLC
- 10.2.2. UHPLC
- 10.1. Market Analysis, Insights and Forecast - by Application
- 11. Competitive Analysis
- 11.1. Global Market Share Analysis 2025
- 11.2. Company Profiles
- 11.2.1 SOTAX
- 11.2.1.1. Overview
- 11.2.1.2. Products
- 11.2.1.3. SWOT Analysis
- 11.2.1.4. Recent Developments
- 11.2.1.5. Financials (Based on Availability)
- 11.2.2 Metrohm
- 11.2.2.1. Overview
- 11.2.2.2. Products
- 11.2.2.3. SWOT Analysis
- 11.2.2.4. Recent Developments
- 11.2.2.5. Financials (Based on Availability)
- 11.2.3 Agilent Technologies
- 11.2.3.1. Overview
- 11.2.3.2. Products
- 11.2.3.3. SWOT Analysis
- 11.2.3.4. Recent Developments
- 11.2.3.5. Financials (Based on Availability)
- 11.2.4 METTLER TOLEDO
- 11.2.4.1. Overview
- 11.2.4.2. Products
- 11.2.4.3. SWOT Analysis
- 11.2.4.4. Recent Developments
- 11.2.4.5. Financials (Based on Availability)
- 11.2.1 SOTAX
List of Figures
- Figure 1: Global Automated Sample Preparation Revenue Breakdown (million, %) by Region 2025 & 2033
- Figure 2: North America Automated Sample Preparation Revenue (million), by Application 2025 & 2033
- Figure 3: North America Automated Sample Preparation Revenue Share (%), by Application 2025 & 2033
- Figure 4: North America Automated Sample Preparation Revenue (million), by Type 2025 & 2033
- Figure 5: North America Automated Sample Preparation Revenue Share (%), by Type 2025 & 2033
- Figure 6: North America Automated Sample Preparation Revenue (million), by Country 2025 & 2033
- Figure 7: North America Automated Sample Preparation Revenue Share (%), by Country 2025 & 2033
- Figure 8: South America Automated Sample Preparation Revenue (million), by Application 2025 & 2033
- Figure 9: South America Automated Sample Preparation Revenue Share (%), by Application 2025 & 2033
- Figure 10: South America Automated Sample Preparation Revenue (million), by Type 2025 & 2033
- Figure 11: South America Automated Sample Preparation Revenue Share (%), by Type 2025 & 2033
- Figure 12: South America Automated Sample Preparation Revenue (million), by Country 2025 & 2033
- Figure 13: South America Automated Sample Preparation Revenue Share (%), by Country 2025 & 2033
- Figure 14: Europe Automated Sample Preparation Revenue (million), by Application 2025 & 2033
- Figure 15: Europe Automated Sample Preparation Revenue Share (%), by Application 2025 & 2033
- Figure 16: Europe Automated Sample Preparation Revenue (million), by Type 2025 & 2033
- Figure 17: Europe Automated Sample Preparation Revenue Share (%), by Type 2025 & 2033
- Figure 18: Europe Automated Sample Preparation Revenue (million), by Country 2025 & 2033
- Figure 19: Europe Automated Sample Preparation Revenue Share (%), by Country 2025 & 2033
- Figure 20: Middle East & Africa Automated Sample Preparation Revenue (million), by Application 2025 & 2033
- Figure 21: Middle East & Africa Automated Sample Preparation Revenue Share (%), by Application 2025 & 2033
- Figure 22: Middle East & Africa Automated Sample Preparation Revenue (million), by Type 2025 & 2033
- Figure 23: Middle East & Africa Automated Sample Preparation Revenue Share (%), by Type 2025 & 2033
- Figure 24: Middle East & Africa Automated Sample Preparation Revenue (million), by Country 2025 & 2033
- Figure 25: Middle East & Africa Automated Sample Preparation Revenue Share (%), by Country 2025 & 2033
- Figure 26: Asia Pacific Automated Sample Preparation Revenue (million), by Application 2025 & 2033
- Figure 27: Asia Pacific Automated Sample Preparation Revenue Share (%), by Application 2025 & 2033
- Figure 28: Asia Pacific Automated Sample Preparation Revenue (million), by Type 2025 & 2033
- Figure 29: Asia Pacific Automated Sample Preparation Revenue Share (%), by Type 2025 & 2033
- Figure 30: Asia Pacific Automated Sample Preparation Revenue (million), by Country 2025 & 2033
- Figure 31: Asia Pacific Automated Sample Preparation Revenue Share (%), by Country 2025 & 2033
List of Tables
- Table 1: Global Automated Sample Preparation Revenue million Forecast, by Application 2020 & 2033
- Table 2: Global Automated Sample Preparation Revenue million Forecast, by Type 2020 & 2033
- Table 3: Global Automated Sample Preparation Revenue million Forecast, by Region 2020 & 2033
- Table 4: Global Automated Sample Preparation Revenue million Forecast, by Application 2020 & 2033
- Table 5: Global Automated Sample Preparation Revenue million Forecast, by Type 2020 & 2033
- Table 6: Global Automated Sample Preparation Revenue million Forecast, by Country 2020 & 2033
- Table 7: United States Automated Sample Preparation Revenue (million) Forecast, by Application 2020 & 2033
- Table 8: Canada Automated Sample Preparation Revenue (million) Forecast, by Application 2020 & 2033
- Table 9: Mexico Automated Sample Preparation Revenue (million) Forecast, by Application 2020 & 2033
- Table 10: Global Automated Sample Preparation Revenue million Forecast, by Application 2020 & 2033
- Table 11: Global Automated Sample Preparation Revenue million Forecast, by Type 2020 & 2033
- Table 12: Global Automated Sample Preparation Revenue million Forecast, by Country 2020 & 2033
- Table 13: Brazil Automated Sample Preparation Revenue (million) Forecast, by Application 2020 & 2033
- Table 14: Argentina Automated Sample Preparation Revenue (million) Forecast, by Application 2020 & 2033
- Table 15: Rest of South America Automated Sample Preparation Revenue (million) Forecast, by Application 2020 & 2033
- Table 16: Global Automated Sample Preparation Revenue million Forecast, by Application 2020 & 2033
- Table 17: Global Automated Sample Preparation Revenue million Forecast, by Type 2020 & 2033
- Table 18: Global Automated Sample Preparation Revenue million Forecast, by Country 2020 & 2033
- Table 19: United Kingdom Automated Sample Preparation Revenue (million) Forecast, by Application 2020 & 2033
- Table 20: Germany Automated Sample Preparation Revenue (million) Forecast, by Application 2020 & 2033
- Table 21: France Automated Sample Preparation Revenue (million) Forecast, by Application 2020 & 2033
- Table 22: Italy Automated Sample Preparation Revenue (million) Forecast, by Application 2020 & 2033
- Table 23: Spain Automated Sample Preparation Revenue (million) Forecast, by Application 2020 & 2033
- Table 24: Russia Automated Sample Preparation Revenue (million) Forecast, by Application 2020 & 2033
- Table 25: Benelux Automated Sample Preparation Revenue (million) Forecast, by Application 2020 & 2033
- Table 26: Nordics Automated Sample Preparation Revenue (million) Forecast, by Application 2020 & 2033
- Table 27: Rest of Europe Automated Sample Preparation Revenue (million) Forecast, by Application 2020 & 2033
- Table 28: Global Automated Sample Preparation Revenue million Forecast, by Application 2020 & 2033
- Table 29: Global Automated Sample Preparation Revenue million Forecast, by Type 2020 & 2033
- Table 30: Global Automated Sample Preparation Revenue million Forecast, by Country 2020 & 2033
- Table 31: Turkey Automated Sample Preparation Revenue (million) Forecast, by Application 2020 & 2033
- Table 32: Israel Automated Sample Preparation Revenue (million) Forecast, by Application 2020 & 2033
- Table 33: GCC Automated Sample Preparation Revenue (million) Forecast, by Application 2020 & 2033
- Table 34: North Africa Automated Sample Preparation Revenue (million) Forecast, by Application 2020 & 2033
- Table 35: South Africa Automated Sample Preparation Revenue (million) Forecast, by Application 2020 & 2033
- Table 36: Rest of Middle East & Africa Automated Sample Preparation Revenue (million) Forecast, by Application 2020 & 2033
- Table 37: Global Automated Sample Preparation Revenue million Forecast, by Application 2020 & 2033
- Table 38: Global Automated Sample Preparation Revenue million Forecast, by Type 2020 & 2033
- Table 39: Global Automated Sample Preparation Revenue million Forecast, by Country 2020 & 2033
- Table 40: China Automated Sample Preparation Revenue (million) Forecast, by Application 2020 & 2033
- Table 41: India Automated Sample Preparation Revenue (million) Forecast, by Application 2020 & 2033
- Table 42: Japan Automated Sample Preparation Revenue (million) Forecast, by Application 2020 & 2033
- Table 43: South Korea Automated Sample Preparation Revenue (million) Forecast, by Application 2020 & 2033
- Table 44: ASEAN Automated Sample Preparation Revenue (million) Forecast, by Application 2020 & 2033
- Table 45: Oceania Automated Sample Preparation Revenue (million) Forecast, by Application 2020 & 2033
- Table 46: Rest of Asia Pacific Automated Sample Preparation Revenue (million) Forecast, by Application 2020 & 2033
Frequently Asked Questions
1. What is the projected Compound Annual Growth Rate (CAGR) of the Automated Sample Preparation?
The projected CAGR is approximately XXX%.
2. Which companies are prominent players in the Automated Sample Preparation?
Key companies in the market include SOTAX, Metrohm, Agilent Technologies, METTLER TOLEDO.
3. What are the main segments of the Automated Sample Preparation?
The market segments include Application, Type.
4. Can you provide details about the market size?
The market size is estimated to be USD XXX million as of 2022.
5. What are some drivers contributing to market growth?
N/A
6. What are the notable trends driving market growth?
N/A
7. Are there any restraints impacting market growth?
N/A
8. Can you provide examples of recent developments in the market?
N/A
9. What pricing options are available for accessing the report?
Pricing options include single-user, multi-user, and enterprise licenses priced at USD 2900.00, USD 4350.00, and USD 5800.00 respectively.
10. Is the market size provided in terms of value or volume?
The market size is provided in terms of value, measured in million.
11. Are there any specific market keywords associated with the report?
Yes, the market keyword associated with the report is "Automated Sample Preparation," which aids in identifying and referencing the specific market segment covered.
12. How do I determine which pricing option suits my needs best?
The pricing options vary based on user requirements and access needs. Individual users may opt for single-user licenses, while businesses requiring broader access may choose multi-user or enterprise licenses for cost-effective access to the report.
13. Are there any additional resources or data provided in the Automated Sample Preparation report?
While the report offers comprehensive insights, it's advisable to review the specific contents or supplementary materials provided to ascertain if additional resources or data are available.
14. How can I stay updated on further developments or reports in the Automated Sample Preparation?
To stay informed about further developments, trends, and reports in the Automated Sample Preparation, consider subscribing to industry newsletters, following relevant companies and organizations, or regularly checking reputable industry news sources and publications.
Methodology
Step 1 - Identification of Relevant Samples Size from Population Database


Step 2 - Approaches for Defining Global Market Size (Value, Volume* & Price*)

Note*: In applicable scenarios
Step 3 - Data Sources
Primary Research
- Web Analytics
- Survey Reports
- Research Institute
- Latest Research Reports
- Opinion Leaders
Secondary Research
- Annual Reports
- White Paper
- Latest Press Release
- Industry Association
- Paid Database
- Investor Presentations

Step 4 - Data Triangulation
Involves using different sources of information in order to increase the validity of a study
These sources are likely to be stakeholders in a program - participants, other researchers, program staff, other community members, and so on.
Then we put all data in single framework & apply various statistical tools to find out the dynamic on the market.
During the analysis stage, feedback from the stakeholder groups would be compared to determine areas of agreement as well as areas of divergence