

Key Insights
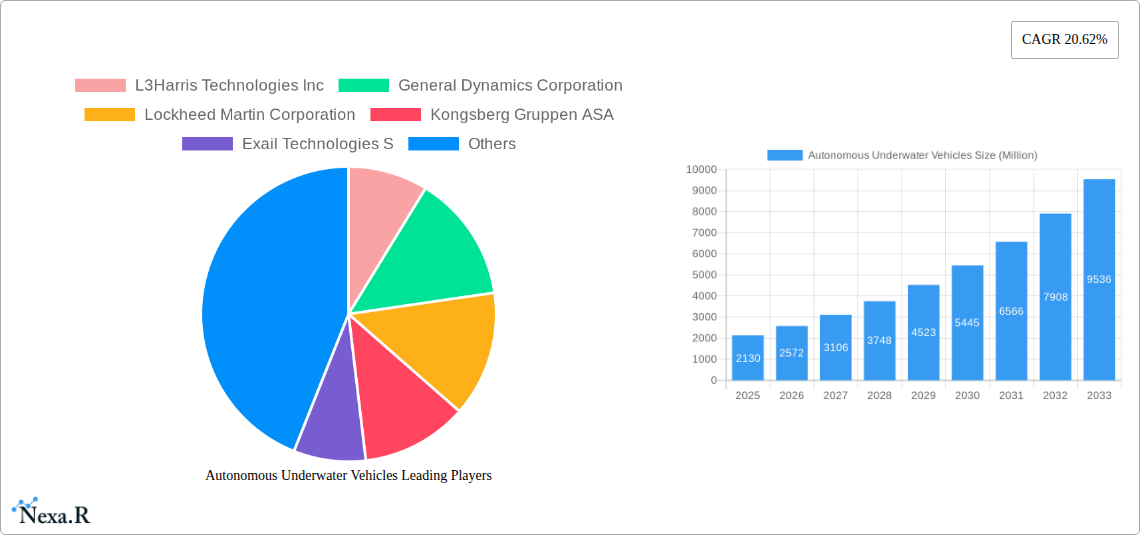
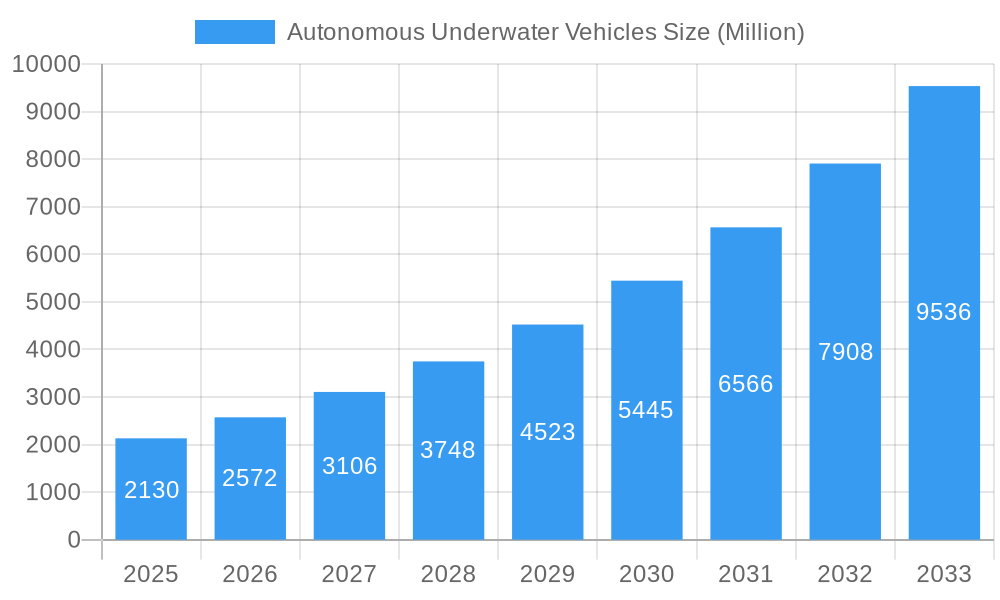
The Autonomous Underwater Vehicle (AUV) market is experiencing robust growth, projected to reach \$2.13 billion in 2025 and exhibiting a Compound Annual Growth Rate (CAGR) of 20.62% from 2025 to 2033. This expansion is fueled by several key drivers. Increasing demand for oceanographic research, spurred by climate change concerns and the need for better understanding of marine ecosystems, is a significant factor. Furthermore, the burgeoning offshore oil and gas industry relies heavily on AUVs for exploration, pipeline inspection, and subsea infrastructure monitoring, contributing substantially to market growth. The military and defense sector also presents a major opportunity, leveraging AUVs for mine countermeasures, surveillance, and anti-submarine warfare. Technological advancements, such as improved sensor technologies, enhanced navigation systems, and longer endurance capabilities, are further accelerating market adoption. The market is segmented by application (military & defense, oil & gas, environmental protection, oceanography, archaeology, search & salvage) and by vehicle size (small, medium, large), with the larger AUVs commanding higher prices but also catering to specialized needs. Competition among established players like L3Harris Technologies, General Dynamics, Lockheed Martin, and Kongsberg Gruppen is intense, driving innovation and price optimization.
Autonomous Underwater Vehicles Market Size (In Billion)
Looking ahead, several trends will shape the AUV market. The integration of Artificial Intelligence (AI) and machine learning capabilities will enhance AUV autonomy and data analysis, enabling more efficient operations and the extraction of valuable insights from collected data. The increasing adoption of unmanned surface vessels (USVs) to support AUV operations will improve overall efficiency and expand operational range. However, challenges remain. High initial investment costs and the need for specialized expertise can hinder broader adoption, particularly in smaller markets. Regulatory hurdles and safety concerns related to autonomous operation also need to be addressed. Despite these restraints, the long-term outlook for the AUV market remains positive, fueled by sustained government funding for research and development, the expanding scope of applications, and continued technological breakthroughs.
Autonomous Underwater Vehicles Company Market Share
Autonomous Underwater Vehicles (AUV) Market Report: 2019-2033
This comprehensive report provides an in-depth analysis of the Autonomous Underwater Vehicles (AUV) market, encompassing market dynamics, growth trends, regional segmentation, product landscape, key players, and future outlook. The study period covers 2019-2033, with 2025 as the base and estimated year. This report is crucial for industry professionals, investors, and researchers seeking a complete understanding of this rapidly evolving sector. The market is segmented by application (Military & Defense, Oil & Gas, Environment Protection & Monitoring, Oceanography, Archaeology & Exploration, Search & Salvage Operations) and by type (Small, Medium, Large).
Autonomous Underwater Vehicles Market Dynamics & Structure
The AUV market is characterized by moderate concentration, with key players such as L3Harris Technologies Inc, General Dynamics Corporation, Lockheed Martin Corporation, and Kongsberg Gruppen ASA holding significant market share. Technological innovation, particularly in areas like AI, sensor technology, and power systems, is a major driver. Stringent regulatory frameworks concerning underwater operations and data security present both challenges and opportunities. Competitive substitutes, such as remotely operated vehicles (ROVs), exist, but AUVs offer advantages in endurance and operational autonomy. The end-user demographics are diverse, spanning military, commercial, and scientific sectors. M&A activity in the AUV sector has been moderate, with xx deals recorded between 2019 and 2024, resulting in a xx% market share shift among leading players.
- Market Concentration: Moderately concentrated, with top 5 players holding approximately xx% of the market share in 2024.
- Technological Innovation: Focus on AI-powered navigation, advanced sensor integration, and extended operational endurance.
- Regulatory Landscape: Strict regulations related to underwater operations, environmental impact, and data security.
- Competitive Landscape: ROVs and other remotely operated systems present competition, but AUVs offer advantages in autonomy and endurance.
- M&A Activity: xx deals recorded between 2019-2024, leading to a xx% shift in market share.
Autonomous Underwater Vehicles Growth Trends & Insights
The global AUV market experienced significant growth during the historical period (2019-2024), expanding from xx million units in 2019 to xx million units in 2024, driven by increasing demand across various applications, particularly in the defense and oil & gas sectors. This translates to a CAGR of xx% during this period. The forecast period (2025-2033) projects continued expansion, reaching xx million units by 2033, at a projected CAGR of xx%. Technological advancements, particularly in autonomy and payload capacity, are fueling adoption across industries. Consumer behavior shifts indicate a preference for improved data accuracy, reliability, and reduced operational costs.
Dominant Regions, Countries, or Segments in Autonomous Underwater Vehicles
The North American region, particularly the United States, currently dominates the AUV market, driven by strong military spending and a robust commercial sector. The Asia-Pacific region is projected to experience the fastest growth due to increasing investments in infrastructure development and exploration activities. Within applications, the military and defense segment holds the largest market share, followed by the oil and gas sector. The large-sized AUV segment dominates the market by type owing to higher payload capacity and longer range capabilities.
- North America: Strong military spending, robust commercial sector, leading market share.
- Asia-Pacific: Fastest growth potential, driven by infrastructure investment and exploration activities.
- Military & Defense: Largest market segment due to high demand for surveillance and reconnaissance.
- Oil & Gas: Significant market share due to the use of AUVs in pipeline inspections and seabed surveys.
- Large AUVs: Dominates the market by type because of high payload and endurance.
Autonomous Underwater Vehicles Product Landscape
AUV product innovations center around enhanced autonomy, improved sensor integration (e.g., sonar, imaging systems), and extended operational endurance through improved battery technology and energy-efficient designs. Key features include advanced navigation systems, modular payloads for diverse applications, and robust communication systems. Unique selling propositions often involve enhanced maneuverability, real-time data processing capabilities, and user-friendly interfaces.
Key Drivers, Barriers & Challenges in Autonomous Underwater Vehicles
Key Drivers:
- Increased demand for underwater exploration and surveillance.
- Technological advancements in AI, sensor technology, and power systems.
- Growing government investments in defense and maritime security.
Challenges:
- High initial investment costs for AUV systems.
- Potential supply chain disruptions affecting critical components.
- Regulatory hurdles and environmental concerns.
- Intense competition among established players and new entrants.
Emerging Opportunities in Autonomous Underwater Vehicles
Emerging opportunities include the expansion into new applications, such as aquaculture monitoring, underwater infrastructure inspection, and scientific research in deep-sea environments. The development of smaller, more affordable AUVs for niche applications also presents a significant market opportunity. Furthermore, advancements in communication technologies and AI offer potential for significant performance improvements.
Growth Accelerators in the Autonomous Underwater Vehicles Industry
Technological breakthroughs, specifically in AI, battery technology, and sensor integration, will continue to propel market growth. Strategic partnerships between technology providers and end-users are also fostering innovation and wider adoption. Government initiatives promoting the development and deployment of AUVs in various sectors are crucial for long-term growth. Market expansion strategies focusing on emerging economies offer further potential.
Key Players Shaping the Autonomous Underwater Vehicles Market
Notable Milestones in Autonomous Underwater Vehicles Sector
- July 2023: L3Harris Technologies Inc. successfully conducted the first fully autonomous launch and recovery of an AUV from an underway submarine using its Iver4 AUV technology. This marked a significant advancement in AUV operational capabilities.
- February 2024: Kongsberg secured a contract from the Defense Innovation Unit (DIU) for the rapid delivery of HUGIN AUV capabilities to the US military, showcasing the increasing demand for AUVs in defense applications.
In-Depth Autonomous Underwater Vehicles Market Outlook
The AUV market is poised for sustained growth, driven by technological advancements and increasing demand across diverse sectors. Strategic partnerships, government initiatives, and expansion into emerging markets will further accelerate market growth. The focus on enhanced autonomy, improved payload capabilities, and cost-effectiveness will shape future market dynamics, creating opportunities for innovation and market leadership.
Autonomous Underwater Vehicles Segmentation
- 1. Production Analysis
- 2. Consumption Analysis
- 3. Import Market Analysis (Value & Volume)
- 4. Export Market Analysis (Value & Volume)
- 5. Price Trend Analysis
Autonomous Underwater Vehicles Segmentation By Geography
-
1. North America
- 1.1. United States
- 1.2. Canada
- 1.3. Mexico
-
2. South America
- 2.1. Brazil
- 2.2. Argentina
- 2.3. Rest of South America
-
3. Europe
- 3.1. United Kingdom
- 3.2. Germany
- 3.3. France
- 3.4. Italy
- 3.5. Spain
- 3.6. Russia
- 3.7. Benelux
- 3.8. Nordics
- 3.9. Rest of Europe
-
4. Middle East & Africa
- 4.1. Turkey
- 4.2. Israel
- 4.3. GCC
- 4.4. North Africa
- 4.5. South Africa
- 4.6. Rest of Middle East & Africa
-
5. Asia Pacific
- 5.1. China
- 5.2. India
- 5.3. Japan
- 5.4. South Korea
- 5.5. ASEAN
- 5.6. Oceania
- 5.7. Rest of Asia Pacific
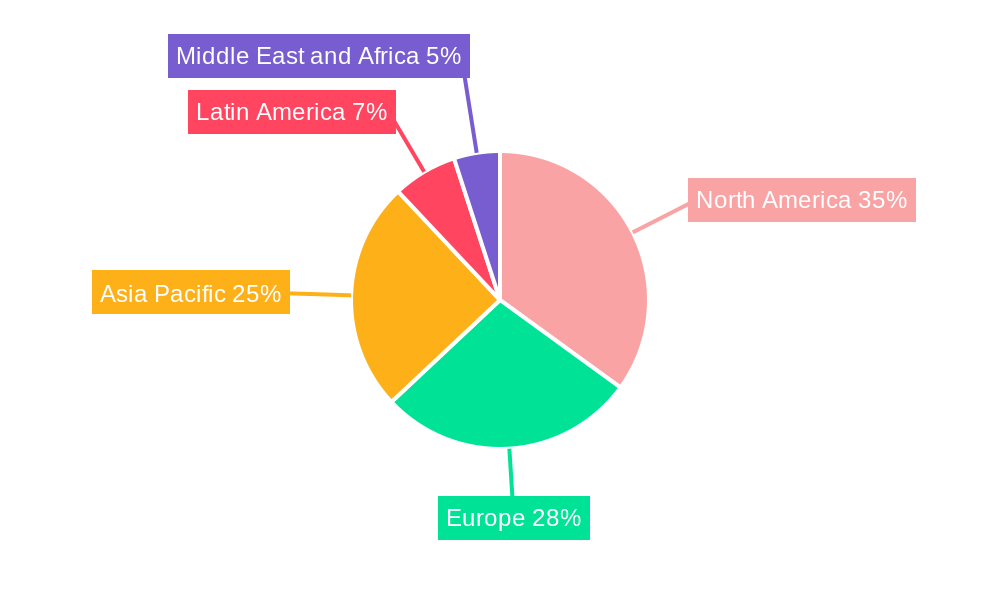
Autonomous Underwater Vehicles Regional Market Share
Geographic Coverage of Autonomous Underwater Vehicles
Autonomous Underwater Vehicles REPORT HIGHLIGHTS
| Aspects | Details |
|---|---|
| Study Period | 2020-2034 |
| Base Year | 2025 |
| Estimated Year | 2026 |
| Forecast Period | 2026-2034 |
| Historical Period | 2020-2025 |
| Growth Rate | CAGR of 20.62% from 2020-2034 |
| Segmentation |
|
Table of Contents
- 1. Introduction
- 1.1. Research Scope
- 1.2. Market Segmentation
- 1.3. Research Objective
- 1.4. Definitions and Assumptions
- 2. Executive Summary
- 2.1. Market Snapshot
- 3. Market Dynamics
- 3.1. Market Drivers
- 3.2. Market Restrains
- 3.3. Market Trends
- 3.4. Market Opportunities
- 4. Market Factor Analysis
- 4.1. Porters Five Forces
- 4.1.1. Bargaining Power of Suppliers
- 4.1.2. Bargaining Power of Buyers
- 4.1.3. Threat of New Entrants
- 4.1.4. Threat of Substitutes
- 4.1.5. Competitive Rivalry
- 4.2. PESTEL analysis
- 4.3. BCG Analysis
- 4.3.1. Stars (High Growth, High Market Share)
- 4.3.2. Cash Cows (Low Growth, High Market Share)
- 4.3.3. Question Mark (High Growth, Low Market Share)
- 4.3.4. Dogs (Low Growth, Low Market Share)
- 4.4. Ansoff Matrix Analysis
- 4.5. Supply Chain Analysis
- 4.6. Regulatory Landscape
- 4.7. Current Market Potential and Opportunity Assessment (TAM–SAM–SOM Framework)
- 4.8. NRP Analyst Note
- 4.1. Porters Five Forces
- 5. Market Analysis, Insights and Forecast 2021-2033
- 5.1. Market Analysis, Insights and Forecast - by Production Analysis
- 5.2. Market Analysis, Insights and Forecast - by Consumption Analysis
- 5.3. Market Analysis, Insights and Forecast - by Import Market Analysis (Value & Volume)
- 5.4. Market Analysis, Insights and Forecast - by Export Market Analysis (Value & Volume)
- 5.5. Market Analysis, Insights and Forecast - by Price Trend Analysis
- 5.6. Market Analysis, Insights and Forecast - by Region
- 5.6.1. North America
- 5.6.2. South America
- 5.6.3. Europe
- 5.6.4. Middle East & Africa
- 5.6.5. Asia Pacific
- 6. Global Autonomous Underwater Vehicles Analysis, Insights and Forecast, 2021-2033
- 6.1. Market Analysis, Insights and Forecast - by Production Analysis
- 6.2. Market Analysis, Insights and Forecast - by Consumption Analysis
- 6.3. Market Analysis, Insights and Forecast - by Import Market Analysis (Value & Volume)
- 6.4. Market Analysis, Insights and Forecast - by Export Market Analysis (Value & Volume)
- 6.5. Market Analysis, Insights and Forecast - by Price Trend Analysis
- 7. North America Autonomous Underwater Vehicles Analysis, Insights and Forecast, 2020-2032
- 7.1. Market Analysis, Insights and Forecast - by Production Analysis
- 7.2. Market Analysis, Insights and Forecast - by Consumption Analysis
- 7.3. Market Analysis, Insights and Forecast - by Import Market Analysis (Value & Volume)
- 7.4. Market Analysis, Insights and Forecast - by Export Market Analysis (Value & Volume)
- 7.5. Market Analysis, Insights and Forecast - by Price Trend Analysis
- 8. South America Autonomous Underwater Vehicles Analysis, Insights and Forecast, 2020-2032
- 8.1. Market Analysis, Insights and Forecast - by Production Analysis
- 8.2. Market Analysis, Insights and Forecast - by Consumption Analysis
- 8.3. Market Analysis, Insights and Forecast - by Import Market Analysis (Value & Volume)
- 8.4. Market Analysis, Insights and Forecast - by Export Market Analysis (Value & Volume)
- 8.5. Market Analysis, Insights and Forecast - by Price Trend Analysis
- 9. Europe Autonomous Underwater Vehicles Analysis, Insights and Forecast, 2020-2032
- 9.1. Market Analysis, Insights and Forecast - by Production Analysis
- 9.2. Market Analysis, Insights and Forecast - by Consumption Analysis
- 9.3. Market Analysis, Insights and Forecast - by Import Market Analysis (Value & Volume)
- 9.4. Market Analysis, Insights and Forecast - by Export Market Analysis (Value & Volume)
- 9.5. Market Analysis, Insights and Forecast - by Price Trend Analysis
- 10. Middle East & Africa Autonomous Underwater Vehicles Analysis, Insights and Forecast, 2020-2032
- 10.1. Market Analysis, Insights and Forecast - by Production Analysis
- 10.2. Market Analysis, Insights and Forecast - by Consumption Analysis
- 10.3. Market Analysis, Insights and Forecast - by Import Market Analysis (Value & Volume)
- 10.4. Market Analysis, Insights and Forecast - by Export Market Analysis (Value & Volume)
- 10.5. Market Analysis, Insights and Forecast - by Price Trend Analysis
- 11. Asia Pacific Autonomous Underwater Vehicles Analysis, Insights and Forecast, 2020-2032
- 11.1. Market Analysis, Insights and Forecast - by Production Analysis
- 11.2. Market Analysis, Insights and Forecast - by Consumption Analysis
- 11.3. Market Analysis, Insights and Forecast - by Import Market Analysis (Value & Volume)
- 11.4. Market Analysis, Insights and Forecast - by Export Market Analysis (Value & Volume)
- 11.5. Market Analysis, Insights and Forecast - by Price Trend Analysis
- 12. Competitive Analysis
- 12.1. Company Profiles
- 12.1.1 L3Harris Technologies Inc
- 12.1.1.1. Company Overview
- 12.1.1.2. Products
- 12.1.1.3. Company Financials
- 12.1.1.4. SWOT Analysis
- 12.1.2 General Dynamics Corporation
- 12.1.2.1. Company Overview
- 12.1.2.2. Products
- 12.1.2.3. Company Financials
- 12.1.2.4. SWOT Analysis
- 12.1.3 Lockheed Martin Corporation
- 12.1.3.1. Company Overview
- 12.1.3.2. Products
- 12.1.3.3. Company Financials
- 12.1.3.4. SWOT Analysis
- 12.1.4 Kongsberg Gruppen ASA
- 12.1.4.1. Company Overview
- 12.1.4.2. Products
- 12.1.4.3. Company Financials
- 12.1.4.4. SWOT Analysis
- 12.1.5 Exail Technologies S
- 12.1.5.1. Company Overview
- 12.1.5.2. Products
- 12.1.5.3. Company Financials
- 12.1.5.4. SWOT Analysis
- 12.1.6 SAAB AB
- 12.1.6.1. Company Overview
- 12.1.6.2. Products
- 12.1.6.3. Company Financials
- 12.1.6.4. SWOT Analysis
- 12.1.7 BAE Systems plc
- 12.1.7.1. Company Overview
- 12.1.7.2. Products
- 12.1.7.3. Company Financials
- 12.1.7.4. SWOT Analysis
- 12.1.8 Teledyne Technologies Inc
- 12.1.8.1. Company Overview
- 12.1.8.2. Products
- 12.1.8.3. Company Financials
- 12.1.8.4. SWOT Analysis
- 12.1.9 The Boeing Company
- 12.1.9.1. Company Overview
- 12.1.9.2. Products
- 12.1.9.3. Company Financials
- 12.1.9.4. SWOT Analysis
- 12.1.1 L3Harris Technologies Inc
- 12.2. Market Entropy
- 12.2.1 Company's Key Areas Served
- 12.2.2 Recent Developments
- 12.3. Company Market Share Analysis 2025
- 12.3.1 Top 5 Companies Market Share Analysis
- 12.3.2 Top 3 Companies Market Share Analysis
- 12.4. List of Potential Customers
- 13. Research Methodology
List of Figures
- Figure 1: Global Autonomous Underwater Vehicles Revenue Breakdown (billion, %) by Region 2025 & 2033
- Figure 2: North America Autonomous Underwater Vehicles Revenue (billion), by Production Analysis 2025 & 2033
- Figure 3: North America Autonomous Underwater Vehicles Revenue Share (%), by Production Analysis 2025 & 2033
- Figure 4: North America Autonomous Underwater Vehicles Revenue (billion), by Consumption Analysis 2025 & 2033
- Figure 5: North America Autonomous Underwater Vehicles Revenue Share (%), by Consumption Analysis 2025 & 2033
- Figure 6: North America Autonomous Underwater Vehicles Revenue (billion), by Import Market Analysis (Value & Volume) 2025 & 2033
- Figure 7: North America Autonomous Underwater Vehicles Revenue Share (%), by Import Market Analysis (Value & Volume) 2025 & 2033
- Figure 8: North America Autonomous Underwater Vehicles Revenue (billion), by Export Market Analysis (Value & Volume) 2025 & 2033
- Figure 9: North America Autonomous Underwater Vehicles Revenue Share (%), by Export Market Analysis (Value & Volume) 2025 & 2033
- Figure 10: North America Autonomous Underwater Vehicles Revenue (billion), by Price Trend Analysis 2025 & 2033
- Figure 11: North America Autonomous Underwater Vehicles Revenue Share (%), by Price Trend Analysis 2025 & 2033
- Figure 12: North America Autonomous Underwater Vehicles Revenue (billion), by Country 2025 & 2033
- Figure 13: North America Autonomous Underwater Vehicles Revenue Share (%), by Country 2025 & 2033
- Figure 14: South America Autonomous Underwater Vehicles Revenue (billion), by Production Analysis 2025 & 2033
- Figure 15: South America Autonomous Underwater Vehicles Revenue Share (%), by Production Analysis 2025 & 2033
- Figure 16: South America Autonomous Underwater Vehicles Revenue (billion), by Consumption Analysis 2025 & 2033
- Figure 17: South America Autonomous Underwater Vehicles Revenue Share (%), by Consumption Analysis 2025 & 2033
- Figure 18: South America Autonomous Underwater Vehicles Revenue (billion), by Import Market Analysis (Value & Volume) 2025 & 2033
- Figure 19: South America Autonomous Underwater Vehicles Revenue Share (%), by Import Market Analysis (Value & Volume) 2025 & 2033
- Figure 20: South America Autonomous Underwater Vehicles Revenue (billion), by Export Market Analysis (Value & Volume) 2025 & 2033
- Figure 21: South America Autonomous Underwater Vehicles Revenue Share (%), by Export Market Analysis (Value & Volume) 2025 & 2033
- Figure 22: South America Autonomous Underwater Vehicles Revenue (billion), by Price Trend Analysis 2025 & 2033
- Figure 23: South America Autonomous Underwater Vehicles Revenue Share (%), by Price Trend Analysis 2025 & 2033
- Figure 24: South America Autonomous Underwater Vehicles Revenue (billion), by Country 2025 & 2033
- Figure 25: South America Autonomous Underwater Vehicles Revenue Share (%), by Country 2025 & 2033
- Figure 26: Europe Autonomous Underwater Vehicles Revenue (billion), by Production Analysis 2025 & 2033
- Figure 27: Europe Autonomous Underwater Vehicles Revenue Share (%), by Production Analysis 2025 & 2033
- Figure 28: Europe Autonomous Underwater Vehicles Revenue (billion), by Consumption Analysis 2025 & 2033
- Figure 29: Europe Autonomous Underwater Vehicles Revenue Share (%), by Consumption Analysis 2025 & 2033
- Figure 30: Europe Autonomous Underwater Vehicles Revenue (billion), by Import Market Analysis (Value & Volume) 2025 & 2033
- Figure 31: Europe Autonomous Underwater Vehicles Revenue Share (%), by Import Market Analysis (Value & Volume) 2025 & 2033
- Figure 32: Europe Autonomous Underwater Vehicles Revenue (billion), by Export Market Analysis (Value & Volume) 2025 & 2033
- Figure 33: Europe Autonomous Underwater Vehicles Revenue Share (%), by Export Market Analysis (Value & Volume) 2025 & 2033
- Figure 34: Europe Autonomous Underwater Vehicles Revenue (billion), by Price Trend Analysis 2025 & 2033
- Figure 35: Europe Autonomous Underwater Vehicles Revenue Share (%), by Price Trend Analysis 2025 & 2033
- Figure 36: Europe Autonomous Underwater Vehicles Revenue (billion), by Country 2025 & 2033
- Figure 37: Europe Autonomous Underwater Vehicles Revenue Share (%), by Country 2025 & 2033
- Figure 38: Middle East & Africa Autonomous Underwater Vehicles Revenue (billion), by Production Analysis 2025 & 2033
- Figure 39: Middle East & Africa Autonomous Underwater Vehicles Revenue Share (%), by Production Analysis 2025 & 2033
- Figure 40: Middle East & Africa Autonomous Underwater Vehicles Revenue (billion), by Consumption Analysis 2025 & 2033
- Figure 41: Middle East & Africa Autonomous Underwater Vehicles Revenue Share (%), by Consumption Analysis 2025 & 2033
- Figure 42: Middle East & Africa Autonomous Underwater Vehicles Revenue (billion), by Import Market Analysis (Value & Volume) 2025 & 2033
- Figure 43: Middle East & Africa Autonomous Underwater Vehicles Revenue Share (%), by Import Market Analysis (Value & Volume) 2025 & 2033
- Figure 44: Middle East & Africa Autonomous Underwater Vehicles Revenue (billion), by Export Market Analysis (Value & Volume) 2025 & 2033
- Figure 45: Middle East & Africa Autonomous Underwater Vehicles Revenue Share (%), by Export Market Analysis (Value & Volume) 2025 & 2033
- Figure 46: Middle East & Africa Autonomous Underwater Vehicles Revenue (billion), by Price Trend Analysis 2025 & 2033
- Figure 47: Middle East & Africa Autonomous Underwater Vehicles Revenue Share (%), by Price Trend Analysis 2025 & 2033
- Figure 48: Middle East & Africa Autonomous Underwater Vehicles Revenue (billion), by Country 2025 & 2033
- Figure 49: Middle East & Africa Autonomous Underwater Vehicles Revenue Share (%), by Country 2025 & 2033
- Figure 50: Asia Pacific Autonomous Underwater Vehicles Revenue (billion), by Production Analysis 2025 & 2033
- Figure 51: Asia Pacific Autonomous Underwater Vehicles Revenue Share (%), by Production Analysis 2025 & 2033
- Figure 52: Asia Pacific Autonomous Underwater Vehicles Revenue (billion), by Consumption Analysis 2025 & 2033
- Figure 53: Asia Pacific Autonomous Underwater Vehicles Revenue Share (%), by Consumption Analysis 2025 & 2033
- Figure 54: Asia Pacific Autonomous Underwater Vehicles Revenue (billion), by Import Market Analysis (Value & Volume) 2025 & 2033
- Figure 55: Asia Pacific Autonomous Underwater Vehicles Revenue Share (%), by Import Market Analysis (Value & Volume) 2025 & 2033
- Figure 56: Asia Pacific Autonomous Underwater Vehicles Revenue (billion), by Export Market Analysis (Value & Volume) 2025 & 2033
- Figure 57: Asia Pacific Autonomous Underwater Vehicles Revenue Share (%), by Export Market Analysis (Value & Volume) 2025 & 2033
- Figure 58: Asia Pacific Autonomous Underwater Vehicles Revenue (billion), by Price Trend Analysis 2025 & 2033
- Figure 59: Asia Pacific Autonomous Underwater Vehicles Revenue Share (%), by Price Trend Analysis 2025 & 2033
- Figure 60: Asia Pacific Autonomous Underwater Vehicles Revenue (billion), by Country 2025 & 2033
- Figure 61: Asia Pacific Autonomous Underwater Vehicles Revenue Share (%), by Country 2025 & 2033
List of Tables
- Table 1: Global Autonomous Underwater Vehicles Revenue billion Forecast, by Production Analysis 2020 & 2033
- Table 2: Global Autonomous Underwater Vehicles Revenue billion Forecast, by Consumption Analysis 2020 & 2033
- Table 3: Global Autonomous Underwater Vehicles Revenue billion Forecast, by Import Market Analysis (Value & Volume) 2020 & 2033
- Table 4: Global Autonomous Underwater Vehicles Revenue billion Forecast, by Export Market Analysis (Value & Volume) 2020 & 2033
- Table 5: Global Autonomous Underwater Vehicles Revenue billion Forecast, by Price Trend Analysis 2020 & 2033
- Table 6: Global Autonomous Underwater Vehicles Revenue billion Forecast, by Region 2020 & 2033
- Table 7: Global Autonomous Underwater Vehicles Revenue billion Forecast, by Production Analysis 2020 & 2033
- Table 8: Global Autonomous Underwater Vehicles Revenue billion Forecast, by Consumption Analysis 2020 & 2033
- Table 9: Global Autonomous Underwater Vehicles Revenue billion Forecast, by Import Market Analysis (Value & Volume) 2020 & 2033
- Table 10: Global Autonomous Underwater Vehicles Revenue billion Forecast, by Export Market Analysis (Value & Volume) 2020 & 2033
- Table 11: Global Autonomous Underwater Vehicles Revenue billion Forecast, by Price Trend Analysis 2020 & 2033
- Table 12: Global Autonomous Underwater Vehicles Revenue billion Forecast, by Country 2020 & 2033
- Table 13: United States Autonomous Underwater Vehicles Revenue (billion) Forecast, by Application 2020 & 2033
- Table 14: Canada Autonomous Underwater Vehicles Revenue (billion) Forecast, by Application 2020 & 2033
- Table 15: Mexico Autonomous Underwater Vehicles Revenue (billion) Forecast, by Application 2020 & 2033
- Table 16: Global Autonomous Underwater Vehicles Revenue billion Forecast, by Production Analysis 2020 & 2033
- Table 17: Global Autonomous Underwater Vehicles Revenue billion Forecast, by Consumption Analysis 2020 & 2033
- Table 18: Global Autonomous Underwater Vehicles Revenue billion Forecast, by Import Market Analysis (Value & Volume) 2020 & 2033
- Table 19: Global Autonomous Underwater Vehicles Revenue billion Forecast, by Export Market Analysis (Value & Volume) 2020 & 2033
- Table 20: Global Autonomous Underwater Vehicles Revenue billion Forecast, by Price Trend Analysis 2020 & 2033
- Table 21: Global Autonomous Underwater Vehicles Revenue billion Forecast, by Country 2020 & 2033
- Table 22: Brazil Autonomous Underwater Vehicles Revenue (billion) Forecast, by Application 2020 & 2033
- Table 23: Argentina Autonomous Underwater Vehicles Revenue (billion) Forecast, by Application 2020 & 2033
- Table 24: Rest of South America Autonomous Underwater Vehicles Revenue (billion) Forecast, by Application 2020 & 2033
- Table 25: Global Autonomous Underwater Vehicles Revenue billion Forecast, by Production Analysis 2020 & 2033
- Table 26: Global Autonomous Underwater Vehicles Revenue billion Forecast, by Consumption Analysis 2020 & 2033
- Table 27: Global Autonomous Underwater Vehicles Revenue billion Forecast, by Import Market Analysis (Value & Volume) 2020 & 2033
- Table 28: Global Autonomous Underwater Vehicles Revenue billion Forecast, by Export Market Analysis (Value & Volume) 2020 & 2033
- Table 29: Global Autonomous Underwater Vehicles Revenue billion Forecast, by Price Trend Analysis 2020 & 2033
- Table 30: Global Autonomous Underwater Vehicles Revenue billion Forecast, by Country 2020 & 2033
- Table 31: United Kingdom Autonomous Underwater Vehicles Revenue (billion) Forecast, by Application 2020 & 2033
- Table 32: Germany Autonomous Underwater Vehicles Revenue (billion) Forecast, by Application 2020 & 2033
- Table 33: France Autonomous Underwater Vehicles Revenue (billion) Forecast, by Application 2020 & 2033
- Table 34: Italy Autonomous Underwater Vehicles Revenue (billion) Forecast, by Application 2020 & 2033
- Table 35: Spain Autonomous Underwater Vehicles Revenue (billion) Forecast, by Application 2020 & 2033
- Table 36: Russia Autonomous Underwater Vehicles Revenue (billion) Forecast, by Application 2020 & 2033
- Table 37: Benelux Autonomous Underwater Vehicles Revenue (billion) Forecast, by Application 2020 & 2033
- Table 38: Nordics Autonomous Underwater Vehicles Revenue (billion) Forecast, by Application 2020 & 2033
- Table 39: Rest of Europe Autonomous Underwater Vehicles Revenue (billion) Forecast, by Application 2020 & 2033
- Table 40: Global Autonomous Underwater Vehicles Revenue billion Forecast, by Production Analysis 2020 & 2033
- Table 41: Global Autonomous Underwater Vehicles Revenue billion Forecast, by Consumption Analysis 2020 & 2033
- Table 42: Global Autonomous Underwater Vehicles Revenue billion Forecast, by Import Market Analysis (Value & Volume) 2020 & 2033
- Table 43: Global Autonomous Underwater Vehicles Revenue billion Forecast, by Export Market Analysis (Value & Volume) 2020 & 2033
- Table 44: Global Autonomous Underwater Vehicles Revenue billion Forecast, by Price Trend Analysis 2020 & 2033
- Table 45: Global Autonomous Underwater Vehicles Revenue billion Forecast, by Country 2020 & 2033
- Table 46: Turkey Autonomous Underwater Vehicles Revenue (billion) Forecast, by Application 2020 & 2033
- Table 47: Israel Autonomous Underwater Vehicles Revenue (billion) Forecast, by Application 2020 & 2033
- Table 48: GCC Autonomous Underwater Vehicles Revenue (billion) Forecast, by Application 2020 & 2033
- Table 49: North Africa Autonomous Underwater Vehicles Revenue (billion) Forecast, by Application 2020 & 2033
- Table 50: South Africa Autonomous Underwater Vehicles Revenue (billion) Forecast, by Application 2020 & 2033
- Table 51: Rest of Middle East & Africa Autonomous Underwater Vehicles Revenue (billion) Forecast, by Application 2020 & 2033
- Table 52: Global Autonomous Underwater Vehicles Revenue billion Forecast, by Production Analysis 2020 & 2033
- Table 53: Global Autonomous Underwater Vehicles Revenue billion Forecast, by Consumption Analysis 2020 & 2033
- Table 54: Global Autonomous Underwater Vehicles Revenue billion Forecast, by Import Market Analysis (Value & Volume) 2020 & 2033
- Table 55: Global Autonomous Underwater Vehicles Revenue billion Forecast, by Export Market Analysis (Value & Volume) 2020 & 2033
- Table 56: Global Autonomous Underwater Vehicles Revenue billion Forecast, by Price Trend Analysis 2020 & 2033
- Table 57: Global Autonomous Underwater Vehicles Revenue billion Forecast, by Country 2020 & 2033
- Table 58: China Autonomous Underwater Vehicles Revenue (billion) Forecast, by Application 2020 & 2033
- Table 59: India Autonomous Underwater Vehicles Revenue (billion) Forecast, by Application 2020 & 2033
- Table 60: Japan Autonomous Underwater Vehicles Revenue (billion) Forecast, by Application 2020 & 2033
- Table 61: South Korea Autonomous Underwater Vehicles Revenue (billion) Forecast, by Application 2020 & 2033
- Table 62: ASEAN Autonomous Underwater Vehicles Revenue (billion) Forecast, by Application 2020 & 2033
- Table 63: Oceania Autonomous Underwater Vehicles Revenue (billion) Forecast, by Application 2020 & 2033
- Table 64: Rest of Asia Pacific Autonomous Underwater Vehicles Revenue (billion) Forecast, by Application 2020 & 2033
Frequently Asked Questions
1. What is the projected Compound Annual Growth Rate (CAGR) of the Autonomous Underwater Vehicles?
The projected CAGR is approximately 20.62%.
2. Which companies are prominent players in the Autonomous Underwater Vehicles?
Key companies in the market include L3Harris Technologies Inc, General Dynamics Corporation, Lockheed Martin Corporation, Kongsberg Gruppen ASA, Exail Technologies S, SAAB AB, BAE Systems plc, Teledyne Technologies Inc, The Boeing Company.
3. What are the main segments of the Autonomous Underwater Vehicles?
The market segments include Production Analysis, Consumption Analysis, Import Market Analysis (Value & Volume), Export Market Analysis (Value & Volume), Price Trend Analysis.
4. Can you provide details about the market size?
The market size is estimated to be USD 2.57 billion as of 2022.
5. What are some drivers contributing to market growth?
Increase in Internet of Things (IoT) and Autonomous Systems; Rise in Demand for Military and Defense Satellite Communication Solutions.
6. What are the notable trends driving market growth?
Military & Defense will a Hold Significant Market Share.
7. Are there any restraints impacting market growth?
Cybersecurity Threats to Satellite Communication; Interference in Transmission of Data.
8. Can you provide examples of recent developments in the market?
February 2024: Kongsberg was awarded a contract with the Defense Innovation Unit (DIU) to rapidly deliver HUGIN Autonomous Underwater Vehicle (AUV) capabilities for the US military.
9. What pricing options are available for accessing the report?
Pricing options include single-user, multi-user, and enterprise licenses priced at USD 4750, USD 5250, and USD 8750 respectively.
10. Is the market size provided in terms of value or volume?
The market size is provided in terms of value, measured in billion.
11. Are there any specific market keywords associated with the report?
Yes, the market keyword associated with the report is "Autonomous Underwater Vehicles," which aids in identifying and referencing the specific market segment covered.
12. How do I determine which pricing option suits my needs best?
The pricing options vary based on user requirements and access needs. Individual users may opt for single-user licenses, while businesses requiring broader access may choose multi-user or enterprise licenses for cost-effective access to the report.
13. Are there any additional resources or data provided in the Autonomous Underwater Vehicles report?
While the report offers comprehensive insights, it's advisable to review the specific contents or supplementary materials provided to ascertain if additional resources or data are available.
14. How can I stay updated on further developments or reports in the Autonomous Underwater Vehicles?
To stay informed about further developments, trends, and reports in the Autonomous Underwater Vehicles, consider subscribing to industry newsletters, following relevant companies and organizations, or regularly checking reputable industry news sources and publications.
Methodology
Step 1 - Identification of Relevant Samples Size from Population Database


Step 2 - Approaches for Defining Global Market Size (Value, Volume* & Price*)

Note*: In applicable scenarios
Step 3 - Data Sources
Primary Research
- Web Analytics
- Survey Reports
- Research Institute
- Latest Research Reports
- Opinion Leaders
Secondary Research
- Annual Reports
- White Paper
- Latest Press Release
- Industry Association
- Paid Database
- Investor Presentations

Step 4 - Data Triangulation
Involves using different sources of information in order to increase the validity of a study
These sources are likely to be stakeholders in a program - participants, other researchers, program staff, other community members, and so on.
Then we put all data in single framework & apply various statistical tools to find out the dynamic on the market.
During the analysis stage, feedback from the stakeholder groups would be compared to determine areas of agreement as well as areas of divergence