

Key Insights
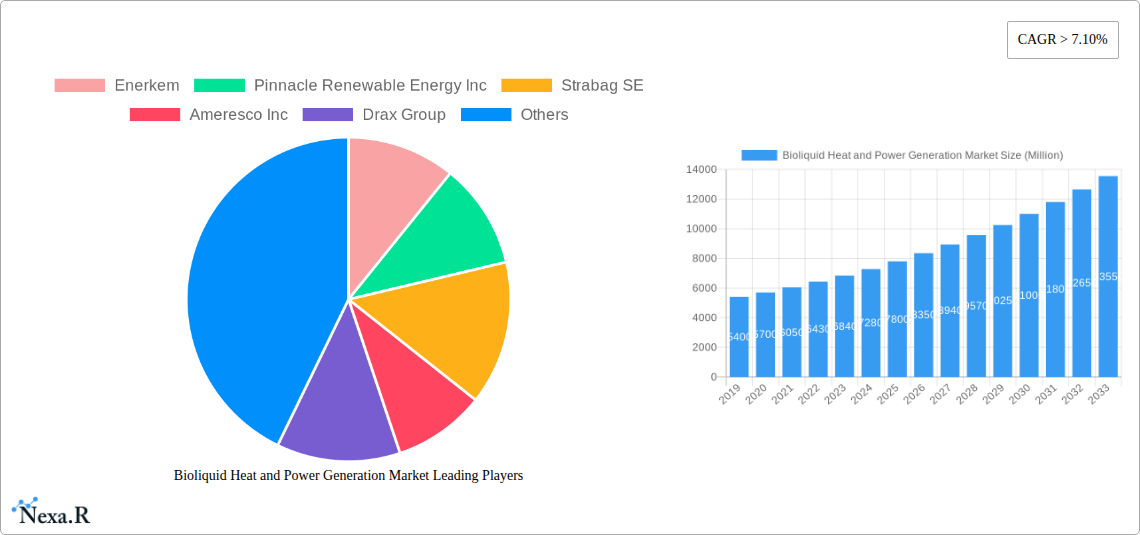
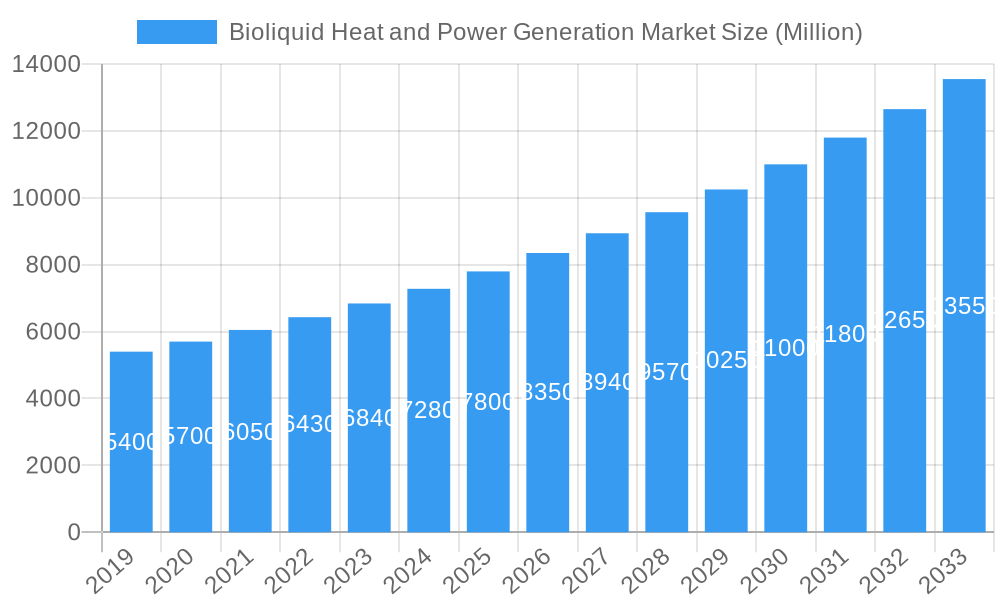
The Bioliquid Heat and Power Generation Market is poised for significant expansion, projected to reach a market size of approximately $7,800 million by 2025, with a robust CAGR exceeding 7.10% throughout the forecast period extending to 2033. This substantial growth is propelled by an increasing global demand for sustainable energy solutions and a concerted effort by governments and industries to decarbonize their operations. Key drivers include supportive government policies, such as renewable energy mandates and tax incentives, coupled with rising environmental consciousness among consumers and corporations. The market's expansion is further fueled by advancements in bioliquid production technologies, making them more efficient and cost-effective. The growing availability of diverse feedstocks, ranging from agricultural waste to dedicated energy crops, also plays a crucial role in underpinning this upward trajectory. Companies are actively investing in research and development to optimize conversion processes and enhance the performance of bioliquids in heat and power generation applications. This burgeoning market presents a significant opportunity for stakeholders seeking to contribute to a greener energy future while capitalizing on substantial economic gains.
Bioliquid Heat and Power Generation Market Market Size (In Billion)
The market segmentation reveals a dynamic landscape with distinct growth opportunities across various fuel types and technologies. Bio-ethanol and biodiesel are expected to dominate the fuel type segment due to their established production infrastructure and widespread adoption. However, emerging "Other" bioliquids, derived from novel feedstocks and advanced conversion processes, are anticipated to witness rapid growth as innovation continues. In terms of technology, the "Engine" segment is likely to lead, benefiting from the extensive existing infrastructure for internal combustion engines that can be adapted for bioliquid fuels. Nevertheless, the "Turbine" and "Other" technology segments are also projected to experience considerable growth as cleaner and more efficient power generation solutions gain traction. Geographically, North America and Europe are expected to be the leading markets, driven by strong regulatory frameworks, substantial investments in renewable energy, and a well-established industrial base. Asia Pacific is emerging as a high-growth region, fueled by its increasing energy demands and a growing focus on sustainable alternatives. Leading companies such as Enerkem, Pinnacle Renewable Energy Inc., Strabag SE, Ameresco Inc., Drax Group, Enviva Inc., Green Plains Inc., Archer-Daniels-Midland Co., Envitec Biogas AG, and Albioma SA are actively shaping the market through their innovative solutions and strategic expansions.
Bioliquid Heat and Power Generation Market Company Market Share
Bioliquid Heat and Power Generation Market: Comprehensive Analysis and Future Outlook (2019-2033)
This in-depth report provides a comprehensive analysis of the global Bioliquid Heat and Power Generation Market. Covering the study period from 2019 to 2033, with a base year of 2025 and a forecast period of 2025–2033, this report is essential for stakeholders seeking to understand market dynamics, growth trends, and future opportunities in the renewable energy sector. We delve into key segments like Bio-ethanol, Biodiesel, and others, examining dominant technologies such as Engines and Turbines. Gain critical insights into renewable energy generation, biofuel market trends, and the burgeoning bioliquid market, crucial for strategic decision-making.
Bioliquid Heat and Power Generation Market Dynamics & Structure
The Bioliquid Heat and Power Generation Market exhibits a moderately concentrated structure, characterized by the presence of established players and emerging innovators. Technological innovation is a primary driver, fueled by advancements in bioliquid conversion technologies and engine efficiency. Regulatory frameworks, including government incentives for renewable energy and biofuel production, play a pivotal role in shaping market growth. Competitive product substitutes, such as fossil fuels and other renewable energy sources, necessitate continuous innovation and cost-competitiveness within the bioliquid sector. End-user demographics are shifting towards environmentally conscious consumers and industries seeking sustainable energy solutions. Mergers and acquisitions (M&A) trends, with an estimated X million units in deal volume during the historical period, indicate a consolidation phase and strategic expansion by key players aiming to enhance their market share and technological capabilities. Key innovation barriers include the high initial capital investment for infrastructure and the fluctuating feedstock availability.
- Market Concentration: Moderate, with a mix of large corporations and specialized companies.
- Technological Innovation Drivers: R&D in advanced bioliquid conversion, engine efficiency, and feedstock sustainability.
- Regulatory Frameworks: Government incentives, tax credits for renewable energy, and emission standards.
- Competitive Product Substitutes: Fossil fuels, solar power, wind power.
- End-User Demographics: Residential, commercial, and industrial sectors with a growing focus on sustainability.
- M&A Trends: Strategic acquisitions to gain market share, access new technologies, and expand geographical reach.
Bioliquid Heat and Power Generation Market Growth Trends & Insights
The Bioliquid Heat and Power Generation Market is projected to experience robust growth, driven by an increasing global demand for sustainable energy solutions and favorable governmental policies. The market size evolution indicates a steady upward trajectory, with estimated market size of $XX billion in 2025, expanding to an estimated market size of $YY billion by 2033. Adoption rates for bioliquids in heat and power generation are accelerating, particularly in regions with strong renewable energy mandates and abundant biomass resources. Technological disruptions, such as the development of more efficient bioliquid production technologies and advanced engine designs, are enhancing the viability and attractiveness of these energy sources. Consumer behavior shifts are also playing a significant role, with an increasing preference for cleaner energy alternatives and a growing awareness of the environmental impact of traditional fuels. These factors collectively contribute to a CAGR of X.X% during the forecast period, signifying substantial market penetration. The increasing integration of bioliquid-based power generation in existing energy grids is a testament to its growing acceptance and scalability. Furthermore, the development of advanced biofuels and the optimization of supply chains for biomass feedstocks are expected to further fuel market expansion.
Dominant Regions, Countries, or Segments in Bioliquid Heat and Power Generation Market
The Bioliquid Heat and Power Generation Market is witnessing significant growth across various regions and segments. North America, particularly the United States, stands out as a dominant region due to substantial government support, including tax credits for renewable energy production. Europe also plays a crucial role, driven by stringent environmental regulations and a strong commitment to renewable energy targets. Asia-Pacific is emerging as a key growth area, fueled by increasing energy demand and government initiatives to promote sustainable energy sources.
Within the Fuel Type segment, Biodiesel currently holds a dominant position, driven by its widespread application in transportation and its established production infrastructure. However, Bio-ethanol is experiencing considerable growth, particularly for use in blending with gasoline and in dedicated power generation facilities. The "Others" category, encompassing various advanced bioliquids and waste-derived fuels, is poised for significant expansion due to ongoing research and development.
In terms of Technology, the Engine segment leads the market, owing to the established infrastructure for internal combustion engines and their adaptability for bioliquid fuels. The Turbine segment is also gaining traction, especially for larger-scale power generation applications, with advancements in turbine design enhancing efficiency and fuel flexibility. The "Others" technology category encompasses emerging solutions like fuel cells and advanced combustion systems, which are expected to witness rapid development.
- Dominant Region: North America (driven by US incentives and biomass availability).
- Key Growth Driver (Fuel Type): Biodiesel (established infrastructure) and Bio-ethanol (increasing blends and applications).
- Emerging Fuel Type Segment: Others (advanced biofuels, waste-derived fuels).
- Dominant Technology: Engine (widespread use and adaptability).
- Growing Technology Segment: Turbine (large-scale power generation) and Others (innovative solutions).
- Market Share Analysis: Detailed market share data for leading regions and segments will be provided in the full report.
Bioliquid Heat and Power Generation Market Product Landscape
The Bioliquid Heat and Power Generation Market product landscape is characterized by a diverse range of bioliquids and associated generation technologies. Key product innovations focus on enhancing fuel efficiency, reducing emissions, and diversifying feedstock sources. Bio-ethanol and biodiesel remain prominent, with ongoing advancements in their production processes to improve yield and purity. Novel bioliquids derived from algae, waste cooking oil, and agricultural residues are gaining traction, offering sustainable alternatives to conventional fuels. In terms of applications, these bioliquids power engines in vehicles and stationary generators, as well as fuel turbines for large-scale electricity generation. Performance metrics are constantly being refined, with a focus on higher energy density, lower greenhouse gas emissions, and improved combustion characteristics. Unique selling propositions lie in the renewable nature of these fuels, their contribution to energy security, and their potential to reduce reliance on fossil fuels.
Key Drivers, Barriers & Challenges in Bioliquid Heat and Power Generation Market
Key Drivers:
- Environmental Concerns & Climate Change: Growing global emphasis on reducing carbon footprints and combating climate change is a primary catalyst.
- Governmental Support & Incentives: Tax credits, subsidies, and renewable energy mandates are crucial for market viability.
- Energy Security & Diversification: Reducing reliance on volatile fossil fuel markets and diversifying energy sources.
- Technological Advancements: Improvements in bioliquid production, conversion efficiency, and engine technology.
- Abundant Biomass Feedstock Availability: The potential to utilize agricultural waste, forestry byproducts, and dedicated energy crops.
Barriers & Challenges:
- Feedstock Availability & Price Volatility: Competition for land and resources, coupled with fluctuating prices, can impact production costs.
- Infrastructure Development Costs: Significant investment is required for establishing production facilities, storage, and distribution networks.
- Regulatory Hurdles & Policy Uncertainty: Inconsistent or evolving regulations can create investment risks.
- Competition from Established Fossil Fuels: The cost-competitiveness and existing infrastructure of fossil fuels present a significant challenge.
- Land Use & Food Security Concerns: The potential for bioliquid production to compete with food crops requires careful management and sustainable practices.
Emerging Opportunities in Bioliquid Heat and Power Generation Market
Emerging opportunities in the Bioliquid Heat and Power Generation Market are manifold. The development of advanced biofuels from non-food sources, such as cellulosic materials and algae, presents a significant untapped market. Innovative applications in decentralized energy generation, particularly in rural and off-grid communities, offer substantial growth potential. Evolving consumer preferences for sustainable and ethically sourced energy solutions are driving demand for bio-based products. Furthermore, the integration of bioliquids with other renewable energy sources, such as solar and wind power, in hybrid systems, is an area ripe for exploration. The circular economy model, where waste streams are converted into valuable bioliquids, also offers substantial opportunities for economic and environmental benefits.
Growth Accelerators in the Bioliquid Heat and Power Generation Market Industry
Catalysts driving long-term growth in the Bioliquid Heat and Power Generation Market are multifaceted. Continuous technological breakthroughs in enzyme-catalyzed production, genetic engineering of feedstocks for higher yields, and more efficient conversion processes are key accelerators. Strategic partnerships between feedstock suppliers, technology developers, and energy producers are crucial for scaling up production and ensuring market access. Furthermore, aggressive market expansion strategies by key players, focusing on regions with high renewable energy potential and supportive policies, will further propel growth. The increasing integration of bioliquid-based power generation into national energy grids and the development of robust supply chains will also significantly contribute to sustained market expansion.
Key Players Shaping the Bioliquid Heat and Power Generation Market Market
- Enerkem
- Pinnacle Renewable Energy Inc
- Strabag SE
- Ameresco Inc
- Drax Group
- Enviva Inc
- Green Plains Inc
- Archer-Daniels-Midland Co
- Envitec Biogas AG
- Albioma SA
Notable Milestones in Bioliquid Heat and Power Generation Market Sector
- 2020: United States government renews tax credit for biodiesel and renewable diesel production.
- 2020-2022: Biodiesel tax credit (BTC) expected to continue, aiming to increase production levels for various applications.
In-Depth Bioliquid Heat and Power Generation Market Market Outlook
The future outlook for the Bioliquid Heat and Power Generation Market is exceptionally bright, driven by a confluence of environmental imperatives, technological innovation, and supportive policies. Growth accelerators such as advanced biofuel development from non-food sources, smart grid integration, and circular economy initiatives will redefine the energy landscape. Strategic opportunities lie in capitalizing on emerging markets, developing novel applications for bio-based energy, and adapting to evolving consumer preferences for sustainability. The market is poised for substantial expansion, contributing significantly to global decarbonization efforts and enhancing energy independence.
Bioliquid Heat and Power Generation Market Segmentation
-
1. Fuel Type
- 1.1. Bio-ethanol
- 1.2. Biodiesel
- 1.3. Others
-
2. Technoligy
- 2.1. Engine
- 2.2. Turbine
- 2.3. Others
Bioliquid Heat and Power Generation Market Segmentation By Geography
- 1. North America
- 2. Europe
- 3. Asia Pacific
- 4. South America
- 5. Middle East and Africa
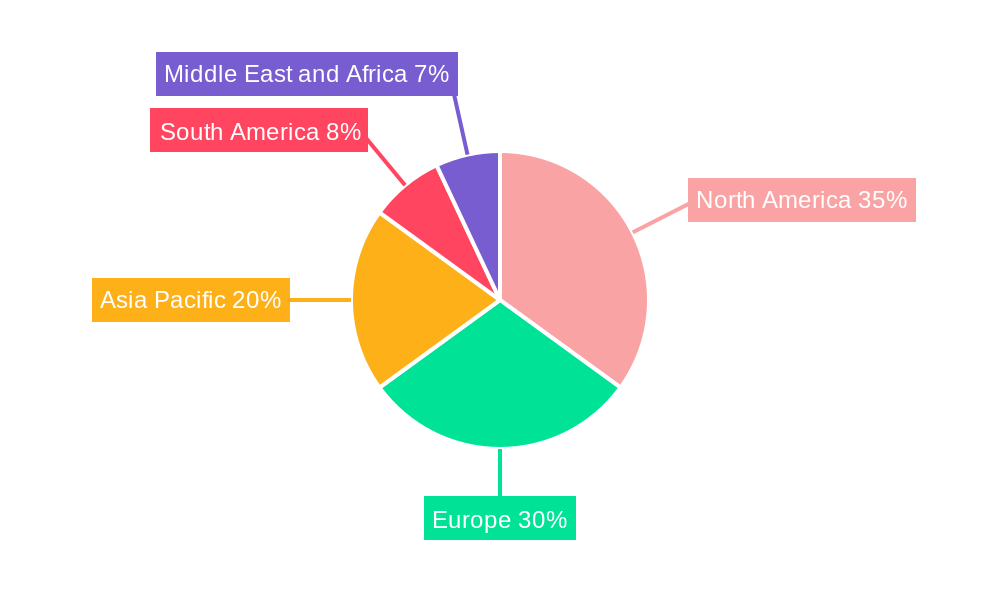
Bioliquid Heat and Power Generation Market Regional Market Share
Geographic Coverage of Bioliquid Heat and Power Generation Market
Bioliquid Heat and Power Generation Market REPORT HIGHLIGHTS
| Aspects | Details |
|---|---|
| Study Period | 2020-2034 |
| Base Year | 2025 |
| Estimated Year | 2026 |
| Forecast Period | 2026-2034 |
| Historical Period | 2020-2025 |
| Growth Rate | CAGR of 7% from 2020-2034 |
| Segmentation |
|
Table of Contents
- 1. Introduction
- 1.1. Research Scope
- 1.2. Market Segmentation
- 1.3. Research Objective
- 1.4. Definitions and Assumptions
- 2. Executive Summary
- 2.1. Market Snapshot
- 3. Market Dynamics
- 3.1. Market Drivers
- 3.2. Market Restrains
- 3.3. Market Trends
- 3.4. Market Opportunities
- 4. Market Factor Analysis
- 4.1. Porters Five Forces
- 4.1.1. Bargaining Power of Suppliers
- 4.1.2. Bargaining Power of Buyers
- 4.1.3. Threat of New Entrants
- 4.1.4. Threat of Substitutes
- 4.1.5. Competitive Rivalry
- 4.2. PESTEL analysis
- 4.3. BCG Analysis
- 4.3.1. Stars (High Growth, High Market Share)
- 4.3.2. Cash Cows (Low Growth, High Market Share)
- 4.3.3. Question Mark (High Growth, Low Market Share)
- 4.3.4. Dogs (Low Growth, Low Market Share)
- 4.4. Ansoff Matrix Analysis
- 4.5. Supply Chain Analysis
- 4.6. Regulatory Landscape
- 4.7. Current Market Potential and Opportunity Assessment (TAM–SAM–SOM Framework)
- 4.8. NRP Analyst Note
- 4.1. Porters Five Forces
- 5. Market Analysis, Insights and Forecast 2021-2033
- 5.1. Market Analysis, Insights and Forecast - by Fuel Type
- 5.1.1. Bio-ethanol
- 5.1.2. Biodiesel
- 5.1.3. Others
- 5.2. Market Analysis, Insights and Forecast - by Technoligy
- 5.2.1. Engine
- 5.2.2. Turbine
- 5.2.3. Others
- 5.3. Market Analysis, Insights and Forecast - by Region
- 5.3.1. North America
- 5.3.2. Europe
- 5.3.3. Asia Pacific
- 5.3.4. South America
- 5.3.5. Middle East and Africa
- 5.1. Market Analysis, Insights and Forecast - by Fuel Type
- 6. Global Bioliquid Heat and Power Generation Market Analysis, Insights and Forecast, 2021-2033
- 6.1. Market Analysis, Insights and Forecast - by Fuel Type
- 6.1.1. Bio-ethanol
- 6.1.2. Biodiesel
- 6.1.3. Others
- 6.2. Market Analysis, Insights and Forecast - by Technoligy
- 6.2.1. Engine
- 6.2.2. Turbine
- 6.2.3. Others
- 6.1. Market Analysis, Insights and Forecast - by Fuel Type
- 7. North America Bioliquid Heat and Power Generation Market Analysis, Insights and Forecast, 2020-2032
- 7.1. Market Analysis, Insights and Forecast - by Fuel Type
- 7.1.1. Bio-ethanol
- 7.1.2. Biodiesel
- 7.1.3. Others
- 7.2. Market Analysis, Insights and Forecast - by Technoligy
- 7.2.1. Engine
- 7.2.2. Turbine
- 7.2.3. Others
- 7.1. Market Analysis, Insights and Forecast - by Fuel Type
- 8. Europe Bioliquid Heat and Power Generation Market Analysis, Insights and Forecast, 2020-2032
- 8.1. Market Analysis, Insights and Forecast - by Fuel Type
- 8.1.1. Bio-ethanol
- 8.1.2. Biodiesel
- 8.1.3. Others
- 8.2. Market Analysis, Insights and Forecast - by Technoligy
- 8.2.1. Engine
- 8.2.2. Turbine
- 8.2.3. Others
- 8.1. Market Analysis, Insights and Forecast - by Fuel Type
- 9. Asia Pacific Bioliquid Heat and Power Generation Market Analysis, Insights and Forecast, 2020-2032
- 9.1. Market Analysis, Insights and Forecast - by Fuel Type
- 9.1.1. Bio-ethanol
- 9.1.2. Biodiesel
- 9.1.3. Others
- 9.2. Market Analysis, Insights and Forecast - by Technoligy
- 9.2.1. Engine
- 9.2.2. Turbine
- 9.2.3. Others
- 9.1. Market Analysis, Insights and Forecast - by Fuel Type
- 10. South America Bioliquid Heat and Power Generation Market Analysis, Insights and Forecast, 2020-2032
- 10.1. Market Analysis, Insights and Forecast - by Fuel Type
- 10.1.1. Bio-ethanol
- 10.1.2. Biodiesel
- 10.1.3. Others
- 10.2. Market Analysis, Insights and Forecast - by Technoligy
- 10.2.1. Engine
- 10.2.2. Turbine
- 10.2.3. Others
- 10.1. Market Analysis, Insights and Forecast - by Fuel Type
- 11. Middle East and Africa Bioliquid Heat and Power Generation Market Analysis, Insights and Forecast, 2020-2032
- 11.1. Market Analysis, Insights and Forecast - by Fuel Type
- 11.1.1. Bio-ethanol
- 11.1.2. Biodiesel
- 11.1.3. Others
- 11.2. Market Analysis, Insights and Forecast - by Technoligy
- 11.2.1. Engine
- 11.2.2. Turbine
- 11.2.3. Others
- 11.1. Market Analysis, Insights and Forecast - by Fuel Type
- 12. Competitive Analysis
- 12.1. Company Profiles
- 12.1.1 Enerkem
- 12.1.1.1. Company Overview
- 12.1.1.2. Products
- 12.1.1.3. Company Financials
- 12.1.1.4. SWOT Analysis
- 12.1.2 Pinnacle Renewable Energy Inc
- 12.1.2.1. Company Overview
- 12.1.2.2. Products
- 12.1.2.3. Company Financials
- 12.1.2.4. SWOT Analysis
- 12.1.3 Strabag SE
- 12.1.3.1. Company Overview
- 12.1.3.2. Products
- 12.1.3.3. Company Financials
- 12.1.3.4. SWOT Analysis
- 12.1.4 Ameresco Inc
- 12.1.4.1. Company Overview
- 12.1.4.2. Products
- 12.1.4.3. Company Financials
- 12.1.4.4. SWOT Analysis
- 12.1.5 Drax Group
- 12.1.5.1. Company Overview
- 12.1.5.2. Products
- 12.1.5.3. Company Financials
- 12.1.5.4. SWOT Analysis
- 12.1.6 Enviva Inc
- 12.1.6.1. Company Overview
- 12.1.6.2. Products
- 12.1.6.3. Company Financials
- 12.1.6.4. SWOT Analysis
- 12.1.7 Green Plains Inc *List Not Exhaustive
- 12.1.7.1. Company Overview
- 12.1.7.2. Products
- 12.1.7.3. Company Financials
- 12.1.7.4. SWOT Analysis
- 12.1.8 Archer-Daniels-Midland Co
- 12.1.8.1. Company Overview
- 12.1.8.2. Products
- 12.1.8.3. Company Financials
- 12.1.8.4. SWOT Analysis
- 12.1.9 Envitec Biogas AG
- 12.1.9.1. Company Overview
- 12.1.9.2. Products
- 12.1.9.3. Company Financials
- 12.1.9.4. SWOT Analysis
- 12.1.10 Albioma SA
- 12.1.10.1. Company Overview
- 12.1.10.2. Products
- 12.1.10.3. Company Financials
- 12.1.10.4. SWOT Analysis
- 12.1.1 Enerkem
- 12.2. Market Entropy
- 12.2.1 Company's Key Areas Served
- 12.2.2 Recent Developments
- 12.3. Company Market Share Analysis 2025
- 12.3.1 Top 5 Companies Market Share Analysis
- 12.3.2 Top 3 Companies Market Share Analysis
- 12.4. List of Potential Customers
- 13. Research Methodology
List of Figures
- Figure 1: Global Bioliquid Heat and Power Generation Market Revenue Breakdown (undefined, %) by Region 2025 & 2033
- Figure 2: North America Bioliquid Heat and Power Generation Market Revenue (undefined), by Fuel Type 2025 & 2033
- Figure 3: North America Bioliquid Heat and Power Generation Market Revenue Share (%), by Fuel Type 2025 & 2033
- Figure 4: North America Bioliquid Heat and Power Generation Market Revenue (undefined), by Technoligy 2025 & 2033
- Figure 5: North America Bioliquid Heat and Power Generation Market Revenue Share (%), by Technoligy 2025 & 2033
- Figure 6: North America Bioliquid Heat and Power Generation Market Revenue (undefined), by Country 2025 & 2033
- Figure 7: North America Bioliquid Heat and Power Generation Market Revenue Share (%), by Country 2025 & 2033
- Figure 8: Europe Bioliquid Heat and Power Generation Market Revenue (undefined), by Fuel Type 2025 & 2033
- Figure 9: Europe Bioliquid Heat and Power Generation Market Revenue Share (%), by Fuel Type 2025 & 2033
- Figure 10: Europe Bioliquid Heat and Power Generation Market Revenue (undefined), by Technoligy 2025 & 2033
- Figure 11: Europe Bioliquid Heat and Power Generation Market Revenue Share (%), by Technoligy 2025 & 2033
- Figure 12: Europe Bioliquid Heat and Power Generation Market Revenue (undefined), by Country 2025 & 2033
- Figure 13: Europe Bioliquid Heat and Power Generation Market Revenue Share (%), by Country 2025 & 2033
- Figure 14: Asia Pacific Bioliquid Heat and Power Generation Market Revenue (undefined), by Fuel Type 2025 & 2033
- Figure 15: Asia Pacific Bioliquid Heat and Power Generation Market Revenue Share (%), by Fuel Type 2025 & 2033
- Figure 16: Asia Pacific Bioliquid Heat and Power Generation Market Revenue (undefined), by Technoligy 2025 & 2033
- Figure 17: Asia Pacific Bioliquid Heat and Power Generation Market Revenue Share (%), by Technoligy 2025 & 2033
- Figure 18: Asia Pacific Bioliquid Heat and Power Generation Market Revenue (undefined), by Country 2025 & 2033
- Figure 19: Asia Pacific Bioliquid Heat and Power Generation Market Revenue Share (%), by Country 2025 & 2033
- Figure 20: South America Bioliquid Heat and Power Generation Market Revenue (undefined), by Fuel Type 2025 & 2033
- Figure 21: South America Bioliquid Heat and Power Generation Market Revenue Share (%), by Fuel Type 2025 & 2033
- Figure 22: South America Bioliquid Heat and Power Generation Market Revenue (undefined), by Technoligy 2025 & 2033
- Figure 23: South America Bioliquid Heat and Power Generation Market Revenue Share (%), by Technoligy 2025 & 2033
- Figure 24: South America Bioliquid Heat and Power Generation Market Revenue (undefined), by Country 2025 & 2033
- Figure 25: South America Bioliquid Heat and Power Generation Market Revenue Share (%), by Country 2025 & 2033
- Figure 26: Middle East and Africa Bioliquid Heat and Power Generation Market Revenue (undefined), by Fuel Type 2025 & 2033
- Figure 27: Middle East and Africa Bioliquid Heat and Power Generation Market Revenue Share (%), by Fuel Type 2025 & 2033
- Figure 28: Middle East and Africa Bioliquid Heat and Power Generation Market Revenue (undefined), by Technoligy 2025 & 2033
- Figure 29: Middle East and Africa Bioliquid Heat and Power Generation Market Revenue Share (%), by Technoligy 2025 & 2033
- Figure 30: Middle East and Africa Bioliquid Heat and Power Generation Market Revenue (undefined), by Country 2025 & 2033
- Figure 31: Middle East and Africa Bioliquid Heat and Power Generation Market Revenue Share (%), by Country 2025 & 2033
List of Tables
- Table 1: Global Bioliquid Heat and Power Generation Market Revenue undefined Forecast, by Fuel Type 2020 & 2033
- Table 2: Global Bioliquid Heat and Power Generation Market Revenue undefined Forecast, by Technoligy 2020 & 2033
- Table 3: Global Bioliquid Heat and Power Generation Market Revenue undefined Forecast, by Region 2020 & 2033
- Table 4: Global Bioliquid Heat and Power Generation Market Revenue undefined Forecast, by Fuel Type 2020 & 2033
- Table 5: Global Bioliquid Heat and Power Generation Market Revenue undefined Forecast, by Technoligy 2020 & 2033
- Table 6: Global Bioliquid Heat and Power Generation Market Revenue undefined Forecast, by Country 2020 & 2033
- Table 7: Global Bioliquid Heat and Power Generation Market Revenue undefined Forecast, by Fuel Type 2020 & 2033
- Table 8: Global Bioliquid Heat and Power Generation Market Revenue undefined Forecast, by Technoligy 2020 & 2033
- Table 9: Global Bioliquid Heat and Power Generation Market Revenue undefined Forecast, by Country 2020 & 2033
- Table 10: Global Bioliquid Heat and Power Generation Market Revenue undefined Forecast, by Fuel Type 2020 & 2033
- Table 11: Global Bioliquid Heat and Power Generation Market Revenue undefined Forecast, by Technoligy 2020 & 2033
- Table 12: Global Bioliquid Heat and Power Generation Market Revenue undefined Forecast, by Country 2020 & 2033
- Table 13: Global Bioliquid Heat and Power Generation Market Revenue undefined Forecast, by Fuel Type 2020 & 2033
- Table 14: Global Bioliquid Heat and Power Generation Market Revenue undefined Forecast, by Technoligy 2020 & 2033
- Table 15: Global Bioliquid Heat and Power Generation Market Revenue undefined Forecast, by Country 2020 & 2033
- Table 16: Global Bioliquid Heat and Power Generation Market Revenue undefined Forecast, by Fuel Type 2020 & 2033
- Table 17: Global Bioliquid Heat and Power Generation Market Revenue undefined Forecast, by Technoligy 2020 & 2033
- Table 18: Global Bioliquid Heat and Power Generation Market Revenue undefined Forecast, by Country 2020 & 2033
Frequently Asked Questions
1. What is the projected Compound Annual Growth Rate (CAGR) of the Bioliquid Heat and Power Generation Market?
The projected CAGR is approximately 7%.
2. Which companies are prominent players in the Bioliquid Heat and Power Generation Market?
Key companies in the market include Enerkem, Pinnacle Renewable Energy Inc, Strabag SE, Ameresco Inc, Drax Group, Enviva Inc, Green Plains Inc *List Not Exhaustive, Archer-Daniels-Midland Co, Envitec Biogas AG, Albioma SA.
3. What are the main segments of the Bioliquid Heat and Power Generation Market?
The market segments include Fuel Type, Technoligy.
4. Can you provide details about the market size?
The market size is estimated to be USD XXX N/A as of 2022.
5. What are some drivers contributing to market growth?
4.; Improved Viability Of Offshore Oil And Gas Projects.
6. What are the notable trends driving market growth?
Bioethanol Segment is to Dominate the Market.
7. Are there any restraints impacting market growth?
4.; Ban On Offshore Exploration And Production Activities In Multiple Regions.
8. Can you provide examples of recent developments in the market?
In 2020, the United States government decided to renew the provision of tax credit for the production of biodiesel and renewable diesel production. In order to increase the production levels of the fuels for the application in various sectors, the biodiesel tax credit (BTC) is expected to continue through 2022 also.
9. What pricing options are available for accessing the report?
Pricing options include single-user, multi-user, and enterprise licenses priced at USD 4750, USD 5250, and USD 8750 respectively.
10. Is the market size provided in terms of value or volume?
The market size is provided in terms of value, measured in N/A.
11. Are there any specific market keywords associated with the report?
Yes, the market keyword associated with the report is "Bioliquid Heat and Power Generation Market," which aids in identifying and referencing the specific market segment covered.
12. How do I determine which pricing option suits my needs best?
The pricing options vary based on user requirements and access needs. Individual users may opt for single-user licenses, while businesses requiring broader access may choose multi-user or enterprise licenses for cost-effective access to the report.
13. Are there any additional resources or data provided in the Bioliquid Heat and Power Generation Market report?
While the report offers comprehensive insights, it's advisable to review the specific contents or supplementary materials provided to ascertain if additional resources or data are available.
14. How can I stay updated on further developments or reports in the Bioliquid Heat and Power Generation Market?
To stay informed about further developments, trends, and reports in the Bioliquid Heat and Power Generation Market, consider subscribing to industry newsletters, following relevant companies and organizations, or regularly checking reputable industry news sources and publications.
Methodology
Step 1 - Identification of Relevant Samples Size from Population Database


Step 2 - Approaches for Defining Global Market Size (Value, Volume* & Price*)

Note*: In applicable scenarios
Step 3 - Data Sources
Primary Research
- Web Analytics
- Survey Reports
- Research Institute
- Latest Research Reports
- Opinion Leaders
Secondary Research
- Annual Reports
- White Paper
- Latest Press Release
- Industry Association
- Paid Database
- Investor Presentations

Step 4 - Data Triangulation
Involves using different sources of information in order to increase the validity of a study
These sources are likely to be stakeholders in a program - participants, other researchers, program staff, other community members, and so on.
Then we put all data in single framework & apply various statistical tools to find out the dynamic on the market.
During the analysis stage, feedback from the stakeholder groups would be compared to determine areas of agreement as well as areas of divergence