

Key Insights
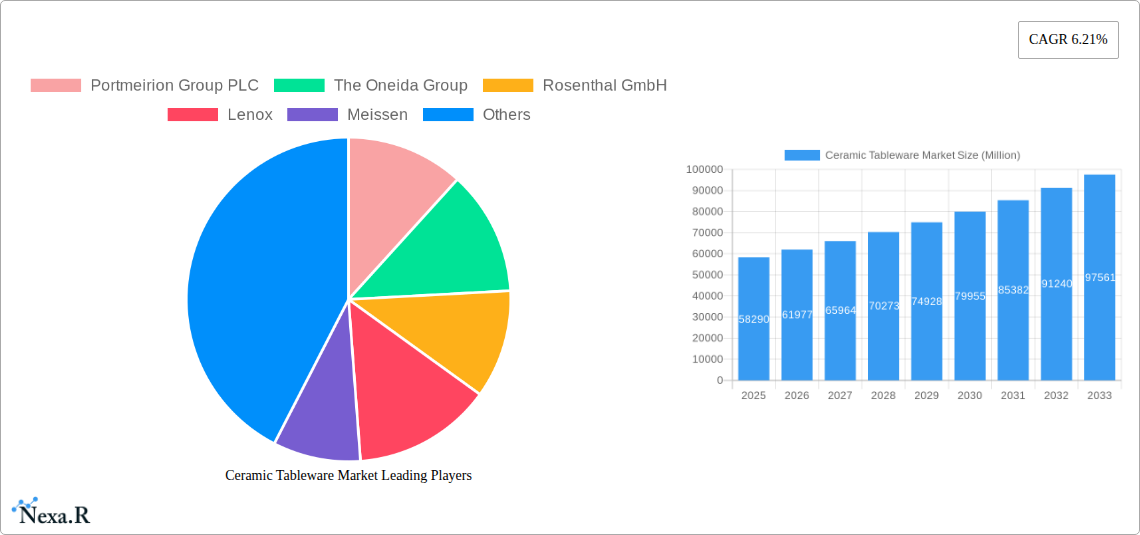
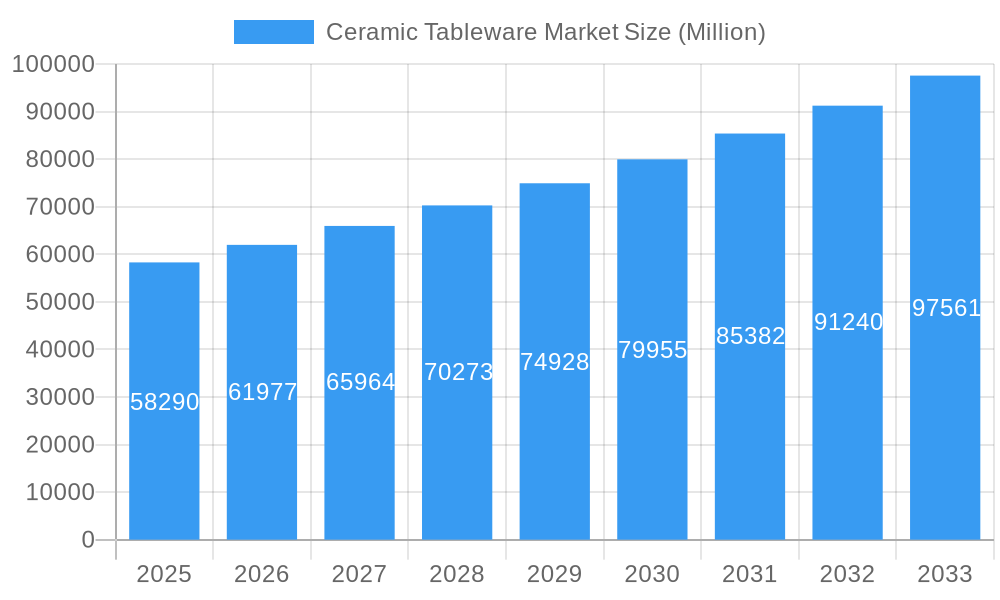
The global ceramic tableware market, valued at $58.29 billion in 2025, is projected to experience robust growth, driven by a Compound Annual Growth Rate (CAGR) of 6.21% from 2025 to 2033. This expansion is fueled by several key factors. The increasing popularity of home-cooked meals and casual dining experiences is boosting demand for aesthetically pleasing and durable tableware. Furthermore, the rising disposable incomes in emerging economies, coupled with a growing preference for premium quality ceramic products, are significant drivers. The shift towards sustainable and eco-friendly materials also contributes to the market's growth, as ceramic tableware is often perceived as a more environmentally conscious choice compared to disposable alternatives. Segmentation analysis reveals that the porcelain and bone china segment holds a significant market share due to its elegance and perceived value. The household end-user segment dominates, although the commercial sector is experiencing notable growth driven by the expansion of the hospitality industry. Online distribution channels are gaining traction, offering convenience and wider product choices to consumers. Competitive landscape analysis shows a mix of established global players and regional manufacturers, highlighting the market's dynamic nature. Geographic distribution indicates strong growth potential in Asia-Pacific, driven by rapid urbanization and rising consumer spending, while North America and Europe maintain significant market shares due to established consumer preferences and higher per capita consumption.
Ceramic Tableware Market Market Size (In Billion)
The market faces some challenges, primarily related to fluctuating raw material prices and potential disruptions in global supply chains. However, manufacturers are increasingly focusing on innovation, introducing new designs, functionalities, and materials to cater to evolving consumer preferences. This includes incorporating features like microwave and dishwasher safety, as well as developing specialized products for specific cuisines. Furthermore, the market is witnessing a trend towards personalization and customization, with consumers seeking unique and personalized tableware sets. To maintain a competitive edge, manufacturers are focusing on branding, marketing strategies, and building strong distribution networks. The ongoing development of sustainable production processes and environmentally friendly materials further contributes to market expansion by aligning with consumer concerns about environmental responsibility. This combined effect of positive market drivers and strategic adaptations by industry players underscores the promising outlook for the ceramic tableware market in the coming years.
Ceramic Tableware Market Company Market Share
Ceramic Tableware Market: A Comprehensive Report (2019-2033)
This comprehensive report provides a detailed analysis of the global Ceramic Tableware market, encompassing its historical performance (2019-2024), current status (2025), and future projections (2025-2033). We delve deep into market dynamics, growth trends, regional dominance, product landscape, and key players, equipping stakeholders with actionable insights to navigate this dynamic industry. The report segments the market by type (Porcelain and Bone China, Stoneware (Ceramic), Others), end-user (Household, Commercial), and distribution channel (Supermarkets & Hypermarkets, Specialty Stores, Wholesalers, Online, Others), providing granular data for informed decision-making. The total market size in 2025 is estimated at xx Million units.
Ceramic Tableware Market Market Dynamics & Structure
The Ceramic Tableware market exhibits a moderately concentrated structure, with a few major players commanding significant market share. Technological innovation, driven by advancements in materials science and manufacturing processes, is a key growth driver. Stringent regulatory frameworks concerning food safety and environmental sustainability significantly impact production and distribution. The market faces competition from substitutes like melamine and plastic tableware, particularly in the price-sensitive segment. End-user demographics, notably a growing middle class in developing economies and evolving consumer preferences for aesthetically pleasing and functional tableware, are shaping market demand. Mergers and acquisitions (M&A) activity within the sector has been moderate in recent years, with approximately xx M&A deals recorded between 2019 and 2024.
- Market Concentration: Moderately concentrated, with top 5 players holding approximately xx% market share in 2025.
- Technological Innovation: Focus on lightweight, durable, and aesthetically appealing designs; sustainable manufacturing practices gaining traction.
- Regulatory Framework: Stringent food safety standards and environmental regulations influence material selection and production methods.
- Competitive Substitutes: Melamine and plastic tableware pose a competitive threat, especially in the budget segment.
- End-User Demographics: Growing middle class in emerging markets fueling demand; evolving consumer preferences towards premium and sustainable options.
- M&A Trends: Moderate M&A activity observed, with xx deals recorded between 2019 and 2024. Consolidation expected to continue.
Ceramic Tableware Market Growth Trends & Insights
The global Ceramic Tableware market has demonstrated robust and consistent growth over the historical period (2019-2024), with a Compound Annual Growth Rate (CAGR) of approximately **[Insert specific CAGR % here]**. This upward trajectory is anticipated to persist through the forecast period (2025-2033), albeit with a slightly moderated but still healthy CAGR of around **[Insert specific CAGR % here]**. Several key factors are fueling this sustained expansion. Notably, a rise in global disposable incomes, coupled with increasing urbanization, is driving higher consumer spending on home goods. Furthermore, a discernible shift towards premiumization in consumer purchasing habits is encouraging the uptake of higher-quality ceramic tableware. Technological advancements are playing a pivotal role, with the introduction of novel materials and sophisticated manufacturing techniques continuously enhancing product durability, aesthetics, and performance. Consumer preferences are also evolving, with a growing emphasis on sustainability and ethical sourcing significantly influencing market trends and product development. Emerging economies present substantial growth opportunities for market penetration due to their expanding consumer bases and increasing demand for household essentials.
Dominant Regions, Countries, or Segments in Ceramic Tableware Market
The Asia-Pacific region stands as the dominant force in the Ceramic Tableware market, with China and India leading the charge. This regional supremacy is underpinned by rapid economic expansion, a rapidly growing middle class with increasing purchasing power, and accelerating urbanization. Within the product segments, Porcelain and Bone China command the largest market share, a testament to their perceived premium quality, sophisticated aesthetic appeal, and inherent durability. The household segment significantly outpaces commercial usage, reflecting a substantial demand from residential consumers decorating and equipping their homes. In terms of distribution, supermarkets and hypermarkets emerge as the primary channels, leveraging their extensive reach and well-established logistical infrastructure to cater to a broad consumer base.
- Key Drivers in Asia-Pacific: Characterized by rapid economic growth, a rising influx of disposable income, and a continuously expanding middle-class demographic.
- Porcelain and Bone China Dominance: Their association with premium quality, exceptional aesthetic appeal, and superior durability are key factors driving their high demand.
- Household Segment Leadership: The market is driven by a higher volume of consumption in residential settings compared to commercial establishments.
- Supermarket/Hypermarket Channel Prevalence: These channels benefit from their widespread accessibility and robust distribution networks, facilitating significant sales volumes.
Ceramic Tableware Market Product Landscape
The Ceramic Tableware market is distinguished by its extensive and diverse product portfolio, offering an array of designs, sizes, and functionalities to meet varied consumer needs. Contemporary product development is heavily focused on enhancing intrinsic durability, improving resistance to common issues like chipping and breakage, and increasingly, the integration of sustainable and eco-friendly materials. Technological advancements are evident in the application of advanced glazes, which not only elevate the aesthetic appeal but also contribute to improved hygiene and ease of cleaning. Unique selling propositions frequently revolve around distinctive designs, meticulous craftsmanship, and leveraging a brand's heritage and reputation. Key performance metrics that consumers and manufacturers prioritize include the product's overall strength, longevity, thermal resistance, and visual attractiveness.
Key Drivers, Barriers & Challenges in Ceramic Tableware Market
Key Drivers: Rising disposable incomes, urbanization, and changing lifestyles are driving market growth. Increased awareness of sustainable products presents a significant opportunity. Government initiatives promoting local manufacturing and tourism could further boost demand.
Key Challenges: Fluctuations in raw material prices, particularly clay and glaze components, pose a challenge. Intense competition from low-cost manufacturers, particularly from emerging markets, impacts profitability. Maintaining consistent quality and adhering to stringent regulatory standards require significant investment. Supply chain disruptions during recent years caused a significant impact on the manufacturing process.
Emerging Opportunities in Ceramic Tableware Market
Significant untapped potential exists within the emerging markets of Africa and Latin America, presenting considerable avenues for market expansion and growth. The rapidly evolving landscape of online retail channels offers a potent opportunity for manufacturers to broaden their reach and engage with a wider customer base through e-commerce platforms. Innovation in product design, particularly in developing unique aesthetic concepts and enhancing functional features, can effectively attract and capture new consumer segments. Furthermore, the escalating global demand for eco-friendly and sustainable tableware creates a fertile ground for manufacturers who are committed to responsible production practices and offer products aligned with environmental consciousness.
Growth Accelerators in the Ceramic Tableware Market Industry
Technological advancements in manufacturing processes, leading to enhanced efficiency and reduced costs, are a major growth catalyst. Strategic partnerships between manufacturers and retailers can improve distribution and reach new markets. Expansion into new geographic regions, particularly untapped markets in developing economies, presents significant growth opportunities.
Key Players Shaping the Ceramic Tableware Market Market
- Portmeirion Group PLC
- The Oneida Group
- Rosenthal GmbH
- Lenox
- Meissen
- Libbey
- Seltmann Weiden
- RAK Porcelain
- Narumi
- KAHLA Porzellan
- WMF
- SCHONWALD
- Churchill China
- Villeroy & Boch
- TATA ceramics
- Sitong Group
- Fiskars Group
Notable Milestones in Ceramic Tableware Market Sector
- 2020: Increased adoption of sustainable manufacturing practices by several leading players.
- 2021: Launch of several innovative product lines incorporating new materials and designs.
- 2022: Significant investments in automation and digitalization within the industry.
- 2023: Several key mergers and acquisitions aimed at consolidating market share.
- 2024: Growing adoption of e-commerce channels for distribution.
In-Depth Ceramic Tableware Market Market Outlook
The future of the Ceramic Tableware market looks promising, driven by continued growth in emerging economies, increasing consumer demand for premium and sustainable products, and technological advancements. Strategic partnerships, focused innovation, and effective supply chain management will be crucial for sustained growth. The market is poised for further consolidation, with larger players likely to acquire smaller companies to expand their market share and product portfolios. Investing in sustainable practices will become increasingly important to attract environmentally conscious consumers.
Ceramic Tableware Market Segmentation
-
1. Type
- 1.1. Porcelain and Bone China
- 1.2. Stoneware (Ceramic)
- 1.3. Others
-
2. End User
- 2.1. Household
-
2.2. Commercial
- 2.2.1. Accommodation and Hospitality Segment
- 2.2.2. Food Service Segment
- 2.2.3. Others
-
3. Distribution Channel
- 3.1. Supermarkets & Hypermarkets
- 3.2. Specialty Stores
- 3.3. Wholesalers
- 3.4. Online
- 3.5. Others
Ceramic Tableware Market Segmentation By Geography
- 1. North America
- 2. Asia Pacific
- 3. Europe
- 4. Latin America
- 5. Middle East and Africa
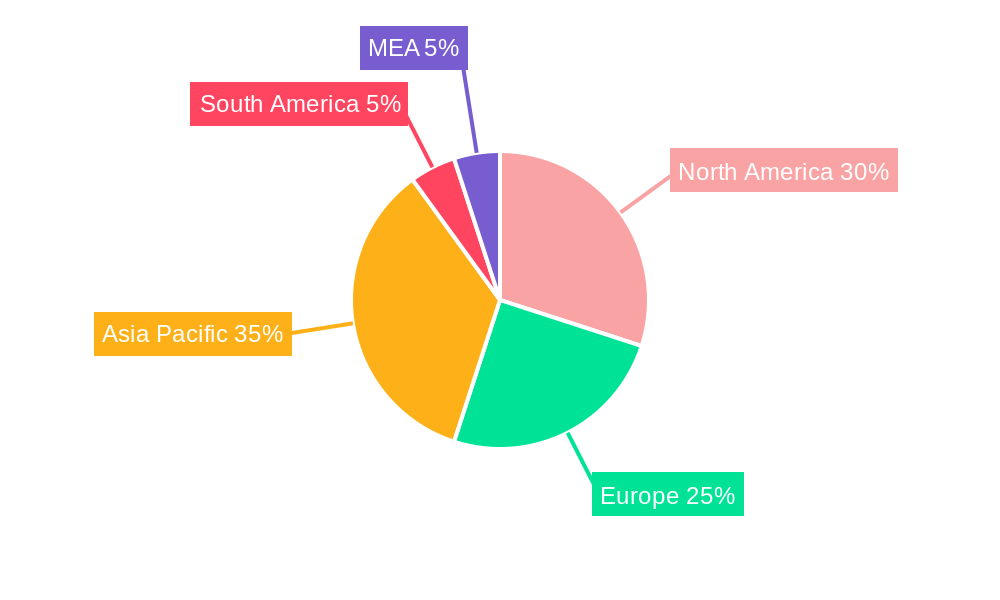
Ceramic Tableware Market Regional Market Share
Geographic Coverage of Ceramic Tableware Market
Ceramic Tableware Market REPORT HIGHLIGHTS
| Aspects | Details |
|---|---|
| Study Period | 2020-2034 |
| Base Year | 2025 |
| Estimated Year | 2026 |
| Forecast Period | 2026-2034 |
| Historical Period | 2020-2025 |
| Growth Rate | CAGR of 6.21% from 2020-2034 |
| Segmentation |
|
Table of Contents
- 1. Introduction
- 1.1. Research Scope
- 1.2. Market Segmentation
- 1.3. Research Objective
- 1.4. Definitions and Assumptions
- 2. Executive Summary
- 2.1. Market Snapshot
- 3. Market Dynamics
- 3.1. Market Drivers
- 3.2. Market Restrains
- 3.3. Market Trends
- 3.4. Market Opportunities
- 4. Market Factor Analysis
- 4.1. Porters Five Forces
- 4.1.1. Bargaining Power of Suppliers
- 4.1.2. Bargaining Power of Buyers
- 4.1.3. Threat of New Entrants
- 4.1.4. Threat of Substitutes
- 4.1.5. Competitive Rivalry
- 4.2. PESTEL analysis
- 4.3. BCG Analysis
- 4.3.1. Stars (High Growth, High Market Share)
- 4.3.2. Cash Cows (Low Growth, High Market Share)
- 4.3.3. Question Mark (High Growth, Low Market Share)
- 4.3.4. Dogs (Low Growth, Low Market Share)
- 4.4. Ansoff Matrix Analysis
- 4.5. Supply Chain Analysis
- 4.6. Regulatory Landscape
- 4.7. Current Market Potential and Opportunity Assessment (TAM–SAM–SOM Framework)
- 4.8. NRP Analyst Note
- 4.1. Porters Five Forces
- 5. Market Analysis, Insights and Forecast 2021-2033
- 5.1. Market Analysis, Insights and Forecast - by Type
- 5.1.1. Porcelain and Bone China
- 5.1.2. Stoneware (Ceramic)
- 5.1.3. Others
- 5.2. Market Analysis, Insights and Forecast - by End User
- 5.2.1. Household
- 5.2.2. Commercial
- 5.2.2.1. Accommodation and Hospitality Segment
- 5.2.2.2. Food Service Segment
- 5.2.2.3. Others
- 5.3. Market Analysis, Insights and Forecast - by Distribution Channel
- 5.3.1. Supermarkets & Hypermarkets
- 5.3.2. Specialty Stores
- 5.3.3. Wholesalers
- 5.3.4. Online
- 5.3.5. Others
- 5.4. Market Analysis, Insights and Forecast - by Region
- 5.4.1. North America
- 5.4.2. Asia Pacific
- 5.4.3. Europe
- 5.4.4. Latin America
- 5.4.5. Middle East and Africa
- 5.1. Market Analysis, Insights and Forecast - by Type
- 6. Global Ceramic Tableware Market Analysis, Insights and Forecast, 2021-2033
- 6.1. Market Analysis, Insights and Forecast - by Type
- 6.1.1. Porcelain and Bone China
- 6.1.2. Stoneware (Ceramic)
- 6.1.3. Others
- 6.2. Market Analysis, Insights and Forecast - by End User
- 6.2.1. Household
- 6.2.2. Commercial
- 6.2.2.1. Accommodation and Hospitality Segment
- 6.2.2.2. Food Service Segment
- 6.2.2.3. Others
- 6.3. Market Analysis, Insights and Forecast - by Distribution Channel
- 6.3.1. Supermarkets & Hypermarkets
- 6.3.2. Specialty Stores
- 6.3.3. Wholesalers
- 6.3.4. Online
- 6.3.5. Others
- 6.1. Market Analysis, Insights and Forecast - by Type
- 7. North America Ceramic Tableware Market Analysis, Insights and Forecast, 2020-2032
- 7.1. Market Analysis, Insights and Forecast - by Type
- 7.1.1. Porcelain and Bone China
- 7.1.2. Stoneware (Ceramic)
- 7.1.3. Others
- 7.2. Market Analysis, Insights and Forecast - by End User
- 7.2.1. Household
- 7.2.2. Commercial
- 7.2.2.1. Accommodation and Hospitality Segment
- 7.2.2.2. Food Service Segment
- 7.2.2.3. Others
- 7.3. Market Analysis, Insights and Forecast - by Distribution Channel
- 7.3.1. Supermarkets & Hypermarkets
- 7.3.2. Specialty Stores
- 7.3.3. Wholesalers
- 7.3.4. Online
- 7.3.5. Others
- 7.1. Market Analysis, Insights and Forecast - by Type
- 8. Asia Pacific Ceramic Tableware Market Analysis, Insights and Forecast, 2020-2032
- 8.1. Market Analysis, Insights and Forecast - by Type
- 8.1.1. Porcelain and Bone China
- 8.1.2. Stoneware (Ceramic)
- 8.1.3. Others
- 8.2. Market Analysis, Insights and Forecast - by End User
- 8.2.1. Household
- 8.2.2. Commercial
- 8.2.2.1. Accommodation and Hospitality Segment
- 8.2.2.2. Food Service Segment
- 8.2.2.3. Others
- 8.3. Market Analysis, Insights and Forecast - by Distribution Channel
- 8.3.1. Supermarkets & Hypermarkets
- 8.3.2. Specialty Stores
- 8.3.3. Wholesalers
- 8.3.4. Online
- 8.3.5. Others
- 8.1. Market Analysis, Insights and Forecast - by Type
- 9. Europe Ceramic Tableware Market Analysis, Insights and Forecast, 2020-2032
- 9.1. Market Analysis, Insights and Forecast - by Type
- 9.1.1. Porcelain and Bone China
- 9.1.2. Stoneware (Ceramic)
- 9.1.3. Others
- 9.2. Market Analysis, Insights and Forecast - by End User
- 9.2.1. Household
- 9.2.2. Commercial
- 9.2.2.1. Accommodation and Hospitality Segment
- 9.2.2.2. Food Service Segment
- 9.2.2.3. Others
- 9.3. Market Analysis, Insights and Forecast - by Distribution Channel
- 9.3.1. Supermarkets & Hypermarkets
- 9.3.2. Specialty Stores
- 9.3.3. Wholesalers
- 9.3.4. Online
- 9.3.5. Others
- 9.1. Market Analysis, Insights and Forecast - by Type
- 10. Latin America Ceramic Tableware Market Analysis, Insights and Forecast, 2020-2032
- 10.1. Market Analysis, Insights and Forecast - by Type
- 10.1.1. Porcelain and Bone China
- 10.1.2. Stoneware (Ceramic)
- 10.1.3. Others
- 10.2. Market Analysis, Insights and Forecast - by End User
- 10.2.1. Household
- 10.2.2. Commercial
- 10.2.2.1. Accommodation and Hospitality Segment
- 10.2.2.2. Food Service Segment
- 10.2.2.3. Others
- 10.3. Market Analysis, Insights and Forecast - by Distribution Channel
- 10.3.1. Supermarkets & Hypermarkets
- 10.3.2. Specialty Stores
- 10.3.3. Wholesalers
- 10.3.4. Online
- 10.3.5. Others
- 10.1. Market Analysis, Insights and Forecast - by Type
- 11. Middle East and Africa Ceramic Tableware Market Analysis, Insights and Forecast, 2020-2032
- 11.1. Market Analysis, Insights and Forecast - by Type
- 11.1.1. Porcelain and Bone China
- 11.1.2. Stoneware (Ceramic)
- 11.1.3. Others
- 11.2. Market Analysis, Insights and Forecast - by End User
- 11.2.1. Household
- 11.2.2. Commercial
- 11.2.2.1. Accommodation and Hospitality Segment
- 11.2.2.2. Food Service Segment
- 11.2.2.3. Others
- 11.3. Market Analysis, Insights and Forecast - by Distribution Channel
- 11.3.1. Supermarkets & Hypermarkets
- 11.3.2. Specialty Stores
- 11.3.3. Wholesalers
- 11.3.4. Online
- 11.3.5. Others
- 11.1. Market Analysis, Insights and Forecast - by Type
- 12. Competitive Analysis
- 12.1. Company Profiles
- 12.1.1 Portmeirion Group PLC
- 12.1.1.1. Company Overview
- 12.1.1.2. Products
- 12.1.1.3. Company Financials
- 12.1.1.4. SWOT Analysis
- 12.1.2 The Oneida Group
- 12.1.2.1. Company Overview
- 12.1.2.2. Products
- 12.1.2.3. Company Financials
- 12.1.2.4. SWOT Analysis
- 12.1.3 Rosenthal GmbH
- 12.1.3.1. Company Overview
- 12.1.3.2. Products
- 12.1.3.3. Company Financials
- 12.1.3.4. SWOT Analysis
- 12.1.4 Lenox
- 12.1.4.1. Company Overview
- 12.1.4.2. Products
- 12.1.4.3. Company Financials
- 12.1.4.4. SWOT Analysis
- 12.1.5 Meissen
- 12.1.5.1. Company Overview
- 12.1.5.2. Products
- 12.1.5.3. Company Financials
- 12.1.5.4. SWOT Analysis
- 12.1.6 Libbey
- 12.1.6.1. Company Overview
- 12.1.6.2. Products
- 12.1.6.3. Company Financials
- 12.1.6.4. SWOT Analysis
- 12.1.7 Seltmann Weiden
- 12.1.7.1. Company Overview
- 12.1.7.2. Products
- 12.1.7.3. Company Financials
- 12.1.7.4. SWOT Analysis
- 12.1.8 RAK Porcelain
- 12.1.8.1. Company Overview
- 12.1.8.2. Products
- 12.1.8.3. Company Financials
- 12.1.8.4. SWOT Analysis
- 12.1.9 Narumi
- 12.1.9.1. Company Overview
- 12.1.9.2. Products
- 12.1.9.3. Company Financials
- 12.1.9.4. SWOT Analysis
- 12.1.10 KAHLA Porzellan
- 12.1.10.1. Company Overview
- 12.1.10.2. Products
- 12.1.10.3. Company Financials
- 12.1.10.4. SWOT Analysis
- 12.1.11 WMF
- 12.1.11.1. Company Overview
- 12.1.11.2. Products
- 12.1.11.3. Company Financials
- 12.1.11.4. SWOT Analysis
- 12.1.12 SCHONWALD
- 12.1.12.1. Company Overview
- 12.1.12.2. Products
- 12.1.12.3. Company Financials
- 12.1.12.4. SWOT Analysis
- 12.1.13 Churchill China
- 12.1.13.1. Company Overview
- 12.1.13.2. Products
- 12.1.13.3. Company Financials
- 12.1.13.4. SWOT Analysis
- 12.1.14 Villeroy & Boch
- 12.1.14.1. Company Overview
- 12.1.14.2. Products
- 12.1.14.3. Company Financials
- 12.1.14.4. SWOT Analysis
- 12.1.15 TATA ceramics
- 12.1.15.1. Company Overview
- 12.1.15.2. Products
- 12.1.15.3. Company Financials
- 12.1.15.4. SWOT Analysis
- 12.1.16 Sitong Group
- 12.1.16.1. Company Overview
- 12.1.16.2. Products
- 12.1.16.3. Company Financials
- 12.1.16.4. SWOT Analysis
- 12.1.17 Fiskars Group
- 12.1.17.1. Company Overview
- 12.1.17.2. Products
- 12.1.17.3. Company Financials
- 12.1.17.4. SWOT Analysis
- 12.1.1 Portmeirion Group PLC
- 12.2. Market Entropy
- 12.2.1 Company's Key Areas Served
- 12.2.2 Recent Developments
- 12.3. Company Market Share Analysis 2025
- 12.3.1 Top 5 Companies Market Share Analysis
- 12.3.2 Top 3 Companies Market Share Analysis
- 12.4. List of Potential Customers
- 13. Research Methodology
List of Figures
- Figure 1: Global Ceramic Tableware Market Revenue Breakdown (Million, %) by Region 2025 & 2033
- Figure 2: Global Ceramic Tableware Market Volume Breakdown (K Unit, %) by Region 2025 & 2033
- Figure 3: North America Ceramic Tableware Market Revenue (Million), by Type 2025 & 2033
- Figure 4: North America Ceramic Tableware Market Volume (K Unit), by Type 2025 & 2033
- Figure 5: North America Ceramic Tableware Market Revenue Share (%), by Type 2025 & 2033
- Figure 6: North America Ceramic Tableware Market Volume Share (%), by Type 2025 & 2033
- Figure 7: North America Ceramic Tableware Market Revenue (Million), by End User 2025 & 2033
- Figure 8: North America Ceramic Tableware Market Volume (K Unit), by End User 2025 & 2033
- Figure 9: North America Ceramic Tableware Market Revenue Share (%), by End User 2025 & 2033
- Figure 10: North America Ceramic Tableware Market Volume Share (%), by End User 2025 & 2033
- Figure 11: North America Ceramic Tableware Market Revenue (Million), by Distribution Channel 2025 & 2033
- Figure 12: North America Ceramic Tableware Market Volume (K Unit), by Distribution Channel 2025 & 2033
- Figure 13: North America Ceramic Tableware Market Revenue Share (%), by Distribution Channel 2025 & 2033
- Figure 14: North America Ceramic Tableware Market Volume Share (%), by Distribution Channel 2025 & 2033
- Figure 15: North America Ceramic Tableware Market Revenue (Million), by Country 2025 & 2033
- Figure 16: North America Ceramic Tableware Market Volume (K Unit), by Country 2025 & 2033
- Figure 17: North America Ceramic Tableware Market Revenue Share (%), by Country 2025 & 2033
- Figure 18: North America Ceramic Tableware Market Volume Share (%), by Country 2025 & 2033
- Figure 19: Asia Pacific Ceramic Tableware Market Revenue (Million), by Type 2025 & 2033
- Figure 20: Asia Pacific Ceramic Tableware Market Volume (K Unit), by Type 2025 & 2033
- Figure 21: Asia Pacific Ceramic Tableware Market Revenue Share (%), by Type 2025 & 2033
- Figure 22: Asia Pacific Ceramic Tableware Market Volume Share (%), by Type 2025 & 2033
- Figure 23: Asia Pacific Ceramic Tableware Market Revenue (Million), by End User 2025 & 2033
- Figure 24: Asia Pacific Ceramic Tableware Market Volume (K Unit), by End User 2025 & 2033
- Figure 25: Asia Pacific Ceramic Tableware Market Revenue Share (%), by End User 2025 & 2033
- Figure 26: Asia Pacific Ceramic Tableware Market Volume Share (%), by End User 2025 & 2033
- Figure 27: Asia Pacific Ceramic Tableware Market Revenue (Million), by Distribution Channel 2025 & 2033
- Figure 28: Asia Pacific Ceramic Tableware Market Volume (K Unit), by Distribution Channel 2025 & 2033
- Figure 29: Asia Pacific Ceramic Tableware Market Revenue Share (%), by Distribution Channel 2025 & 2033
- Figure 30: Asia Pacific Ceramic Tableware Market Volume Share (%), by Distribution Channel 2025 & 2033
- Figure 31: Asia Pacific Ceramic Tableware Market Revenue (Million), by Country 2025 & 2033
- Figure 32: Asia Pacific Ceramic Tableware Market Volume (K Unit), by Country 2025 & 2033
- Figure 33: Asia Pacific Ceramic Tableware Market Revenue Share (%), by Country 2025 & 2033
- Figure 34: Asia Pacific Ceramic Tableware Market Volume Share (%), by Country 2025 & 2033
- Figure 35: Europe Ceramic Tableware Market Revenue (Million), by Type 2025 & 2033
- Figure 36: Europe Ceramic Tableware Market Volume (K Unit), by Type 2025 & 2033
- Figure 37: Europe Ceramic Tableware Market Revenue Share (%), by Type 2025 & 2033
- Figure 38: Europe Ceramic Tableware Market Volume Share (%), by Type 2025 & 2033
- Figure 39: Europe Ceramic Tableware Market Revenue (Million), by End User 2025 & 2033
- Figure 40: Europe Ceramic Tableware Market Volume (K Unit), by End User 2025 & 2033
- Figure 41: Europe Ceramic Tableware Market Revenue Share (%), by End User 2025 & 2033
- Figure 42: Europe Ceramic Tableware Market Volume Share (%), by End User 2025 & 2033
- Figure 43: Europe Ceramic Tableware Market Revenue (Million), by Distribution Channel 2025 & 2033
- Figure 44: Europe Ceramic Tableware Market Volume (K Unit), by Distribution Channel 2025 & 2033
- Figure 45: Europe Ceramic Tableware Market Revenue Share (%), by Distribution Channel 2025 & 2033
- Figure 46: Europe Ceramic Tableware Market Volume Share (%), by Distribution Channel 2025 & 2033
- Figure 47: Europe Ceramic Tableware Market Revenue (Million), by Country 2025 & 2033
- Figure 48: Europe Ceramic Tableware Market Volume (K Unit), by Country 2025 & 2033
- Figure 49: Europe Ceramic Tableware Market Revenue Share (%), by Country 2025 & 2033
- Figure 50: Europe Ceramic Tableware Market Volume Share (%), by Country 2025 & 2033
- Figure 51: Latin America Ceramic Tableware Market Revenue (Million), by Type 2025 & 2033
- Figure 52: Latin America Ceramic Tableware Market Volume (K Unit), by Type 2025 & 2033
- Figure 53: Latin America Ceramic Tableware Market Revenue Share (%), by Type 2025 & 2033
- Figure 54: Latin America Ceramic Tableware Market Volume Share (%), by Type 2025 & 2033
- Figure 55: Latin America Ceramic Tableware Market Revenue (Million), by End User 2025 & 2033
- Figure 56: Latin America Ceramic Tableware Market Volume (K Unit), by End User 2025 & 2033
- Figure 57: Latin America Ceramic Tableware Market Revenue Share (%), by End User 2025 & 2033
- Figure 58: Latin America Ceramic Tableware Market Volume Share (%), by End User 2025 & 2033
- Figure 59: Latin America Ceramic Tableware Market Revenue (Million), by Distribution Channel 2025 & 2033
- Figure 60: Latin America Ceramic Tableware Market Volume (K Unit), by Distribution Channel 2025 & 2033
- Figure 61: Latin America Ceramic Tableware Market Revenue Share (%), by Distribution Channel 2025 & 2033
- Figure 62: Latin America Ceramic Tableware Market Volume Share (%), by Distribution Channel 2025 & 2033
- Figure 63: Latin America Ceramic Tableware Market Revenue (Million), by Country 2025 & 2033
- Figure 64: Latin America Ceramic Tableware Market Volume (K Unit), by Country 2025 & 2033
- Figure 65: Latin America Ceramic Tableware Market Revenue Share (%), by Country 2025 & 2033
- Figure 66: Latin America Ceramic Tableware Market Volume Share (%), by Country 2025 & 2033
- Figure 67: Middle East and Africa Ceramic Tableware Market Revenue (Million), by Type 2025 & 2033
- Figure 68: Middle East and Africa Ceramic Tableware Market Volume (K Unit), by Type 2025 & 2033
- Figure 69: Middle East and Africa Ceramic Tableware Market Revenue Share (%), by Type 2025 & 2033
- Figure 70: Middle East and Africa Ceramic Tableware Market Volume Share (%), by Type 2025 & 2033
- Figure 71: Middle East and Africa Ceramic Tableware Market Revenue (Million), by End User 2025 & 2033
- Figure 72: Middle East and Africa Ceramic Tableware Market Volume (K Unit), by End User 2025 & 2033
- Figure 73: Middle East and Africa Ceramic Tableware Market Revenue Share (%), by End User 2025 & 2033
- Figure 74: Middle East and Africa Ceramic Tableware Market Volume Share (%), by End User 2025 & 2033
- Figure 75: Middle East and Africa Ceramic Tableware Market Revenue (Million), by Distribution Channel 2025 & 2033
- Figure 76: Middle East and Africa Ceramic Tableware Market Volume (K Unit), by Distribution Channel 2025 & 2033
- Figure 77: Middle East and Africa Ceramic Tableware Market Revenue Share (%), by Distribution Channel 2025 & 2033
- Figure 78: Middle East and Africa Ceramic Tableware Market Volume Share (%), by Distribution Channel 2025 & 2033
- Figure 79: Middle East and Africa Ceramic Tableware Market Revenue (Million), by Country 2025 & 2033
- Figure 80: Middle East and Africa Ceramic Tableware Market Volume (K Unit), by Country 2025 & 2033
- Figure 81: Middle East and Africa Ceramic Tableware Market Revenue Share (%), by Country 2025 & 2033
- Figure 82: Middle East and Africa Ceramic Tableware Market Volume Share (%), by Country 2025 & 2033
List of Tables
- Table 1: Global Ceramic Tableware Market Revenue Million Forecast, by Type 2020 & 2033
- Table 2: Global Ceramic Tableware Market Volume K Unit Forecast, by Type 2020 & 2033
- Table 3: Global Ceramic Tableware Market Revenue Million Forecast, by End User 2020 & 2033
- Table 4: Global Ceramic Tableware Market Volume K Unit Forecast, by End User 2020 & 2033
- Table 5: Global Ceramic Tableware Market Revenue Million Forecast, by Distribution Channel 2020 & 2033
- Table 6: Global Ceramic Tableware Market Volume K Unit Forecast, by Distribution Channel 2020 & 2033
- Table 7: Global Ceramic Tableware Market Revenue Million Forecast, by Region 2020 & 2033
- Table 8: Global Ceramic Tableware Market Volume K Unit Forecast, by Region 2020 & 2033
- Table 9: Global Ceramic Tableware Market Revenue Million Forecast, by Type 2020 & 2033
- Table 10: Global Ceramic Tableware Market Volume K Unit Forecast, by Type 2020 & 2033
- Table 11: Global Ceramic Tableware Market Revenue Million Forecast, by End User 2020 & 2033
- Table 12: Global Ceramic Tableware Market Volume K Unit Forecast, by End User 2020 & 2033
- Table 13: Global Ceramic Tableware Market Revenue Million Forecast, by Distribution Channel 2020 & 2033
- Table 14: Global Ceramic Tableware Market Volume K Unit Forecast, by Distribution Channel 2020 & 2033
- Table 15: Global Ceramic Tableware Market Revenue Million Forecast, by Country 2020 & 2033
- Table 16: Global Ceramic Tableware Market Volume K Unit Forecast, by Country 2020 & 2033
- Table 17: Global Ceramic Tableware Market Revenue Million Forecast, by Type 2020 & 2033
- Table 18: Global Ceramic Tableware Market Volume K Unit Forecast, by Type 2020 & 2033
- Table 19: Global Ceramic Tableware Market Revenue Million Forecast, by End User 2020 & 2033
- Table 20: Global Ceramic Tableware Market Volume K Unit Forecast, by End User 2020 & 2033
- Table 21: Global Ceramic Tableware Market Revenue Million Forecast, by Distribution Channel 2020 & 2033
- Table 22: Global Ceramic Tableware Market Volume K Unit Forecast, by Distribution Channel 2020 & 2033
- Table 23: Global Ceramic Tableware Market Revenue Million Forecast, by Country 2020 & 2033
- Table 24: Global Ceramic Tableware Market Volume K Unit Forecast, by Country 2020 & 2033
- Table 25: Global Ceramic Tableware Market Revenue Million Forecast, by Type 2020 & 2033
- Table 26: Global Ceramic Tableware Market Volume K Unit Forecast, by Type 2020 & 2033
- Table 27: Global Ceramic Tableware Market Revenue Million Forecast, by End User 2020 & 2033
- Table 28: Global Ceramic Tableware Market Volume K Unit Forecast, by End User 2020 & 2033
- Table 29: Global Ceramic Tableware Market Revenue Million Forecast, by Distribution Channel 2020 & 2033
- Table 30: Global Ceramic Tableware Market Volume K Unit Forecast, by Distribution Channel 2020 & 2033
- Table 31: Global Ceramic Tableware Market Revenue Million Forecast, by Country 2020 & 2033
- Table 32: Global Ceramic Tableware Market Volume K Unit Forecast, by Country 2020 & 2033
- Table 33: Global Ceramic Tableware Market Revenue Million Forecast, by Type 2020 & 2033
- Table 34: Global Ceramic Tableware Market Volume K Unit Forecast, by Type 2020 & 2033
- Table 35: Global Ceramic Tableware Market Revenue Million Forecast, by End User 2020 & 2033
- Table 36: Global Ceramic Tableware Market Volume K Unit Forecast, by End User 2020 & 2033
- Table 37: Global Ceramic Tableware Market Revenue Million Forecast, by Distribution Channel 2020 & 2033
- Table 38: Global Ceramic Tableware Market Volume K Unit Forecast, by Distribution Channel 2020 & 2033
- Table 39: Global Ceramic Tableware Market Revenue Million Forecast, by Country 2020 & 2033
- Table 40: Global Ceramic Tableware Market Volume K Unit Forecast, by Country 2020 & 2033
- Table 41: Global Ceramic Tableware Market Revenue Million Forecast, by Type 2020 & 2033
- Table 42: Global Ceramic Tableware Market Volume K Unit Forecast, by Type 2020 & 2033
- Table 43: Global Ceramic Tableware Market Revenue Million Forecast, by End User 2020 & 2033
- Table 44: Global Ceramic Tableware Market Volume K Unit Forecast, by End User 2020 & 2033
- Table 45: Global Ceramic Tableware Market Revenue Million Forecast, by Distribution Channel 2020 & 2033
- Table 46: Global Ceramic Tableware Market Volume K Unit Forecast, by Distribution Channel 2020 & 2033
- Table 47: Global Ceramic Tableware Market Revenue Million Forecast, by Country 2020 & 2033
- Table 48: Global Ceramic Tableware Market Volume K Unit Forecast, by Country 2020 & 2033
Frequently Asked Questions
1. What is the projected Compound Annual Growth Rate (CAGR) of the Ceramic Tableware Market?
The projected CAGR is approximately 6.21%.
2. Which companies are prominent players in the Ceramic Tableware Market?
Key companies in the market include Portmeirion Group PLC, The Oneida Group, Rosenthal GmbH, Lenox, Meissen, Libbey, Seltmann Weiden, RAK Porcelain, Narumi, KAHLA Porzellan, WMF, SCHONWALD, Churchill China, Villeroy & Boch, TATA ceramics, Sitong Group, Fiskars Group.
3. What are the main segments of the Ceramic Tableware Market?
The market segments include Type, End User, Distribution Channel.
4. Can you provide details about the market size?
The market size is estimated to be USD 58.29 Million as of 2022.
5. What are some drivers contributing to market growth?
Increasing Demand for Office Supplies; Growing E-commerce Trends.
6. What are the notable trends driving market growth?
Rapid Growth of Online Sales is Driving the Market.
7. Are there any restraints impacting market growth?
Increasing Digitization of Work and Communication.
8. Can you provide examples of recent developments in the market?
N/A
9. What pricing options are available for accessing the report?
Pricing options include single-user, multi-user, and enterprise licenses priced at USD 4750, USD 5250, and USD 8750 respectively.
10. Is the market size provided in terms of value or volume?
The market size is provided in terms of value, measured in Million and volume, measured in K Unit.
11. Are there any specific market keywords associated with the report?
Yes, the market keyword associated with the report is "Ceramic Tableware Market," which aids in identifying and referencing the specific market segment covered.
12. How do I determine which pricing option suits my needs best?
The pricing options vary based on user requirements and access needs. Individual users may opt for single-user licenses, while businesses requiring broader access may choose multi-user or enterprise licenses for cost-effective access to the report.
13. Are there any additional resources or data provided in the Ceramic Tableware Market report?
While the report offers comprehensive insights, it's advisable to review the specific contents or supplementary materials provided to ascertain if additional resources or data are available.
14. How can I stay updated on further developments or reports in the Ceramic Tableware Market?
To stay informed about further developments, trends, and reports in the Ceramic Tableware Market, consider subscribing to industry newsletters, following relevant companies and organizations, or regularly checking reputable industry news sources and publications.
Methodology
Step 1 - Identification of Relevant Samples Size from Population Database


Step 2 - Approaches for Defining Global Market Size (Value, Volume* & Price*)

Note*: In applicable scenarios
Step 3 - Data Sources
Primary Research
- Web Analytics
- Survey Reports
- Research Institute
- Latest Research Reports
- Opinion Leaders
Secondary Research
- Annual Reports
- White Paper
- Latest Press Release
- Industry Association
- Paid Database
- Investor Presentations

Step 4 - Data Triangulation
Involves using different sources of information in order to increase the validity of a study
These sources are likely to be stakeholders in a program - participants, other researchers, program staff, other community members, and so on.
Then we put all data in single framework & apply various statistical tools to find out the dynamic on the market.
During the analysis stage, feedback from the stakeholder groups would be compared to determine areas of agreement as well as areas of divergence