

Key Insights
The global childcare services market is poised for substantial expansion, propelled by increasing female workforce participation, a growing emphasis on early childhood education, and rising disposable incomes. These drivers collectively elevate demand for accessible and quality care solutions. Technological innovations, including online booking platforms and integrated educational tools, are further optimizing service delivery and user experience. The market encompasses diverse service types such as daycare centers, preschools, and in-home care, catering to various age demographics and geographic regions. Key industry players, including established providers and local enterprises, compete fiercely within this dynamic landscape. Regulatory frameworks and government initiatives significantly influence market operations and growth.
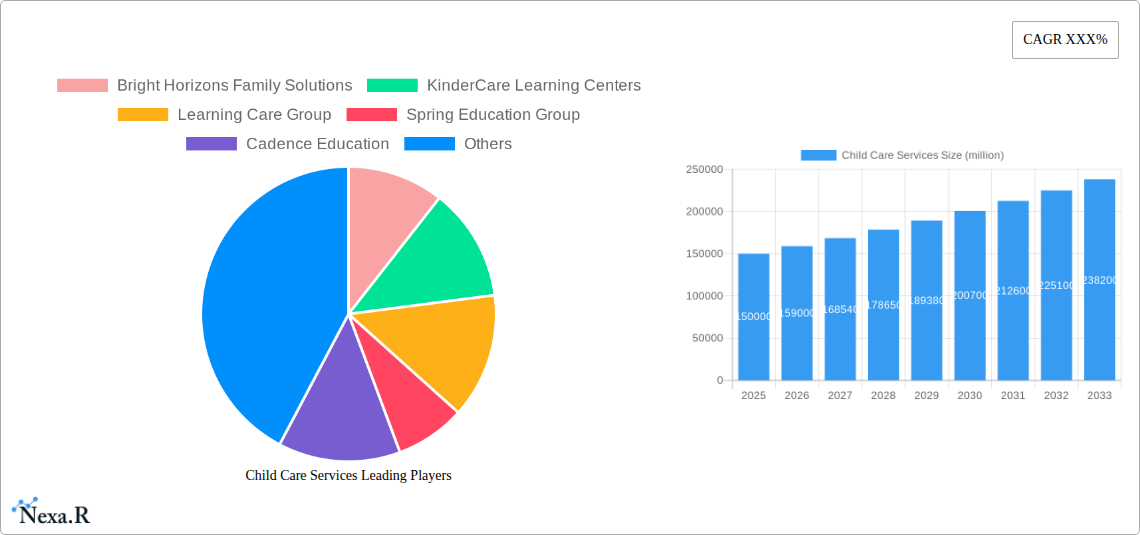
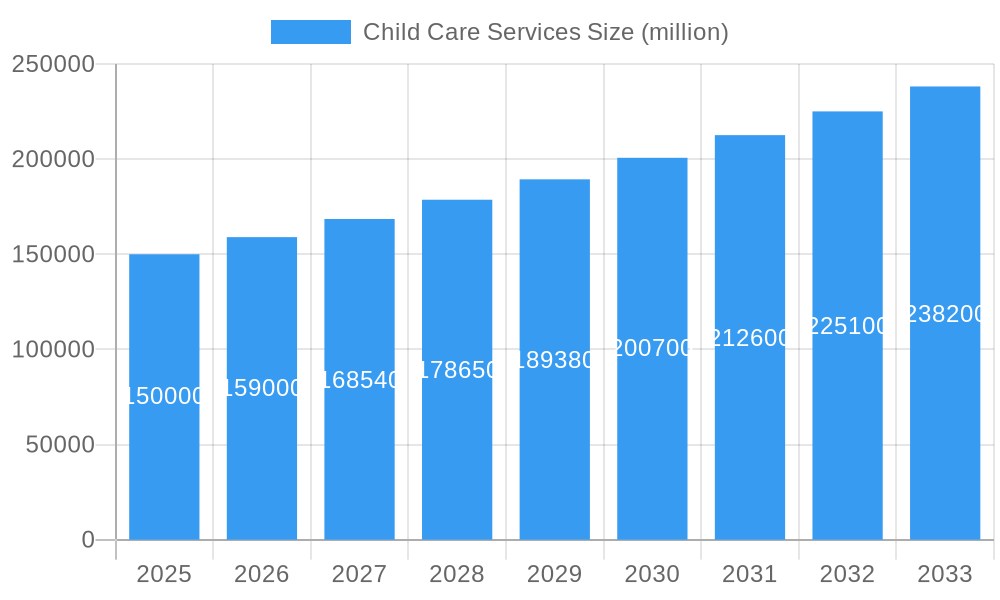
Child Care Services Market Size (In Billion)
Projected to experience a Compound Annual Growth Rate (CAGR) of 4.33%, the global childcare services market is estimated to reach $245.1 billion by 2025. Future growth will be sustained by ongoing urbanization and the prevalence of dual-income households, reinforcing the need for professional childcare. Differentiation will be achieved through innovative curricula and technology adoption. Emerging niche services, such as specialized care for children with disabilities, present significant growth opportunities. Addressing affordability and accessibility remains paramount for equitable access to quality childcare. Strategic collaborations, novel financing strategies, and continued infrastructure investment are vital for sustained market development.
Child Care Services Company Market Share
Child Care Services Market Report: 2019-2033
A comprehensive analysis of the burgeoning child care market, providing invaluable insights for parents, industry professionals, and investors. This report offers a detailed examination of the child care services market, encompassing market size, growth trends, key players, and future projections. With a study period spanning 2019-2033, a base year of 2025, and a forecast period of 2025-2033, this report provides a complete overview of this dynamic sector. The report leverages extensive data analysis to deliver crucial insights into market dynamics, competitive landscapes, and emerging opportunities.
Child Care Services Market Dynamics & Structure
This section delves into the intricate structure of the child care services market, analyzing market concentration, technological innovation drivers, regulatory frameworks, competitive product substitutes, end-user demographics, and M&A trends. The global child care market is estimated to be valued at $xx million in 2025, with a projected Compound Annual Growth Rate (CAGR) of xx% during the forecast period (2025-2033).
- Market Concentration: The market exhibits a moderately concentrated structure, with a few large players holding significant market share. The top five companies, including Bright Horizons Family Solutions, KinderCare Learning Centers, and Learning Care Group, collectively account for approximately xx% of the market.
- Technological Innovation: The sector is witnessing a surge in technological adoption, including online enrollment platforms, educational apps, and digital communication tools. However, barriers to innovation persist, including high implementation costs and a lack of standardized technology across providers.
- Regulatory Landscape: Stringent regulations regarding safety, licensing, and staff-to-child ratios vary across regions, influencing market dynamics and creating entry barriers.
- Competitive Substitutes: Informal care arrangements and family-based care represent primary substitutes, although they lack the structure and regulated quality of professional child care services.
- End-User Demographics: The primary end-users are parents with young children, predominantly from the middle and upper-income classes. However, growing demand for affordable and accessible childcare services is driving market expansion in lower-income demographics.
- M&A Activity: The sector has seen a considerable number of mergers and acquisitions (M&A) in recent years, driven by the desire for expansion, market consolidation, and access to new technologies. An estimated xx M&A deals were concluded during the historical period (2019-2024), resulting in a shift toward larger, more integrated childcare providers.
Child Care Services Growth Trends & Insights
This section presents a detailed analysis of market size evolution, adoption rates, technological disruptions, and consumer behavior shifts in the child care market. The analysis leverages proprietary data and market research to offer a comprehensive view of the industry's growth trajectory. The market size is anticipated to reach $xx million by 2033, driven by several significant factors:
*Rising disposable incomes and dual-income households are fueling demand for professional childcare. The increasing participation of women in the workforce significantly contributes to this trend. *Government initiatives and subsidies aimed at improving childcare affordability and accessibility are boosting market growth. *Technological advancements are enhancing service delivery, increasing efficiency, and improving parental engagement. Adoption rates of digital tools such as online platforms and educational apps are steadily growing. *Consumer behavior is shifting toward a preference for higher-quality childcare services that prioritize education and development, as well as convenience and flexibility.
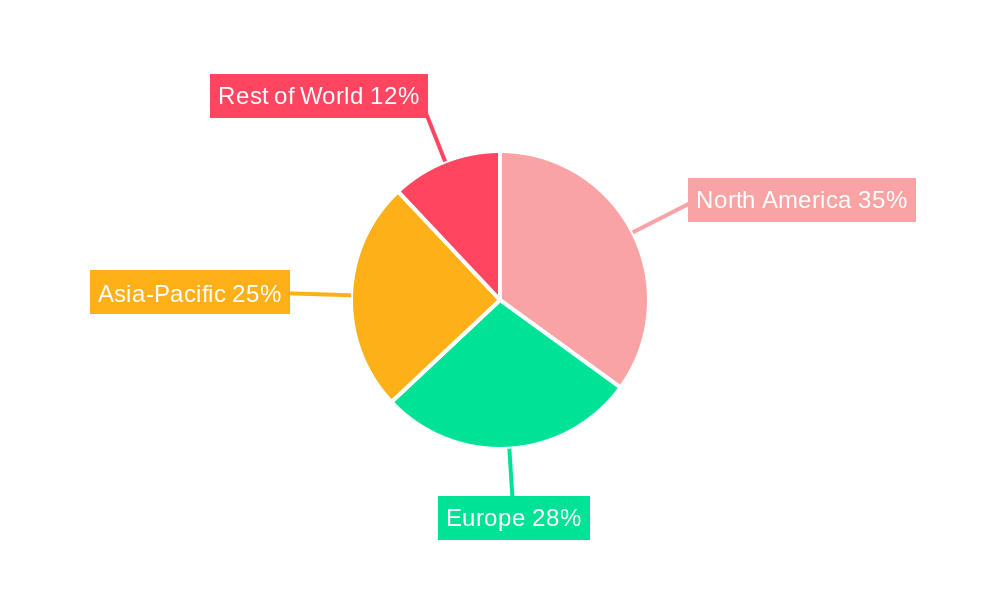
Dominant Regions, Countries, or Segments in Child Care Services
This section identifies the leading regions and segments driving market growth. North America and Europe currently dominate the global market, driven by high disposable incomes, established infrastructure, and supportive government policies. However, Asia-Pacific is projected to witness the fastest growth due to rising urbanization, increasing female labor force participation, and expanding middle-class populations.
- North America: High per capita income, well-established childcare infrastructure, and strong regulatory frameworks make North America a leading region for child care services. The market is characterized by strong competition and a diverse range of providers.
- Europe: Similar to North America, Europe’s mature economy and government support for childcare contribute to its substantial market size. However, variations in regulatory frameworks and childcare models across different countries influence market dynamics.
- Asia-Pacific: This region is poised for significant growth due to rapidly expanding urban populations, increased female employment, and a rising middle class. However, challenges such as limited infrastructure and a shortage of qualified professionals need to be addressed.
Child Care Services Product Landscape
The child care services market offers a variety of products and services, ranging from traditional daycare centers to specialized preschool programs and after-school care. Recent product innovations include personalized learning programs, technologically advanced educational tools, and enhanced safety measures. These innovations are driven by a focus on improving the quality of care, enhancing educational outcomes, and providing better value to parents. Unique selling propositions increasingly focus on specialized curriculums, personalized learning experiences, and convenience features such as extended hours and flexible scheduling.
Key Drivers, Barriers & Challenges in Child Care Services
Key Drivers:
- Increasing female labor force participation.
- Rising disposable incomes among families.
- Government initiatives supporting childcare accessibility and affordability.
- Technological advancements enhancing service delivery and parental engagement.
Key Challenges and Restraints:
- High operating costs and limited profitability for providers. The average operating cost per child is approximately $xx, while the average fee charged is around $xx, leading to tight margins for many childcare providers.
- Stringent regulatory requirements and licensing procedures pose significant barriers to market entry.
- Shortage of qualified and experienced childcare professionals.
- Concerns over child safety and security.
Emerging Opportunities in Child Care Services
Emerging opportunities include the expansion of specialized childcare programs for children with special needs, the integration of technology to enhance learning and parent engagement, and the rise of flexible childcare options tailored to the needs of working parents. Untapped markets exist in underserved communities and rural areas, where access to quality childcare remains limited. The growing demand for early childhood education programs is also driving opportunities for innovative curriculum development and specialized training for childcare professionals.
Growth Accelerators in the Child Care Services Industry
Long-term growth in the child care services industry will be propelled by continued technological advancements, strategic partnerships between childcare providers and educational technology companies, and expansion into new geographical markets. Government policies supporting childcare affordability and accessibility will also play a significant role in stimulating market growth. Additionally, the increasing focus on early childhood development and its long-term impact on children's educational outcomes will contribute to higher demand for high-quality childcare services.
Key Players Shaping the Child Care Services Market
- Bright Horizons Family Solutions
- KinderCare Learning Centers
- Learning Care Group
- Spring Education Group
- Cadence Education
- Primrose School Franchising SPE
- G8 Education Ltd.
- Kitty International School and Preschool
- Klay.co.in
- The Learning Journey Day Nursery Ltd.
- Momyhome Daycare
- Hagugu
- Warmhouse
- Yokid
- Aiduofen Tuoyu
- Happywhale
- GANOR
- Kinderhome
Notable Milestones in Child Care Services Sector
- 2020: Increased adoption of virtual learning platforms in response to the COVID-19 pandemic.
- 2021: Several significant mergers and acquisitions reshaping the market landscape.
- 2022: Launch of several innovative childcare apps focusing on parental engagement and communication.
- 2023: Increased government investment in childcare infrastructure and affordability initiatives.
In-Depth Child Care Services Market Outlook
The child care services market is poised for continued growth over the next decade, driven by several key factors including increasing parental demand, technological advancements, and government support. Strategic opportunities exist for providers to invest in innovative technologies, expand into underserved markets, and differentiate their services through specialized programs and enhanced quality. The future will likely see a greater emphasis on personalized learning, technology integration, and flexible childcare options catering to diverse parental needs.
Child Care Services Segmentation
-
1. Application
- 1.1. Age 2-
- 1.2. Age 2-3
- 1.3. Age 3+
-
2. Type
- 2.1. Center-based
- 2.2. Home-based
Child Care Services Segmentation By Geography
-
1. North America
- 1.1. United States
- 1.2. Canada
- 1.3. Mexico
-
2. South America
- 2.1. Brazil
- 2.2. Argentina
- 2.3. Rest of South America
-
3. Europe
- 3.1. United Kingdom
- 3.2. Germany
- 3.3. France
- 3.4. Italy
- 3.5. Spain
- 3.6. Russia
- 3.7. Benelux
- 3.8. Nordics
- 3.9. Rest of Europe
-
4. Middle East & Africa
- 4.1. Turkey
- 4.2. Israel
- 4.3. GCC
- 4.4. North Africa
- 4.5. South Africa
- 4.6. Rest of Middle East & Africa
-
5. Asia Pacific
- 5.1. China
- 5.2. India
- 5.3. Japan
- 5.4. South Korea
- 5.5. ASEAN
- 5.6. Oceania
- 5.7. Rest of Asia Pacific
Child Care Services Regional Market Share
Geographic Coverage of Child Care Services
Child Care Services REPORT HIGHLIGHTS
| Aspects | Details |
|---|---|
| Study Period | 2020-2034 |
| Base Year | 2025 |
| Estimated Year | 2026 |
| Forecast Period | 2026-2034 |
| Historical Period | 2020-2025 |
| Growth Rate | CAGR of 4.33% from 2020-2034 |
| Segmentation |
|
Table of Contents
- 1. Introduction
- 1.1. Research Scope
- 1.2. Market Segmentation
- 1.3. Research Methodology
- 1.4. Definitions and Assumptions
- 2. Executive Summary
- 2.1. Introduction
- 3. Market Dynamics
- 3.1. Introduction
- 3.2. Market Drivers
- 3.3. Market Restrains
- 3.4. Market Trends
- 4. Market Factor Analysis
- 4.1. Porters Five Forces
- 4.2. Supply/Value Chain
- 4.3. PESTEL analysis
- 4.4. Market Entropy
- 4.5. Patent/Trademark Analysis
- 5. Global Child Care Services Analysis, Insights and Forecast, 2020-2032
- 5.1. Market Analysis, Insights and Forecast - by Application
- 5.1.1. Age 2-
- 5.1.2. Age 2-3
- 5.1.3. Age 3+
- 5.2. Market Analysis, Insights and Forecast - by Type
- 5.2.1. Center-based
- 5.2.2. Home-based
- 5.3. Market Analysis, Insights and Forecast - by Region
- 5.3.1. North America
- 5.3.2. South America
- 5.3.3. Europe
- 5.3.4. Middle East & Africa
- 5.3.5. Asia Pacific
- 5.1. Market Analysis, Insights and Forecast - by Application
- 6. North America Child Care Services Analysis, Insights and Forecast, 2020-2032
- 6.1. Market Analysis, Insights and Forecast - by Application
- 6.1.1. Age 2-
- 6.1.2. Age 2-3
- 6.1.3. Age 3+
- 6.2. Market Analysis, Insights and Forecast - by Type
- 6.2.1. Center-based
- 6.2.2. Home-based
- 6.1. Market Analysis, Insights and Forecast - by Application
- 7. South America Child Care Services Analysis, Insights and Forecast, 2020-2032
- 7.1. Market Analysis, Insights and Forecast - by Application
- 7.1.1. Age 2-
- 7.1.2. Age 2-3
- 7.1.3. Age 3+
- 7.2. Market Analysis, Insights and Forecast - by Type
- 7.2.1. Center-based
- 7.2.2. Home-based
- 7.1. Market Analysis, Insights and Forecast - by Application
- 8. Europe Child Care Services Analysis, Insights and Forecast, 2020-2032
- 8.1. Market Analysis, Insights and Forecast - by Application
- 8.1.1. Age 2-
- 8.1.2. Age 2-3
- 8.1.3. Age 3+
- 8.2. Market Analysis, Insights and Forecast - by Type
- 8.2.1. Center-based
- 8.2.2. Home-based
- 8.1. Market Analysis, Insights and Forecast - by Application
- 9. Middle East & Africa Child Care Services Analysis, Insights and Forecast, 2020-2032
- 9.1. Market Analysis, Insights and Forecast - by Application
- 9.1.1. Age 2-
- 9.1.2. Age 2-3
- 9.1.3. Age 3+
- 9.2. Market Analysis, Insights and Forecast - by Type
- 9.2.1. Center-based
- 9.2.2. Home-based
- 9.1. Market Analysis, Insights and Forecast - by Application
- 10. Asia Pacific Child Care Services Analysis, Insights and Forecast, 2020-2032
- 10.1. Market Analysis, Insights and Forecast - by Application
- 10.1.1. Age 2-
- 10.1.2. Age 2-3
- 10.1.3. Age 3+
- 10.2. Market Analysis, Insights and Forecast - by Type
- 10.2.1. Center-based
- 10.2.2. Home-based
- 10.1. Market Analysis, Insights and Forecast - by Application
- 11. Competitive Analysis
- 11.1. Global Market Share Analysis 2025
- 11.2. Company Profiles
- 11.2.1 Bright Horizons Family Solutions
- 11.2.1.1. Overview
- 11.2.1.2. Products
- 11.2.1.3. SWOT Analysis
- 11.2.1.4. Recent Developments
- 11.2.1.5. Financials (Based on Availability)
- 11.2.2 KinderCare Learning Centers
- 11.2.2.1. Overview
- 11.2.2.2. Products
- 11.2.2.3. SWOT Analysis
- 11.2.2.4. Recent Developments
- 11.2.2.5. Financials (Based on Availability)
- 11.2.3 Learning Care Group
- 11.2.3.1. Overview
- 11.2.3.2. Products
- 11.2.3.3. SWOT Analysis
- 11.2.3.4. Recent Developments
- 11.2.3.5. Financials (Based on Availability)
- 11.2.4 Spring Education Group
- 11.2.4.1. Overview
- 11.2.4.2. Products
- 11.2.4.3. SWOT Analysis
- 11.2.4.4. Recent Developments
- 11.2.4.5. Financials (Based on Availability)
- 11.2.5 Cadence Education
- 11.2.5.1. Overview
- 11.2.5.2. Products
- 11.2.5.3. SWOT Analysis
- 11.2.5.4. Recent Developments
- 11.2.5.5. Financials (Based on Availability)
- 11.2.6 Primrose School Franchising SPE
- 11.2.6.1. Overview
- 11.2.6.2. Products
- 11.2.6.3. SWOT Analysis
- 11.2.6.4. Recent Developments
- 11.2.6.5. Financials (Based on Availability)
- 11.2.7 G8 Education Ltd.
- 11.2.7.1. Overview
- 11.2.7.2. Products
- 11.2.7.3. SWOT Analysis
- 11.2.7.4. Recent Developments
- 11.2.7.5. Financials (Based on Availability)
- 11.2.8 Kitty International School and Preschool
- 11.2.8.1. Overview
- 11.2.8.2. Products
- 11.2.8.3. SWOT Analysis
- 11.2.8.4. Recent Developments
- 11.2.8.5. Financials (Based on Availability)
- 11.2.9 Klay.co.in
- 11.2.9.1. Overview
- 11.2.9.2. Products
- 11.2.9.3. SWOT Analysis
- 11.2.9.4. Recent Developments
- 11.2.9.5. Financials (Based on Availability)
- 11.2.10 The Learning Journey Day Nursery Ltd.
- 11.2.10.1. Overview
- 11.2.10.2. Products
- 11.2.10.3. SWOT Analysis
- 11.2.10.4. Recent Developments
- 11.2.10.5. Financials (Based on Availability)
- 11.2.11 Momyhome Daycare
- 11.2.11.1. Overview
- 11.2.11.2. Products
- 11.2.11.3. SWOT Analysis
- 11.2.11.4. Recent Developments
- 11.2.11.5. Financials (Based on Availability)
- 11.2.12 Hagugu
- 11.2.12.1. Overview
- 11.2.12.2. Products
- 11.2.12.3. SWOT Analysis
- 11.2.12.4. Recent Developments
- 11.2.12.5. Financials (Based on Availability)
- 11.2.13 Warmhouse
- 11.2.13.1. Overview
- 11.2.13.2. Products
- 11.2.13.3. SWOT Analysis
- 11.2.13.4. Recent Developments
- 11.2.13.5. Financials (Based on Availability)
- 11.2.14 Yokid
- 11.2.14.1. Overview
- 11.2.14.2. Products
- 11.2.14.3. SWOT Analysis
- 11.2.14.4. Recent Developments
- 11.2.14.5. Financials (Based on Availability)
- 11.2.15 Aiduofen Tuoyu
- 11.2.15.1. Overview
- 11.2.15.2. Products
- 11.2.15.3. SWOT Analysis
- 11.2.15.4. Recent Developments
- 11.2.15.5. Financials (Based on Availability)
- 11.2.16 Happywhale
- 11.2.16.1. Overview
- 11.2.16.2. Products
- 11.2.16.3. SWOT Analysis
- 11.2.16.4. Recent Developments
- 11.2.16.5. Financials (Based on Availability)
- 11.2.17 GANOR
- 11.2.17.1. Overview
- 11.2.17.2. Products
- 11.2.17.3. SWOT Analysis
- 11.2.17.4. Recent Developments
- 11.2.17.5. Financials (Based on Availability)
- 11.2.18 Kinderhome
- 11.2.18.1. Overview
- 11.2.18.2. Products
- 11.2.18.3. SWOT Analysis
- 11.2.18.4. Recent Developments
- 11.2.18.5. Financials (Based on Availability)
- 11.2.1 Bright Horizons Family Solutions
List of Figures
- Figure 1: Global Child Care Services Revenue Breakdown (billion, %) by Region 2025 & 2033
- Figure 2: North America Child Care Services Revenue (billion), by Application 2025 & 2033
- Figure 3: North America Child Care Services Revenue Share (%), by Application 2025 & 2033
- Figure 4: North America Child Care Services Revenue (billion), by Type 2025 & 2033
- Figure 5: North America Child Care Services Revenue Share (%), by Type 2025 & 2033
- Figure 6: North America Child Care Services Revenue (billion), by Country 2025 & 2033
- Figure 7: North America Child Care Services Revenue Share (%), by Country 2025 & 2033
- Figure 8: South America Child Care Services Revenue (billion), by Application 2025 & 2033
- Figure 9: South America Child Care Services Revenue Share (%), by Application 2025 & 2033
- Figure 10: South America Child Care Services Revenue (billion), by Type 2025 & 2033
- Figure 11: South America Child Care Services Revenue Share (%), by Type 2025 & 2033
- Figure 12: South America Child Care Services Revenue (billion), by Country 2025 & 2033
- Figure 13: South America Child Care Services Revenue Share (%), by Country 2025 & 2033
- Figure 14: Europe Child Care Services Revenue (billion), by Application 2025 & 2033
- Figure 15: Europe Child Care Services Revenue Share (%), by Application 2025 & 2033
- Figure 16: Europe Child Care Services Revenue (billion), by Type 2025 & 2033
- Figure 17: Europe Child Care Services Revenue Share (%), by Type 2025 & 2033
- Figure 18: Europe Child Care Services Revenue (billion), by Country 2025 & 2033
- Figure 19: Europe Child Care Services Revenue Share (%), by Country 2025 & 2033
- Figure 20: Middle East & Africa Child Care Services Revenue (billion), by Application 2025 & 2033
- Figure 21: Middle East & Africa Child Care Services Revenue Share (%), by Application 2025 & 2033
- Figure 22: Middle East & Africa Child Care Services Revenue (billion), by Type 2025 & 2033
- Figure 23: Middle East & Africa Child Care Services Revenue Share (%), by Type 2025 & 2033
- Figure 24: Middle East & Africa Child Care Services Revenue (billion), by Country 2025 & 2033
- Figure 25: Middle East & Africa Child Care Services Revenue Share (%), by Country 2025 & 2033
- Figure 26: Asia Pacific Child Care Services Revenue (billion), by Application 2025 & 2033
- Figure 27: Asia Pacific Child Care Services Revenue Share (%), by Application 2025 & 2033
- Figure 28: Asia Pacific Child Care Services Revenue (billion), by Type 2025 & 2033
- Figure 29: Asia Pacific Child Care Services Revenue Share (%), by Type 2025 & 2033
- Figure 30: Asia Pacific Child Care Services Revenue (billion), by Country 2025 & 2033
- Figure 31: Asia Pacific Child Care Services Revenue Share (%), by Country 2025 & 2033
List of Tables
- Table 1: Global Child Care Services Revenue billion Forecast, by Application 2020 & 2033
- Table 2: Global Child Care Services Revenue billion Forecast, by Type 2020 & 2033
- Table 3: Global Child Care Services Revenue billion Forecast, by Region 2020 & 2033
- Table 4: Global Child Care Services Revenue billion Forecast, by Application 2020 & 2033
- Table 5: Global Child Care Services Revenue billion Forecast, by Type 2020 & 2033
- Table 6: Global Child Care Services Revenue billion Forecast, by Country 2020 & 2033
- Table 7: United States Child Care Services Revenue (billion) Forecast, by Application 2020 & 2033
- Table 8: Canada Child Care Services Revenue (billion) Forecast, by Application 2020 & 2033
- Table 9: Mexico Child Care Services Revenue (billion) Forecast, by Application 2020 & 2033
- Table 10: Global Child Care Services Revenue billion Forecast, by Application 2020 & 2033
- Table 11: Global Child Care Services Revenue billion Forecast, by Type 2020 & 2033
- Table 12: Global Child Care Services Revenue billion Forecast, by Country 2020 & 2033
- Table 13: Brazil Child Care Services Revenue (billion) Forecast, by Application 2020 & 2033
- Table 14: Argentina Child Care Services Revenue (billion) Forecast, by Application 2020 & 2033
- Table 15: Rest of South America Child Care Services Revenue (billion) Forecast, by Application 2020 & 2033
- Table 16: Global Child Care Services Revenue billion Forecast, by Application 2020 & 2033
- Table 17: Global Child Care Services Revenue billion Forecast, by Type 2020 & 2033
- Table 18: Global Child Care Services Revenue billion Forecast, by Country 2020 & 2033
- Table 19: United Kingdom Child Care Services Revenue (billion) Forecast, by Application 2020 & 2033
- Table 20: Germany Child Care Services Revenue (billion) Forecast, by Application 2020 & 2033
- Table 21: France Child Care Services Revenue (billion) Forecast, by Application 2020 & 2033
- Table 22: Italy Child Care Services Revenue (billion) Forecast, by Application 2020 & 2033
- Table 23: Spain Child Care Services Revenue (billion) Forecast, by Application 2020 & 2033
- Table 24: Russia Child Care Services Revenue (billion) Forecast, by Application 2020 & 2033
- Table 25: Benelux Child Care Services Revenue (billion) Forecast, by Application 2020 & 2033
- Table 26: Nordics Child Care Services Revenue (billion) Forecast, by Application 2020 & 2033
- Table 27: Rest of Europe Child Care Services Revenue (billion) Forecast, by Application 2020 & 2033
- Table 28: Global Child Care Services Revenue billion Forecast, by Application 2020 & 2033
- Table 29: Global Child Care Services Revenue billion Forecast, by Type 2020 & 2033
- Table 30: Global Child Care Services Revenue billion Forecast, by Country 2020 & 2033
- Table 31: Turkey Child Care Services Revenue (billion) Forecast, by Application 2020 & 2033
- Table 32: Israel Child Care Services Revenue (billion) Forecast, by Application 2020 & 2033
- Table 33: GCC Child Care Services Revenue (billion) Forecast, by Application 2020 & 2033
- Table 34: North Africa Child Care Services Revenue (billion) Forecast, by Application 2020 & 2033
- Table 35: South Africa Child Care Services Revenue (billion) Forecast, by Application 2020 & 2033
- Table 36: Rest of Middle East & Africa Child Care Services Revenue (billion) Forecast, by Application 2020 & 2033
- Table 37: Global Child Care Services Revenue billion Forecast, by Application 2020 & 2033
- Table 38: Global Child Care Services Revenue billion Forecast, by Type 2020 & 2033
- Table 39: Global Child Care Services Revenue billion Forecast, by Country 2020 & 2033
- Table 40: China Child Care Services Revenue (billion) Forecast, by Application 2020 & 2033
- Table 41: India Child Care Services Revenue (billion) Forecast, by Application 2020 & 2033
- Table 42: Japan Child Care Services Revenue (billion) Forecast, by Application 2020 & 2033
- Table 43: South Korea Child Care Services Revenue (billion) Forecast, by Application 2020 & 2033
- Table 44: ASEAN Child Care Services Revenue (billion) Forecast, by Application 2020 & 2033
- Table 45: Oceania Child Care Services Revenue (billion) Forecast, by Application 2020 & 2033
- Table 46: Rest of Asia Pacific Child Care Services Revenue (billion) Forecast, by Application 2020 & 2033
Frequently Asked Questions
1. What is the projected Compound Annual Growth Rate (CAGR) of the Child Care Services?
The projected CAGR is approximately 4.33%.
2. Which companies are prominent players in the Child Care Services?
Key companies in the market include Bright Horizons Family Solutions, KinderCare Learning Centers, Learning Care Group, Spring Education Group, Cadence Education, Primrose School Franchising SPE, G8 Education Ltd., Kitty International School and Preschool, Klay.co.in, The Learning Journey Day Nursery Ltd., Momyhome Daycare, Hagugu, Warmhouse, Yokid, Aiduofen Tuoyu, Happywhale, GANOR, Kinderhome.
3. What are the main segments of the Child Care Services?
The market segments include Application, Type.
4. Can you provide details about the market size?
The market size is estimated to be USD 245.1 billion as of 2022.
5. What are some drivers contributing to market growth?
N/A
6. What are the notable trends driving market growth?
N/A
7. Are there any restraints impacting market growth?
N/A
8. Can you provide examples of recent developments in the market?
N/A
9. What pricing options are available for accessing the report?
Pricing options include single-user, multi-user, and enterprise licenses priced at USD 2900.00, USD 4350.00, and USD 5800.00 respectively.
10. Is the market size provided in terms of value or volume?
The market size is provided in terms of value, measured in billion.
11. Are there any specific market keywords associated with the report?
Yes, the market keyword associated with the report is "Child Care Services," which aids in identifying and referencing the specific market segment covered.
12. How do I determine which pricing option suits my needs best?
The pricing options vary based on user requirements and access needs. Individual users may opt for single-user licenses, while businesses requiring broader access may choose multi-user or enterprise licenses for cost-effective access to the report.
13. Are there any additional resources or data provided in the Child Care Services report?
While the report offers comprehensive insights, it's advisable to review the specific contents or supplementary materials provided to ascertain if additional resources or data are available.
14. How can I stay updated on further developments or reports in the Child Care Services?
To stay informed about further developments, trends, and reports in the Child Care Services, consider subscribing to industry newsletters, following relevant companies and organizations, or regularly checking reputable industry news sources and publications.
Methodology
Step 1 - Identification of Relevant Samples Size from Population Database


Step 2 - Approaches for Defining Global Market Size (Value, Volume* & Price*)

Note*: In applicable scenarios
Step 3 - Data Sources
Primary Research
- Web Analytics
- Survey Reports
- Research Institute
- Latest Research Reports
- Opinion Leaders
Secondary Research
- Annual Reports
- White Paper
- Latest Press Release
- Industry Association
- Paid Database
- Investor Presentations

Step 4 - Data Triangulation
Involves using different sources of information in order to increase the validity of a study
These sources are likely to be stakeholders in a program - participants, other researchers, program staff, other community members, and so on.
Then we put all data in single framework & apply various statistical tools to find out the dynamic on the market.
During the analysis stage, feedback from the stakeholder groups would be compared to determine areas of agreement as well as areas of divergence