

Key Insights
The China Oil & Gas Upstream industry is poised for significant expansion, driven by escalating domestic energy needs and strategic government initiatives. Projected to reach $77.69 billion by 2025, the sector is expected to witness a Compound Annual Growth Rate (CAGR) of 5.15% through 2033. Key growth drivers include robust economic expansion, increasing industrialization, and government mandates for energy independence. Technological advancements, particularly in Enhanced Oil Recovery (EOR), are further stimulating investment and operational efficiency across crude oil, natural gas, and natural gas liquids (NGLs) segments. Exploration efforts are expanding across both onshore and offshore territories, while development and production are focused on existing and emerging reserves.
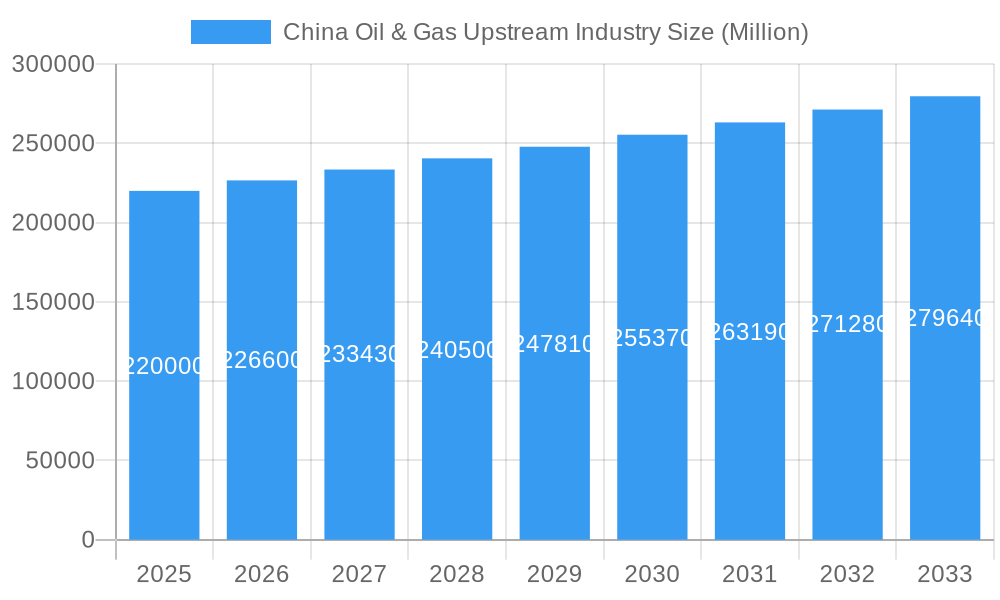
China Oil & Gas Upstream Industry Market Size (In Billion)
Despite facing challenges such as volatile global oil prices, stringent environmental regulations, and geopolitical risks, the long-term outlook for China's upstream oil and gas sector remains positive. The competitive landscape is characterized by dominant state-owned enterprises including China National Petroleum Corporation (CNPC), China National Offshore Oil Corporation (CNOOC), and China Petroleum & Chemical Corporation (Sinopec), alongside international major players. These entities are actively investing in exploration, production, and technology to sustain market leadership. The Asia-Pacific region, with China as a focal point, continues to be a critical market. Regional variations in resource availability and regulatory environments will shape investment strategies. The upcoming forecast period will emphasize optimizing current production, discovering new reserves, and adopting cutting-edge technologies to improve efficiency and minimize environmental impact. A comprehensive understanding of these dynamics is essential for strategic success in the China Oil & Gas Upstream market.
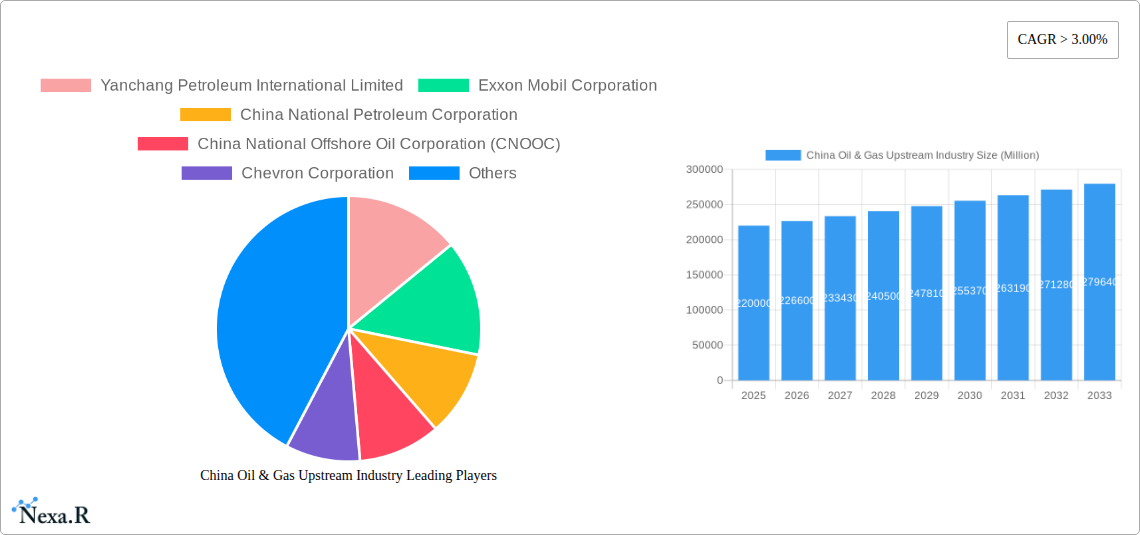
China Oil & Gas Upstream Industry Company Market Share
China Oil & Gas Upstream Industry: A Comprehensive Market Report (2019-2033)
This in-depth report provides a comprehensive analysis of China's oil and gas upstream industry, encompassing market dynamics, growth trends, key players, and future outlook. Targeting industry professionals, investors, and researchers, this report offers invaluable insights into this dynamic sector. The study period covers 2019-2033, with a base year of 2025 and a forecast period of 2025-2033. The parent market is the China Energy Sector, with the child market being the China Oil & Gas Upstream Industry.
China Oil & Gas Upstream Industry Market Dynamics & Structure
This section analyzes the competitive landscape, technological advancements, regulatory influences, and market trends within China's oil and gas upstream sector. The market exhibits a high degree of concentration, with state-owned enterprises (SOEs) holding significant market share. However, international players also maintain a presence.
- Market Concentration: The top 5 players (CNPC, Sinopec, CNOOC, PetroChina, and international players like ExxonMobil and Shell) account for approximately xx% of the market share in 2025.
- Technological Innovation: Focus areas include enhanced oil recovery (EOR) techniques, shale gas exploration, and digitalization of operations. Innovation barriers include high capital expenditure requirements and regulatory complexities.
- Regulatory Framework: Government policies play a vital role, promoting domestic energy security and supporting technological advancements. Regulatory changes may influence investment decisions and operational strategies.
- Competitive Substitutes: Renewable energy sources present a growing challenge, necessitating strategic adaptation by oil and gas companies. The increasing adoption of electric vehicles also poses indirect competitive pressure.
- M&A Trends: The sector witnessed xx M&A deals in the period 2019-2024 with a total value of xx Million, primarily focused on consolidating assets and enhancing technological capabilities. This trend is expected to continue during the forecast period.
- End-User Demographics: The primary end-users are domestic refineries and petrochemical plants, with increasing exports to international markets.
China Oil & Gas Upstream Industry Growth Trends & Insights
China's oil and gas upstream industry demonstrates consistent growth, driven by robust domestic demand and strategic government initiatives. The market size is expected to reach xx Million in 2025 and xx Million by 2033, exhibiting a CAGR of xx% during the forecast period. This growth is fueled by several factors including increasing energy consumption, infrastructure development, and technological advancements in exploration and production. Adoption rates of advanced technologies are gradually increasing, contributing to improved efficiency and productivity. Shifts in consumer behavior are less directly impactful in this B2B sector, but government policies driving energy mix diversification create a dynamic market landscape.
Dominant Regions, Countries, or Segments in China Oil & Gas Upstream Industry
The Tarim Basin, with its substantial oil and gas reserves, remains the dominant region, accounting for xx% of total production. Other key regions include the Songliao Basin and the Sichuan Basin.
- By Type of Resource: Crude oil currently dominates production, followed by natural gas and NGLs. Natural gas production is witnessing rapid growth due to government initiatives promoting cleaner energy.
- By Exploration and Production Stage: The development stage currently dominates, reflecting the focus on maximizing output from existing fields. Exploration activities are concentrated in frontier basins, with potential for significant new discoveries.
- Key Drivers: Government support, including exploration incentives, infrastructure development, and favorable regulatory frameworks significantly impact growth. Economic growth and urbanization are strong underlying factors.
China Oil & Gas Upstream Industry Product Landscape
Product innovations focus on enhancing efficiency and reducing environmental impact. This includes advancements in drilling technologies, improved reservoir management techniques, and the application of digital technologies for optimizing production. Unique selling propositions lie in the efficiency and cost-effectiveness of tailored solutions for specific geological formations and environmental contexts. Technological advancements like AI-powered predictive maintenance are increasing operational uptime and reducing costs.
Key Drivers, Barriers & Challenges in China Oil & Gas Upstream Industry
Key Drivers: Rising domestic energy demand, government support for energy security, technological breakthroughs, and increasing investment in exploration and production activities are key drivers.
Key Challenges: Declining domestic crude oil production, environmental concerns associated with fossil fuel extraction, geopolitical risks, and competition from renewable energy sources pose significant challenges. These factors lead to price volatility and exert pressure on profitability margins. Supply chain disruptions and regulatory changes could also influence the industry's long-term trajectory.
Emerging Opportunities in China Oil & Gas Upstream Industry
Opportunities lie in the development of unconventional resources (shale oil and gas), the expansion of natural gas infrastructure, and the application of advanced technologies to enhance exploration and production efficiency. Exploration in frontier basins holds considerable potential for new discoveries, while the integration of digital technologies offers significant cost-saving and efficiency-boosting opportunities. Strategic partnerships between domestic and international players could further accelerate the industry’s development.
Growth Accelerators in the China Oil & Gas Upstream Industry Industry
Technological advancements in EOR techniques and digitalization, coupled with strategic government support and investments in infrastructure, will be key growth catalysts. The development of unconventional resources and integration with the broader energy sector further unlock significant potential.
Key Players Shaping the China Oil & Gas Upstream Industry Market
Notable Milestones in China Oil & Gas Upstream Industry Sector
- August 2021: PetroChina announced a 1.268 billion-ton shale oil discovery in the Songliao Basin.
- June 2021: CNPC discovered a 1-billion-ton super-deep oil and gas area in the Tarim Basin.
- January 2022: Sinopec discovered a new oil and gas area with approximately 100 million tons of reserves in the Tarim Basin. These discoveries significantly impact market dynamics by increasing reserves and production potential.
In-Depth China Oil & Gas Upstream Industry Market Outlook
The China oil and gas upstream industry is poised for sustained growth, driven by robust domestic demand and technological advancements. Strategic investments in exploration and production, coupled with government support for energy security, will propel market expansion. Opportunities in unconventional resources and digitalization will shape the sector's future trajectory, creating a promising landscape for both domestic and international players.
China Oil & Gas Upstream Industry Segmentation
- 1. Onshore
- 2. Offshore
China Oil & Gas Upstream Industry Segmentation By Geography
- 1. China
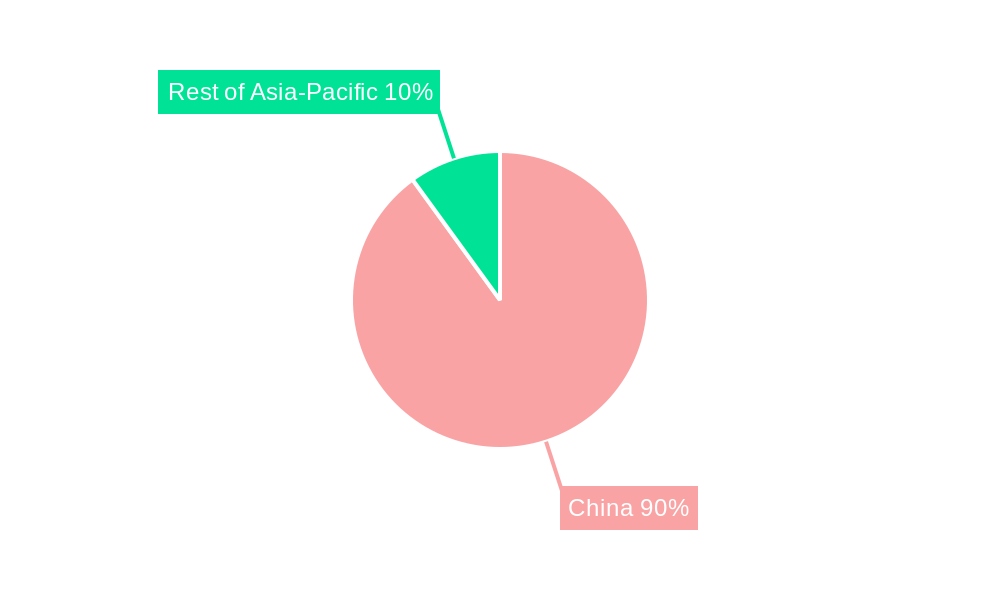
China Oil & Gas Upstream Industry Regional Market Share
Geographic Coverage of China Oil & Gas Upstream Industry
China Oil & Gas Upstream Industry REPORT HIGHLIGHTS
| Aspects | Details |
|---|---|
| Study Period | 2020-2034 |
| Base Year | 2025 |
| Estimated Year | 2026 |
| Forecast Period | 2026-2034 |
| Historical Period | 2020-2025 |
| Growth Rate | CAGR of 5.15% from 2020-2034 |
| Segmentation |
|
Table of Contents
- 1. Introduction
- 1.1. Research Scope
- 1.2. Market Segmentation
- 1.3. Research Objective
- 1.4. Definitions and Assumptions
- 2. Executive Summary
- 2.1. Market Snapshot
- 3. Market Dynamics
- 3.1. Market Drivers
- 3.2. Market Restrains
- 3.3. Market Trends
- 3.4. Market Opportunities
- 4. Market Factor Analysis
- 4.1. Porters Five Forces
- 4.1.1. Bargaining Power of Suppliers
- 4.1.2. Bargaining Power of Buyers
- 4.1.3. Threat of New Entrants
- 4.1.4. Threat of Substitutes
- 4.1.5. Competitive Rivalry
- 4.2. PESTEL analysis
- 4.3. BCG Analysis
- 4.3.1. Stars (High Growth, High Market Share)
- 4.3.2. Cash Cows (Low Growth, High Market Share)
- 4.3.3. Question Mark (High Growth, Low Market Share)
- 4.3.4. Dogs (Low Growth, Low Market Share)
- 4.4. Ansoff Matrix Analysis
- 4.5. Supply Chain Analysis
- 4.6. Regulatory Landscape
- 4.7. Current Market Potential and Opportunity Assessment (TAM–SAM–SOM Framework)
- 4.8. NRP Analyst Note
- 4.1. Porters Five Forces
- 5. Market Analysis, Insights and Forecast 2021-2033
- 5.1. Market Analysis, Insights and Forecast - by Onshore
- 5.2. Market Analysis, Insights and Forecast - by Offshore
- 5.3. Market Analysis, Insights and Forecast - by Region
- 5.3.1. China
- 6. China Oil & Gas Upstream Industry Analysis, Insights and Forecast, 2021-2033
- 6.1. Market Analysis, Insights and Forecast - by Onshore
- 6.2. Market Analysis, Insights and Forecast - by Offshore
- 7. Competitive Analysis
- 7.1. Company Profiles
- 7.1.1 Yanchang Petroleum International Limited
- 7.1.1.1. Company Overview
- 7.1.1.2. Products
- 7.1.1.3. Company Financials
- 7.1.1.4. SWOT Analysis
- 7.1.2 Exxon Mobil Corporation
- 7.1.2.1. Company Overview
- 7.1.2.2. Products
- 7.1.2.3. Company Financials
- 7.1.2.4. SWOT Analysis
- 7.1.3 China National Petroleum Corporation
- 7.1.3.1. Company Overview
- 7.1.3.2. Products
- 7.1.3.3. Company Financials
- 7.1.3.4. SWOT Analysis
- 7.1.4 China National Offshore Oil Corporation (CNOOC)
- 7.1.4.1. Company Overview
- 7.1.4.2. Products
- 7.1.4.3. Company Financials
- 7.1.4.4. SWOT Analysis
- 7.1.5 Chevron Corporation
- 7.1.5.1. Company Overview
- 7.1.5.2. Products
- 7.1.5.3. Company Financials
- 7.1.5.4. SWOT Analysis
- 7.1.6 BP PLC
- 7.1.6.1. Company Overview
- 7.1.6.2. Products
- 7.1.6.3. Company Financials
- 7.1.6.4. SWOT Analysis
- 7.1.7 Shell PLC*List Not Exhaustive
- 7.1.7.1. Company Overview
- 7.1.7.2. Products
- 7.1.7.3. Company Financials
- 7.1.7.4. SWOT Analysis
- 7.1.8 China Petroleum & Chemical Corporation (Sinopec)
- 7.1.8.1. Company Overview
- 7.1.8.2. Products
- 7.1.8.3. Company Financials
- 7.1.8.4. SWOT Analysis
- 7.1.1 Yanchang Petroleum International Limited
- 7.2. Market Entropy
- 7.2.1 Company's Key Areas Served
- 7.2.2 Recent Developments
- 7.3. Company Market Share Analysis 2025
- 7.3.1 Top 5 Companies Market Share Analysis
- 7.3.2 Top 3 Companies Market Share Analysis
- 7.4. List of Potential Customers
- 8. Research Methodology
List of Figures
- Figure 1: China Oil & Gas Upstream Industry Revenue Breakdown (billion, %) by Product 2025 & 2033
- Figure 2: China Oil & Gas Upstream Industry Share (%) by Company 2025
List of Tables
- Table 1: China Oil & Gas Upstream Industry Revenue billion Forecast, by Onshore 2020 & 2033
- Table 2: China Oil & Gas Upstream Industry Revenue billion Forecast, by Offshore 2020 & 2033
- Table 3: China Oil & Gas Upstream Industry Revenue billion Forecast, by Region 2020 & 2033
- Table 4: China Oil & Gas Upstream Industry Revenue billion Forecast, by Onshore 2020 & 2033
- Table 5: China Oil & Gas Upstream Industry Revenue billion Forecast, by Offshore 2020 & 2033
- Table 6: China Oil & Gas Upstream Industry Revenue billion Forecast, by Country 2020 & 2033
Frequently Asked Questions
1. What is the projected Compound Annual Growth Rate (CAGR) of the China Oil & Gas Upstream Industry?
The projected CAGR is approximately 5.15%.
2. Which companies are prominent players in the China Oil & Gas Upstream Industry?
Key companies in the market include Yanchang Petroleum International Limited, Exxon Mobil Corporation, China National Petroleum Corporation, China National Offshore Oil Corporation (CNOOC), Chevron Corporation, BP PLC, Shell PLC*List Not Exhaustive, China Petroleum & Chemical Corporation (Sinopec).
3. What are the main segments of the China Oil & Gas Upstream Industry?
The market segments include Onshore, Offshore.
4. Can you provide details about the market size?
The market size is estimated to be USD 77.69 billion as of 2022.
5. What are some drivers contributing to market growth?
4.; Increasing Electricity Demand4.; Rsing Investments in the Coal Industry.
6. What are the notable trends driving market growth?
Offshore Segment to Dominate the Market.
7. Are there any restraints impacting market growth?
4.; Increasing Installation of Renewable Energy Sources.
8. Can you provide examples of recent developments in the market?
In January 2022, Sinopec discovered a new oil and gas area with approximately 100 million tons of reserves in the Tarim Basin of northwest China's Xinjiang Uygur Autonomous Region. These latest reserves in Sinopec's Shunbei oil and gas field are estimated to provide 88 million tons of condensate oil and 290 billion cubic meters of natural gas.
9. What pricing options are available for accessing the report?
Pricing options include single-user, multi-user, and enterprise licenses priced at USD 3800, USD 4500, and USD 5800 respectively.
10. Is the market size provided in terms of value or volume?
The market size is provided in terms of value, measured in billion.
11. Are there any specific market keywords associated with the report?
Yes, the market keyword associated with the report is "China Oil & Gas Upstream Industry," which aids in identifying and referencing the specific market segment covered.
12. How do I determine which pricing option suits my needs best?
The pricing options vary based on user requirements and access needs. Individual users may opt for single-user licenses, while businesses requiring broader access may choose multi-user or enterprise licenses for cost-effective access to the report.
13. Are there any additional resources or data provided in the China Oil & Gas Upstream Industry report?
While the report offers comprehensive insights, it's advisable to review the specific contents or supplementary materials provided to ascertain if additional resources or data are available.
14. How can I stay updated on further developments or reports in the China Oil & Gas Upstream Industry?
To stay informed about further developments, trends, and reports in the China Oil & Gas Upstream Industry, consider subscribing to industry newsletters, following relevant companies and organizations, or regularly checking reputable industry news sources and publications.
Methodology
Step 1 - Identification of Relevant Samples Size from Population Database


Step 2 - Approaches for Defining Global Market Size (Value, Volume* & Price*)

Note*: In applicable scenarios
Step 3 - Data Sources
Primary Research
- Web Analytics
- Survey Reports
- Research Institute
- Latest Research Reports
- Opinion Leaders
Secondary Research
- Annual Reports
- White Paper
- Latest Press Release
- Industry Association
- Paid Database
- Investor Presentations

Step 4 - Data Triangulation
Involves using different sources of information in order to increase the validity of a study
These sources are likely to be stakeholders in a program - participants, other researchers, program staff, other community members, and so on.
Then we put all data in single framework & apply various statistical tools to find out the dynamic on the market.
During the analysis stage, feedback from the stakeholder groups would be compared to determine areas of agreement as well as areas of divergence