

Key Insights
The global chlorella tablets market is experiencing robust growth, driven by increasing consumer awareness of health and wellness, coupled with the rising popularity of dietary supplements. Chlorella, a nutrient-rich green algae, offers a potent blend of vitamins, minerals, and antioxidants, making it an attractive choice for health-conscious individuals seeking to boost their immune system and overall well-being. The market's expansion is fueled by several key factors, including the increasing prevalence of chronic diseases, the growing demand for natural and organic health products, and the expanding availability of chlorella tablets through various retail channels, both online and offline. This surge in demand has attracted numerous players, including both established food and supplement companies and emerging brands focusing on niche health segments. Competitive landscape analysis shows significant activity around product innovation, including enhanced formulations with added nutrients or improved bioavailability, and targeted marketing campaigns emphasizing specific health benefits. Geographic expansion into developing markets with growing middle classes and increasing disposable incomes further contributes to market expansion.
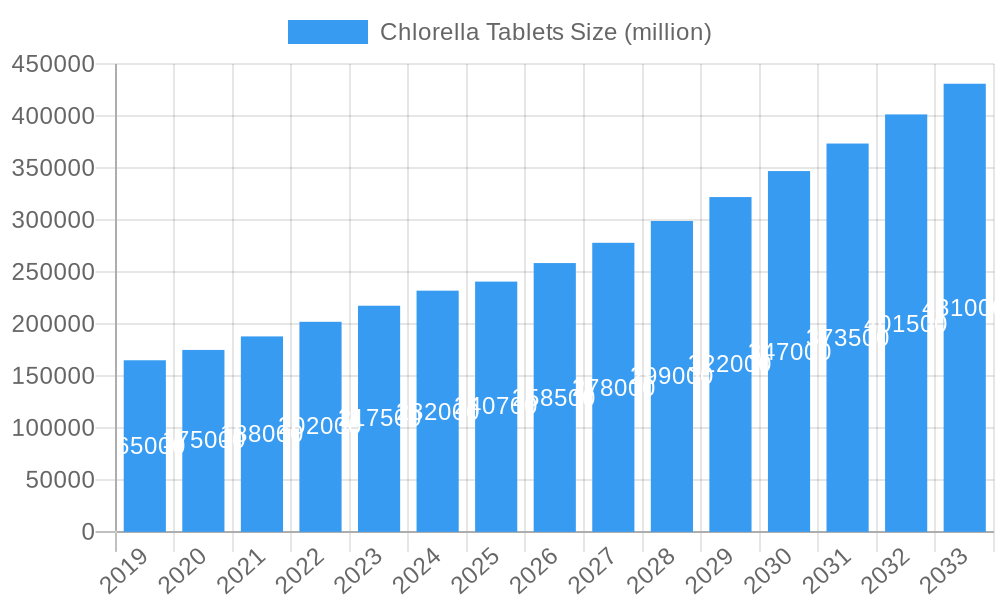
Chlorella Tablets Market Size (In Million)
While the market presents a promising outlook, certain challenges remain. Price volatility in raw materials, stringent regulatory requirements in some regions, and potential supply chain disruptions can influence market stability. However, ongoing research into the therapeutic potential of chlorella and its various bioactive compounds is expected to stimulate further growth. The market segmentation reveals varying demand patterns across different regions, reflecting variations in consumer preferences, cultural norms, and levels of health awareness. The projected growth trajectory suggests significant opportunities for established and new market entrants, particularly those focused on product differentiation, effective marketing strategies, and sustainable sourcing practices.
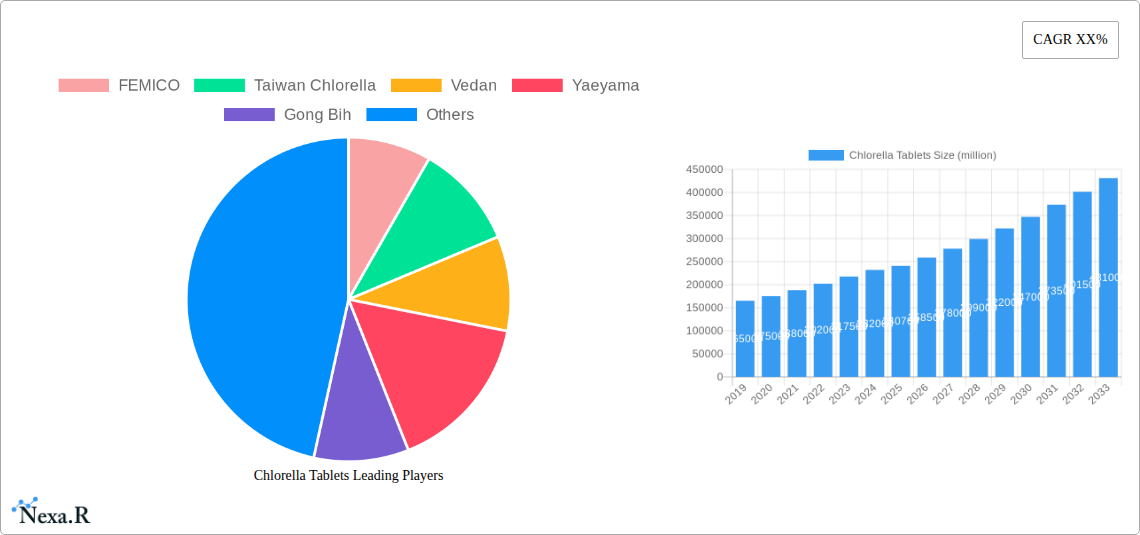
Chlorella Tablets Company Market Share
Chlorella Tablets Market Report: 2019-2033 - A Comprehensive Analysis
This comprehensive report provides an in-depth analysis of the global Chlorella Tablets market, offering valuable insights for industry professionals, investors, and stakeholders. The report covers the period 2019-2033, with a focus on the forecast period 2025-2033 and a base year of 2025. It examines market dynamics, growth trends, key players, and future opportunities within the broader health supplement and functional food markets (parent market) with a specific focus on chlorella tablets (child market). The report leverages extensive market research and data analysis to provide actionable intelligence.
Chlorella Tablets Market Dynamics & Structure
The global Chlorella Tablets market is characterized by moderate concentration, with key players holding significant market share. Technological innovations, particularly in extraction and processing techniques to enhance bioavailability, are key drivers. Regulatory frameworks concerning dietary supplements vary across regions, influencing market access and growth. Competitive substitutes include other nutrient-rich algae and green superfoods. The end-user demographic is largely health-conscious consumers seeking natural health solutions, with a growing interest among athletes and wellness enthusiasts. M&A activity within the sector has been moderate, primarily focused on expanding production capacity and distribution networks.
- Market Concentration: Moderately concentrated, with top 5 players holding xx% market share in 2025.
- Technological Innovation: Focus on improving chlorella bioavailability and product formulation.
- Regulatory Landscape: Varies significantly across regions, impacting market access.
- Competitive Substitutes: Spirulina, other green superfoods, and vitamin/mineral supplements.
- End-User Demographics: Primarily health-conscious adults, athletes, and wellness enthusiasts.
- M&A Activity: xx deals recorded between 2019-2024, primarily focused on expansion and distribution.
Chlorella Tablets Growth Trends & Insights
The Chlorella Tablets market has witnessed consistent growth over the historical period (2019-2024), driven by increasing consumer awareness of health benefits and the rising demand for natural supplements. The market size is projected to reach xx million units by 2025, expanding at a CAGR of xx% during the forecast period (2025-2033). This growth is fueled by technological advancements leading to improved product quality and efficacy. Changing consumer preferences towards natural and functional foods further contribute to market expansion. Market penetration remains relatively low in several developing economies, indicating significant growth potential.
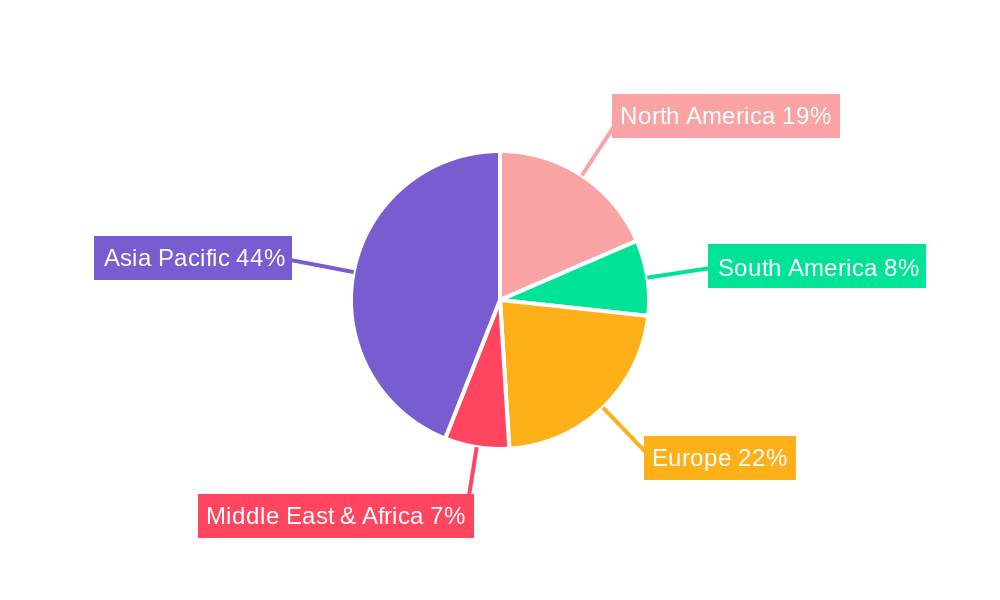
Dominant Regions, Countries, or Segments in Chlorella Tablets
North America and Asia-Pacific currently dominate the Chlorella Tablets market, driven by high consumer awareness of health benefits and established distribution networks. Within Asia-Pacific, Japan and China are key markets, fueled by strong domestic production and consumption. Growth in these regions is driven by factors such as rising disposable incomes, increasing health consciousness, and growing demand for natural health solutions.
- North America: High consumer awareness, strong distribution networks, and established regulatory frameworks.
- Asia-Pacific (Japan & China): High consumption, robust domestic production, and rising health consciousness.
- Europe: Growing demand driven by increasing health concerns and expanding awareness of natural supplements.
- Market Share: North America holds xx% market share, while Asia-Pacific holds xx% in 2025.
Chlorella Tablets Product Landscape
Chlorella tablets are available in various forms, including regular tablets, high-potency tablets, and tablets with added nutrients or functional ingredients. Product innovation focuses on enhancing bioavailability through improved extraction methods and developing new formulations to enhance absorption and efficacy. Key selling propositions include high nutritional content, natural origin, and purported health benefits. Technological advancements concentrate on standardized extraction techniques, ensuring consistent quality and potency.
Key Drivers, Barriers & Challenges in Chlorella Tablets
Key Drivers:
- Rising consumer awareness of health benefits.
- Growing demand for natural health solutions and functional foods.
- Technological advancements improving product quality and bioavailability.
Challenges & Restraints:
- Price sensitivity in some markets.
- Varying regulatory landscapes across regions.
- Potential for contamination and quality inconsistencies in raw materials.
- Intense competition among numerous brands and manufacturers.
Emerging Opportunities in Chlorella Tablets
Untapped markets in developing economies present significant growth potential. Innovative applications, such as incorporating chlorella into functional foods and beverages, are gaining traction. The focus is shifting towards customized products catering to specific health needs and demographic preferences. The increasing demand for sustainable and ethically sourced products creates further opportunities.
Growth Accelerators in the Chlorella Tablets Industry
Strategic partnerships and collaborations among manufacturers and distributors can accelerate market expansion. Technological breakthroughs in extraction and processing will lead to higher quality, more bioavailable products. Expanding into untapped markets through targeted marketing campaigns and distribution channel development will further drive growth.
Key Players Shaping the Chlorella Tablets Market
- FEMICO
- Taiwan Chlorella
- Vedan
- Yaeyama
- Gong Bih
- Sun Chlorella
- Wilson
- King Dnarmsa
Notable Milestones in Chlorella Tablets Sector
- 2020: Increased regulatory scrutiny of dietary supplements in several key markets.
- 2022: Launch of several new chlorella tablet formulations with enhanced bioavailability.
- 2023: Several key players invested in expanding production capacity.
In-Depth Chlorella Tablets Market Outlook
The Chlorella Tablets market is poised for significant growth over the next decade, driven by sustained consumer demand, technological advancements, and expansion into new markets. Strategic partnerships and focused marketing initiatives will play a key role in driving future growth. Companies focusing on product innovation, sustainable sourcing, and efficient distribution channels are well-positioned to capitalize on emerging opportunities.
Chlorella Tablets Segmentation
-
1. Application
- 1.1. Food Industry
- 1.2. Feed Industry
- 1.3. Pharmaceutical Industry
- 1.4. Others
-
2. Type
- 2.1. Chlorella Vulgaris
- 2.2. Chlorella Pyrenoidosa
Chlorella Tablets Segmentation By Geography
-
1. North America
- 1.1. United States
- 1.2. Canada
- 1.3. Mexico
-
2. South America
- 2.1. Brazil
- 2.2. Argentina
- 2.3. Rest of South America
-
3. Europe
- 3.1. United Kingdom
- 3.2. Germany
- 3.3. France
- 3.4. Italy
- 3.5. Spain
- 3.6. Russia
- 3.7. Benelux
- 3.8. Nordics
- 3.9. Rest of Europe
-
4. Middle East & Africa
- 4.1. Turkey
- 4.2. Israel
- 4.3. GCC
- 4.4. North Africa
- 4.5. South Africa
- 4.6. Rest of Middle East & Africa
-
5. Asia Pacific
- 5.1. China
- 5.2. India
- 5.3. Japan
- 5.4. South Korea
- 5.5. ASEAN
- 5.6. Oceania
- 5.7. Rest of Asia Pacific
Chlorella Tablets Regional Market Share
Geographic Coverage of Chlorella Tablets
Chlorella Tablets REPORT HIGHLIGHTS
| Aspects | Details |
|---|---|
| Study Period | 2020-2034 |
| Base Year | 2025 |
| Estimated Year | 2026 |
| Forecast Period | 2026-2034 |
| Historical Period | 2020-2025 |
| Growth Rate | CAGR of 7.89% from 2020-2034 |
| Segmentation |
|
Table of Contents
- 1. Introduction
- 1.1. Research Scope
- 1.2. Market Segmentation
- 1.3. Research Methodology
- 1.4. Definitions and Assumptions
- 2. Executive Summary
- 2.1. Introduction
- 3. Market Dynamics
- 3.1. Introduction
- 3.2. Market Drivers
- 3.3. Market Restrains
- 3.4. Market Trends
- 4. Market Factor Analysis
- 4.1. Porters Five Forces
- 4.2. Supply/Value Chain
- 4.3. PESTEL analysis
- 4.4. Market Entropy
- 4.5. Patent/Trademark Analysis
- 5. Global Chlorella Tablets Analysis, Insights and Forecast, 2020-2032
- 5.1. Market Analysis, Insights and Forecast - by Application
- 5.1.1. Food Industry
- 5.1.2. Feed Industry
- 5.1.3. Pharmaceutical Industry
- 5.1.4. Others
- 5.2. Market Analysis, Insights and Forecast - by Type
- 5.2.1. Chlorella Vulgaris
- 5.2.2. Chlorella Pyrenoidosa
- 5.3. Market Analysis, Insights and Forecast - by Region
- 5.3.1. North America
- 5.3.2. South America
- 5.3.3. Europe
- 5.3.4. Middle East & Africa
- 5.3.5. Asia Pacific
- 5.1. Market Analysis, Insights and Forecast - by Application
- 6. North America Chlorella Tablets Analysis, Insights and Forecast, 2020-2032
- 6.1. Market Analysis, Insights and Forecast - by Application
- 6.1.1. Food Industry
- 6.1.2. Feed Industry
- 6.1.3. Pharmaceutical Industry
- 6.1.4. Others
- 6.2. Market Analysis, Insights and Forecast - by Type
- 6.2.1. Chlorella Vulgaris
- 6.2.2. Chlorella Pyrenoidosa
- 6.1. Market Analysis, Insights and Forecast - by Application
- 7. South America Chlorella Tablets Analysis, Insights and Forecast, 2020-2032
- 7.1. Market Analysis, Insights and Forecast - by Application
- 7.1.1. Food Industry
- 7.1.2. Feed Industry
- 7.1.3. Pharmaceutical Industry
- 7.1.4. Others
- 7.2. Market Analysis, Insights and Forecast - by Type
- 7.2.1. Chlorella Vulgaris
- 7.2.2. Chlorella Pyrenoidosa
- 7.1. Market Analysis, Insights and Forecast - by Application
- 8. Europe Chlorella Tablets Analysis, Insights and Forecast, 2020-2032
- 8.1. Market Analysis, Insights and Forecast - by Application
- 8.1.1. Food Industry
- 8.1.2. Feed Industry
- 8.1.3. Pharmaceutical Industry
- 8.1.4. Others
- 8.2. Market Analysis, Insights and Forecast - by Type
- 8.2.1. Chlorella Vulgaris
- 8.2.2. Chlorella Pyrenoidosa
- 8.1. Market Analysis, Insights and Forecast - by Application
- 9. Middle East & Africa Chlorella Tablets Analysis, Insights and Forecast, 2020-2032
- 9.1. Market Analysis, Insights and Forecast - by Application
- 9.1.1. Food Industry
- 9.1.2. Feed Industry
- 9.1.3. Pharmaceutical Industry
- 9.1.4. Others
- 9.2. Market Analysis, Insights and Forecast - by Type
- 9.2.1. Chlorella Vulgaris
- 9.2.2. Chlorella Pyrenoidosa
- 9.1. Market Analysis, Insights and Forecast - by Application
- 10. Asia Pacific Chlorella Tablets Analysis, Insights and Forecast, 2020-2032
- 10.1. Market Analysis, Insights and Forecast - by Application
- 10.1.1. Food Industry
- 10.1.2. Feed Industry
- 10.1.3. Pharmaceutical Industry
- 10.1.4. Others
- 10.2. Market Analysis, Insights and Forecast - by Type
- 10.2.1. Chlorella Vulgaris
- 10.2.2. Chlorella Pyrenoidosa
- 10.1. Market Analysis, Insights and Forecast - by Application
- 11. Competitive Analysis
- 11.1. Global Market Share Analysis 2025
- 11.2. Company Profiles
- 11.2.1 FEMICO
- 11.2.1.1. Overview
- 11.2.1.2. Products
- 11.2.1.3. SWOT Analysis
- 11.2.1.4. Recent Developments
- 11.2.1.5. Financials (Based on Availability)
- 11.2.2 Taiwan Chlorella
- 11.2.2.1. Overview
- 11.2.2.2. Products
- 11.2.2.3. SWOT Analysis
- 11.2.2.4. Recent Developments
- 11.2.2.5. Financials (Based on Availability)
- 11.2.3 Vedan
- 11.2.3.1. Overview
- 11.2.3.2. Products
- 11.2.3.3. SWOT Analysis
- 11.2.3.4. Recent Developments
- 11.2.3.5. Financials (Based on Availability)
- 11.2.4 Yaeyama
- 11.2.4.1. Overview
- 11.2.4.2. Products
- 11.2.4.3. SWOT Analysis
- 11.2.4.4. Recent Developments
- 11.2.4.5. Financials (Based on Availability)
- 11.2.5 Gong Bih
- 11.2.5.1. Overview
- 11.2.5.2. Products
- 11.2.5.3. SWOT Analysis
- 11.2.5.4. Recent Developments
- 11.2.5.5. Financials (Based on Availability)
- 11.2.6 Sun Chlorella
- 11.2.6.1. Overview
- 11.2.6.2. Products
- 11.2.6.3. SWOT Analysis
- 11.2.6.4. Recent Developments
- 11.2.6.5. Financials (Based on Availability)
- 11.2.7 Wilson
- 11.2.7.1. Overview
- 11.2.7.2. Products
- 11.2.7.3. SWOT Analysis
- 11.2.7.4. Recent Developments
- 11.2.7.5. Financials (Based on Availability)
- 11.2.8 King Dnarmsa
- 11.2.8.1. Overview
- 11.2.8.2. Products
- 11.2.8.3. SWOT Analysis
- 11.2.8.4. Recent Developments
- 11.2.8.5. Financials (Based on Availability)
- 11.2.1 FEMICO
List of Figures
- Figure 1: Global Chlorella Tablets Revenue Breakdown (undefined, %) by Region 2025 & 2033
- Figure 2: North America Chlorella Tablets Revenue (undefined), by Application 2025 & 2033
- Figure 3: North America Chlorella Tablets Revenue Share (%), by Application 2025 & 2033
- Figure 4: North America Chlorella Tablets Revenue (undefined), by Type 2025 & 2033
- Figure 5: North America Chlorella Tablets Revenue Share (%), by Type 2025 & 2033
- Figure 6: North America Chlorella Tablets Revenue (undefined), by Country 2025 & 2033
- Figure 7: North America Chlorella Tablets Revenue Share (%), by Country 2025 & 2033
- Figure 8: South America Chlorella Tablets Revenue (undefined), by Application 2025 & 2033
- Figure 9: South America Chlorella Tablets Revenue Share (%), by Application 2025 & 2033
- Figure 10: South America Chlorella Tablets Revenue (undefined), by Type 2025 & 2033
- Figure 11: South America Chlorella Tablets Revenue Share (%), by Type 2025 & 2033
- Figure 12: South America Chlorella Tablets Revenue (undefined), by Country 2025 & 2033
- Figure 13: South America Chlorella Tablets Revenue Share (%), by Country 2025 & 2033
- Figure 14: Europe Chlorella Tablets Revenue (undefined), by Application 2025 & 2033
- Figure 15: Europe Chlorella Tablets Revenue Share (%), by Application 2025 & 2033
- Figure 16: Europe Chlorella Tablets Revenue (undefined), by Type 2025 & 2033
- Figure 17: Europe Chlorella Tablets Revenue Share (%), by Type 2025 & 2033
- Figure 18: Europe Chlorella Tablets Revenue (undefined), by Country 2025 & 2033
- Figure 19: Europe Chlorella Tablets Revenue Share (%), by Country 2025 & 2033
- Figure 20: Middle East & Africa Chlorella Tablets Revenue (undefined), by Application 2025 & 2033
- Figure 21: Middle East & Africa Chlorella Tablets Revenue Share (%), by Application 2025 & 2033
- Figure 22: Middle East & Africa Chlorella Tablets Revenue (undefined), by Type 2025 & 2033
- Figure 23: Middle East & Africa Chlorella Tablets Revenue Share (%), by Type 2025 & 2033
- Figure 24: Middle East & Africa Chlorella Tablets Revenue (undefined), by Country 2025 & 2033
- Figure 25: Middle East & Africa Chlorella Tablets Revenue Share (%), by Country 2025 & 2033
- Figure 26: Asia Pacific Chlorella Tablets Revenue (undefined), by Application 2025 & 2033
- Figure 27: Asia Pacific Chlorella Tablets Revenue Share (%), by Application 2025 & 2033
- Figure 28: Asia Pacific Chlorella Tablets Revenue (undefined), by Type 2025 & 2033
- Figure 29: Asia Pacific Chlorella Tablets Revenue Share (%), by Type 2025 & 2033
- Figure 30: Asia Pacific Chlorella Tablets Revenue (undefined), by Country 2025 & 2033
- Figure 31: Asia Pacific Chlorella Tablets Revenue Share (%), by Country 2025 & 2033
List of Tables
- Table 1: Global Chlorella Tablets Revenue undefined Forecast, by Application 2020 & 2033
- Table 2: Global Chlorella Tablets Revenue undefined Forecast, by Type 2020 & 2033
- Table 3: Global Chlorella Tablets Revenue undefined Forecast, by Region 2020 & 2033
- Table 4: Global Chlorella Tablets Revenue undefined Forecast, by Application 2020 & 2033
- Table 5: Global Chlorella Tablets Revenue undefined Forecast, by Type 2020 & 2033
- Table 6: Global Chlorella Tablets Revenue undefined Forecast, by Country 2020 & 2033
- Table 7: United States Chlorella Tablets Revenue (undefined) Forecast, by Application 2020 & 2033
- Table 8: Canada Chlorella Tablets Revenue (undefined) Forecast, by Application 2020 & 2033
- Table 9: Mexico Chlorella Tablets Revenue (undefined) Forecast, by Application 2020 & 2033
- Table 10: Global Chlorella Tablets Revenue undefined Forecast, by Application 2020 & 2033
- Table 11: Global Chlorella Tablets Revenue undefined Forecast, by Type 2020 & 2033
- Table 12: Global Chlorella Tablets Revenue undefined Forecast, by Country 2020 & 2033
- Table 13: Brazil Chlorella Tablets Revenue (undefined) Forecast, by Application 2020 & 2033
- Table 14: Argentina Chlorella Tablets Revenue (undefined) Forecast, by Application 2020 & 2033
- Table 15: Rest of South America Chlorella Tablets Revenue (undefined) Forecast, by Application 2020 & 2033
- Table 16: Global Chlorella Tablets Revenue undefined Forecast, by Application 2020 & 2033
- Table 17: Global Chlorella Tablets Revenue undefined Forecast, by Type 2020 & 2033
- Table 18: Global Chlorella Tablets Revenue undefined Forecast, by Country 2020 & 2033
- Table 19: United Kingdom Chlorella Tablets Revenue (undefined) Forecast, by Application 2020 & 2033
- Table 20: Germany Chlorella Tablets Revenue (undefined) Forecast, by Application 2020 & 2033
- Table 21: France Chlorella Tablets Revenue (undefined) Forecast, by Application 2020 & 2033
- Table 22: Italy Chlorella Tablets Revenue (undefined) Forecast, by Application 2020 & 2033
- Table 23: Spain Chlorella Tablets Revenue (undefined) Forecast, by Application 2020 & 2033
- Table 24: Russia Chlorella Tablets Revenue (undefined) Forecast, by Application 2020 & 2033
- Table 25: Benelux Chlorella Tablets Revenue (undefined) Forecast, by Application 2020 & 2033
- Table 26: Nordics Chlorella Tablets Revenue (undefined) Forecast, by Application 2020 & 2033
- Table 27: Rest of Europe Chlorella Tablets Revenue (undefined) Forecast, by Application 2020 & 2033
- Table 28: Global Chlorella Tablets Revenue undefined Forecast, by Application 2020 & 2033
- Table 29: Global Chlorella Tablets Revenue undefined Forecast, by Type 2020 & 2033
- Table 30: Global Chlorella Tablets Revenue undefined Forecast, by Country 2020 & 2033
- Table 31: Turkey Chlorella Tablets Revenue (undefined) Forecast, by Application 2020 & 2033
- Table 32: Israel Chlorella Tablets Revenue (undefined) Forecast, by Application 2020 & 2033
- Table 33: GCC Chlorella Tablets Revenue (undefined) Forecast, by Application 2020 & 2033
- Table 34: North Africa Chlorella Tablets Revenue (undefined) Forecast, by Application 2020 & 2033
- Table 35: South Africa Chlorella Tablets Revenue (undefined) Forecast, by Application 2020 & 2033
- Table 36: Rest of Middle East & Africa Chlorella Tablets Revenue (undefined) Forecast, by Application 2020 & 2033
- Table 37: Global Chlorella Tablets Revenue undefined Forecast, by Application 2020 & 2033
- Table 38: Global Chlorella Tablets Revenue undefined Forecast, by Type 2020 & 2033
- Table 39: Global Chlorella Tablets Revenue undefined Forecast, by Country 2020 & 2033
- Table 40: China Chlorella Tablets Revenue (undefined) Forecast, by Application 2020 & 2033
- Table 41: India Chlorella Tablets Revenue (undefined) Forecast, by Application 2020 & 2033
- Table 42: Japan Chlorella Tablets Revenue (undefined) Forecast, by Application 2020 & 2033
- Table 43: South Korea Chlorella Tablets Revenue (undefined) Forecast, by Application 2020 & 2033
- Table 44: ASEAN Chlorella Tablets Revenue (undefined) Forecast, by Application 2020 & 2033
- Table 45: Oceania Chlorella Tablets Revenue (undefined) Forecast, by Application 2020 & 2033
- Table 46: Rest of Asia Pacific Chlorella Tablets Revenue (undefined) Forecast, by Application 2020 & 2033
Frequently Asked Questions
1. What is the projected Compound Annual Growth Rate (CAGR) of the Chlorella Tablets?
The projected CAGR is approximately 7.89%.
2. Which companies are prominent players in the Chlorella Tablets?
Key companies in the market include FEMICO, Taiwan Chlorella, Vedan, Yaeyama, Gong Bih, Sun Chlorella, Wilson, King Dnarmsa.
3. What are the main segments of the Chlorella Tablets?
The market segments include Application, Type.
4. Can you provide details about the market size?
The market size is estimated to be USD XXX N/A as of 2022.
5. What are some drivers contributing to market growth?
N/A
6. What are the notable trends driving market growth?
N/A
7. Are there any restraints impacting market growth?
N/A
8. Can you provide examples of recent developments in the market?
N/A
9. What pricing options are available for accessing the report?
Pricing options include single-user, multi-user, and enterprise licenses priced at USD 2900.00, USD 4350.00, and USD 5800.00 respectively.
10. Is the market size provided in terms of value or volume?
The market size is provided in terms of value, measured in N/A.
11. Are there any specific market keywords associated with the report?
Yes, the market keyword associated with the report is "Chlorella Tablets," which aids in identifying and referencing the specific market segment covered.
12. How do I determine which pricing option suits my needs best?
The pricing options vary based on user requirements and access needs. Individual users may opt for single-user licenses, while businesses requiring broader access may choose multi-user or enterprise licenses for cost-effective access to the report.
13. Are there any additional resources or data provided in the Chlorella Tablets report?
While the report offers comprehensive insights, it's advisable to review the specific contents or supplementary materials provided to ascertain if additional resources or data are available.
14. How can I stay updated on further developments or reports in the Chlorella Tablets?
To stay informed about further developments, trends, and reports in the Chlorella Tablets, consider subscribing to industry newsletters, following relevant companies and organizations, or regularly checking reputable industry news sources and publications.
Methodology
Step 1 - Identification of Relevant Samples Size from Population Database


Step 2 - Approaches for Defining Global Market Size (Value, Volume* & Price*)

Note*: In applicable scenarios
Step 3 - Data Sources
Primary Research
- Web Analytics
- Survey Reports
- Research Institute
- Latest Research Reports
- Opinion Leaders
Secondary Research
- Annual Reports
- White Paper
- Latest Press Release
- Industry Association
- Paid Database
- Investor Presentations

Step 4 - Data Triangulation
Involves using different sources of information in order to increase the validity of a study
These sources are likely to be stakeholders in a program - participants, other researchers, program staff, other community members, and so on.
Then we put all data in single framework & apply various statistical tools to find out the dynamic on the market.
During the analysis stage, feedback from the stakeholder groups would be compared to determine areas of agreement as well as areas of divergence