

Key Insights
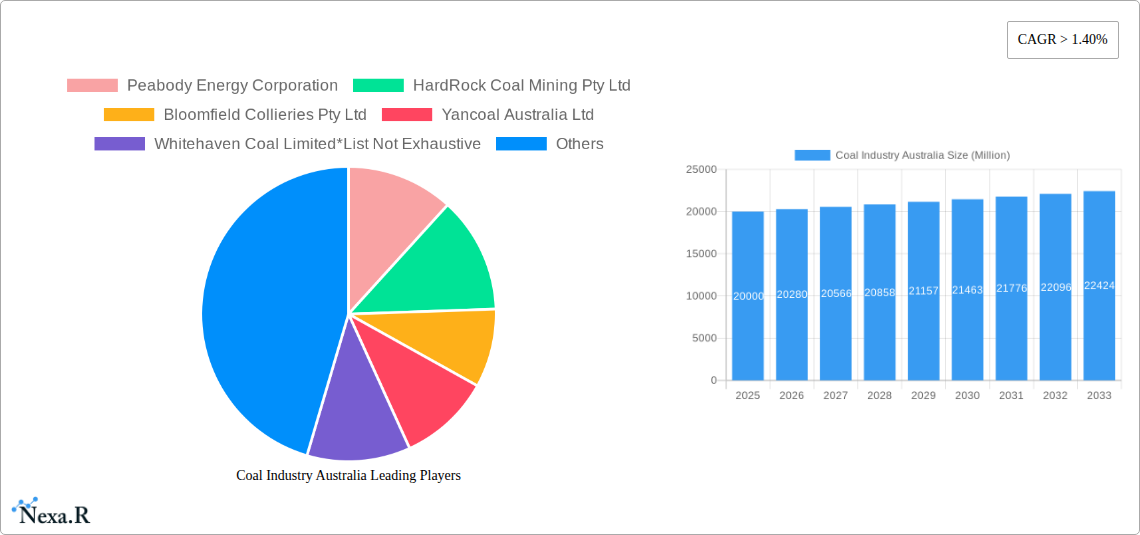
The Australian coal market, despite global decarbonization pressures, demonstrates resilience driven by robust domestic consumption and sustained export demand, primarily from Asian markets. The market was valued at $57 billion in 2024 and is projected to grow at a Compound Annual Growth Rate (CAGR) of 2.2% during the forecast period (2025-2033). Key growth drivers include consistent demand from power generation, especially in developing Asian economies, and significant requirements from the steelmaking and industrial sectors. However, the industry faces substantial challenges, including stringent environmental regulations targeting greenhouse gas emissions and increasing investor focus on Environmental, Social, and Governance (ESG) criteria. Market segmentation into thermal coal, coking coal, and semi-soft coking coal highlights diverse applications and varying sensitivities to environmental policies. The market is dominated by key players such as Peabody Energy Corporation, Yancoal Australia Ltd, and Whitehaven Coal Limited, indicating a consolidated industry structure. Future expansion will depend on the industry's ability to adapt to the evolving regulatory environment and balance coal demand with the global shift towards cleaner energy sources. Growth in specific segments will be contingent on Australian producers meeting rigorous quality standards and adapting to changing international trade dynamics, emphasizing efficiency and sustainable operational practices.
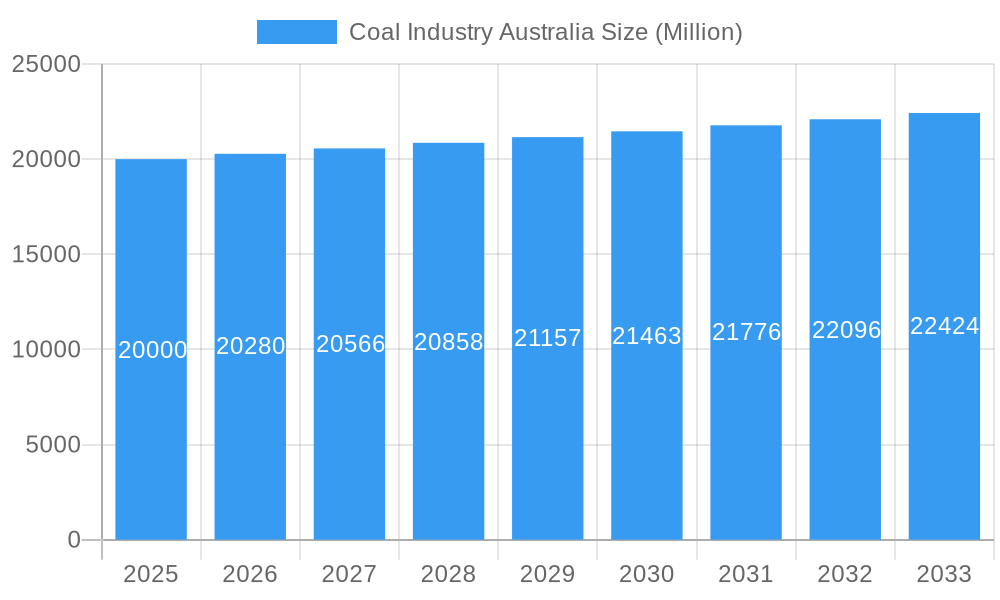
Coal Industry Australia Market Size (In Billion)
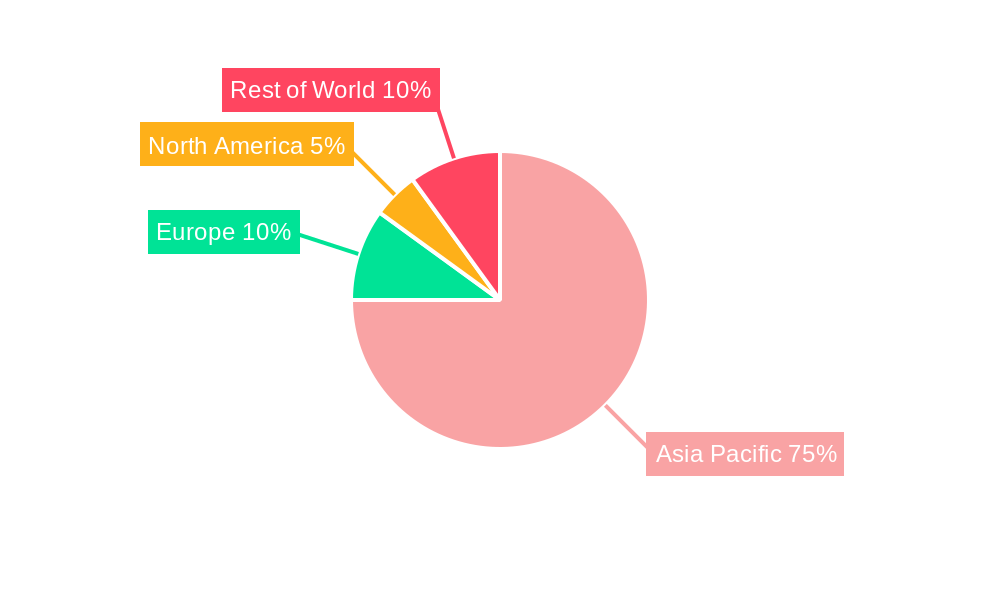
The Asia-Pacific region, encompassing China, Japan, India, and South Korea, is critical for Australian coal exports. Future projections for the Australian coal market must account for policy shifts supporting renewable energy, international trade agreements, and technological advancements in coal extraction and utilization, all of which will significantly influence market dynamics. Continued investment in infrastructure and exploration will be vital for the long-term viability of the Australian coal industry. Strategic diversification within the sector, including the exploration of carbon capture and storage (CCS) technologies and enhanced mine safety and environmental responsibility initiatives, is recommended to bolster sustainability and ensure long-term competitiveness.
Coal Industry Australia Company Market Share
Coal Industry Australia Market Report: 2019-2033
Uncover the Dynamics of Australia's Coal Sector: A Comprehensive Market Analysis (2019-2033)
This in-depth report provides a comprehensive analysis of the Australian coal industry, offering invaluable insights for industry professionals, investors, and policymakers. Covering the period 2019-2033, with a base year of 2025, this report meticulously examines market dynamics, growth trends, key players, and future opportunities within the Australian coal market. The study segments the market by coal type (Thermal Coal, Coking Coal, Semi-Soft Coking Coal) and end-use (Power Generation, Steelmaking, Industrial Applications), offering granular detail on market size, growth projections, and dominant players. This report is crucial for understanding the evolving landscape of the Australian coal industry and making informed strategic decisions.
Coal Industry Australia Market Dynamics & Structure
This section analyzes the competitive landscape of the Australian coal industry, considering market concentration, technological innovation, regulatory frameworks, and the influence of substitute products. The analysis incorporates both quantitative and qualitative data, including market share percentages and M&A activity.
Market Concentration: The Australian coal market is characterized by a moderately concentrated structure, with several major players holding significant market share. The top five companies – Peabody Energy Corporation, Yancoal Australia Ltd, Whitehaven Coal Limited, BHP Group Ltd, and Centennial Coal Company Ltd – control approximately xx% of the total market, with the remaining share distributed amongst numerous smaller players.
Technological Innovation: Technological advancements, such as improved mining techniques and coal processing technologies, are driving efficiency gains and cost reductions. However, innovation is hampered by high capital expenditure requirements and a challenging regulatory environment.
Regulatory Framework: Government regulations, particularly those related to environmental protection and emissions control, significantly impact the coal industry. These regulations influence operational costs and investment decisions.
Competitive Product Substitutes: The increasing adoption of renewable energy sources presents a significant challenge to the coal industry. Competition from natural gas and other alternative fuels continues to exert downward pressure on coal prices.
M&A Trends: The Australian coal industry has witnessed several mergers and acquisitions in recent years, driven by consolidation strategies and attempts to achieve economies of scale. The total value of M&A transactions between 2019 and 2024 is estimated at $xx million.
Coal Industry Australia Growth Trends & Insights
This section provides a detailed analysis of the historical and projected growth trends of the Australian coal industry. This analysis leverages data from various sources (including [Source Name if Applicable - Otherwise, specify methodology]) to examine market size evolution, adoption rates, technological disruptions, and shifts in consumer behavior. The report presents detailed insights into CAGR and market penetration for each segment. The projected market size for 2033 is estimated at $xx million, reflecting a CAGR of xx% during the forecast period (2025-2033). Factors influencing growth include fluctuations in global energy demand, government policies, and technological advancements. This deep dive examines how these factors shape the future trajectory of coal consumption within Australia.
Dominant Regions, Countries, or Segments in Coal Industry Australia
This section identifies the leading regions, countries, or segments within the Australian coal market driving market growth. The analysis focuses on both coal type and end-use segments, identifying key drivers and exploring factors influencing market dominance.
By Coal Type: Thermal coal continues to dominate the Australian coal market, accounting for approximately xx% of total production in 2024. Coking coal holds a significant share, estimated at xx%, primarily driven by the steelmaking industry. Semi-soft coking coal comprises the remaining share.
By End-Use: Power generation remains the largest end-use segment, consuming approximately xx% of total coal production. Steelmaking and industrial applications account for the remaining xx% and xx%, respectively.
Key Drivers: Strong demand from Asia-Pacific countries, particularly China and India, for thermal coal fuels growth in the export market. Domestic demand is largely driven by the existing power generation infrastructure and the steel industry. Government policies influencing energy mix play a significant role in shaping the demand landscape.
Coal Industry Australia Product Landscape
The Australian coal industry’s product landscape is largely defined by the different types of coal produced, each possessing distinct characteristics that influence its applications. Thermal coal, characterized by its high energy content, is predominantly used for electricity generation. Coking coal, known for its metallurgical properties, is essential for steelmaking. Recent innovations primarily focus on enhancing mining efficiency and improving coal quality to meet specific end-user requirements.
Key Drivers, Barriers & Challenges in Coal Industry Australia
Key Drivers:
- Strong global demand for coal, particularly from Asian markets.
- Existing infrastructure for coal mining and transportation.
- Continued reliance on coal-fired power generation in some regions.
Challenges and Restraints:
- Increasing environmental regulations and pressure to reduce carbon emissions. The projected cost of compliance with these regulations is estimated at $xx million over the forecast period.
- Competition from renewable energy sources and natural gas.
- Fluctuations in global coal prices and potential future price volatility.
Emerging Opportunities in Coal Industry Australia
Emerging opportunities lie in optimizing coal mining and processing techniques to minimize environmental impact. Investing in carbon capture and storage (CCS) technologies could extend the lifespan of coal-fired power plants while reducing emissions. Further research into coal-to-chemicals conversion offers potential diversification away from traditional energy markets.
Growth Accelerators in the Coal Industry Australia Industry
Continued investment in automation and digital technologies within coal mining operations will enhance efficiency and reduce costs. Strategic partnerships between mining companies and technology providers will accelerate technological adoption. Focusing on improving environmental sustainability and embracing cleaner coal technologies will position the industry for a more sustainable future.
Key Players Shaping the Coal Industry Australia Market
- Peabody Energy Corporation
- HardRock Coal Mining Pty Ltd
- Bloomfield Collieries Pty Ltd
- Yancoal Australia Ltd
- Whitehaven Coal Limited
- Idemitsu Australia Resources Pty Ltd
- Jellinbah Group Pty Ltd
- BHP Group Ltd
- Centennial Coal Company Ltd
- Vale S A
Notable Milestones in Coal Industry Australia Sector
- September 2022: AGL Energy announced the closure of its Loy Yang A power station in Victoria by 2035, signifying a shift away from coal-fired power generation.
- October 2022: New South Wales awarded contracts for the design and replacement of four of its five remaining coal power stations, illustrating a planned transition in electricity infrastructure.
In-Depth Coal Industry Australia Market Outlook
The long-term outlook for the Australian coal industry is complex. While demand remains present, especially for thermal coal in export markets, the increasing pressure for decarbonization will inevitably lead to a decline in coal's dominance. Opportunities for growth lie in adapting to the evolving energy landscape, embracing new technologies, and focusing on environmentally responsible practices. Companies that can successfully navigate the challenges and capitalize on emerging opportunities will be best positioned for long-term success.
Coal Industry Australia Segmentation
- 1. Electricity
- 2. Iron and Steel
- 3. Other Applications
Coal Industry Australia Segmentation By Geography
-
1. North America
- 1.1. United States
- 1.2. Canada
- 1.3. Mexico
-
2. South America
- 2.1. Brazil
- 2.2. Argentina
- 2.3. Rest of South America
-
3. Europe
- 3.1. United Kingdom
- 3.2. Germany
- 3.3. France
- 3.4. Italy
- 3.5. Spain
- 3.6. Russia
- 3.7. Benelux
- 3.8. Nordics
- 3.9. Rest of Europe
-
4. Middle East & Africa
- 4.1. Turkey
- 4.2. Israel
- 4.3. GCC
- 4.4. North Africa
- 4.5. South Africa
- 4.6. Rest of Middle East & Africa
-
5. Asia Pacific
- 5.1. China
- 5.2. India
- 5.3. Japan
- 5.4. South Korea
- 5.5. ASEAN
- 5.6. Oceania
- 5.7. Rest of Asia Pacific
Coal Industry Australia Regional Market Share
Geographic Coverage of Coal Industry Australia
Coal Industry Australia REPORT HIGHLIGHTS
| Aspects | Details |
|---|---|
| Study Period | 2020-2034 |
| Base Year | 2025 |
| Estimated Year | 2026 |
| Forecast Period | 2026-2034 |
| Historical Period | 2020-2025 |
| Growth Rate | CAGR of 2.2% from 2020-2034 |
| Segmentation |
|
Table of Contents
- 1. Introduction
- 1.1. Research Scope
- 1.2. Market Segmentation
- 1.3. Research Objective
- 1.4. Definitions and Assumptions
- 2. Executive Summary
- 2.1. Market Snapshot
- 3. Market Dynamics
- 3.1. Market Drivers
- 3.2. Market Restrains
- 3.3. Market Trends
- 3.4. Market Opportunities
- 4. Market Factor Analysis
- 4.1. Porters Five Forces
- 4.1.1. Bargaining Power of Suppliers
- 4.1.2. Bargaining Power of Buyers
- 4.1.3. Threat of New Entrants
- 4.1.4. Threat of Substitutes
- 4.1.5. Competitive Rivalry
- 4.2. PESTEL analysis
- 4.3. BCG Analysis
- 4.3.1. Stars (High Growth, High Market Share)
- 4.3.2. Cash Cows (Low Growth, High Market Share)
- 4.3.3. Question Mark (High Growth, Low Market Share)
- 4.3.4. Dogs (Low Growth, Low Market Share)
- 4.4. Ansoff Matrix Analysis
- 4.5. Supply Chain Analysis
- 4.6. Regulatory Landscape
- 4.7. Current Market Potential and Opportunity Assessment (TAM–SAM–SOM Framework)
- 4.8. NRP Analyst Note
- 4.1. Porters Five Forces
- 5. Market Analysis, Insights and Forecast 2021-2033
- 5.1. Market Analysis, Insights and Forecast - by Electricity
- 5.2. Market Analysis, Insights and Forecast - by Iron and Steel
- 5.3. Market Analysis, Insights and Forecast - by Other Applications
- 5.4. Market Analysis, Insights and Forecast - by Region
- 5.4.1. North America
- 5.4.2. South America
- 5.4.3. Europe
- 5.4.4. Middle East & Africa
- 5.4.5. Asia Pacific
- 6. Global Coal Industry Australia Analysis, Insights and Forecast, 2021-2033
- 6.1. Market Analysis, Insights and Forecast - by Electricity
- 6.2. Market Analysis, Insights and Forecast - by Iron and Steel
- 6.3. Market Analysis, Insights and Forecast - by Other Applications
- 7. North America Coal Industry Australia Analysis, Insights and Forecast, 2020-2032
- 7.1. Market Analysis, Insights and Forecast - by Electricity
- 7.2. Market Analysis, Insights and Forecast - by Iron and Steel
- 7.3. Market Analysis, Insights and Forecast - by Other Applications
- 8. South America Coal Industry Australia Analysis, Insights and Forecast, 2020-2032
- 8.1. Market Analysis, Insights and Forecast - by Electricity
- 8.2. Market Analysis, Insights and Forecast - by Iron and Steel
- 8.3. Market Analysis, Insights and Forecast - by Other Applications
- 9. Europe Coal Industry Australia Analysis, Insights and Forecast, 2020-2032
- 9.1. Market Analysis, Insights and Forecast - by Electricity
- 9.2. Market Analysis, Insights and Forecast - by Iron and Steel
- 9.3. Market Analysis, Insights and Forecast - by Other Applications
- 10. Middle East & Africa Coal Industry Australia Analysis, Insights and Forecast, 2020-2032
- 10.1. Market Analysis, Insights and Forecast - by Electricity
- 10.2. Market Analysis, Insights and Forecast - by Iron and Steel
- 10.3. Market Analysis, Insights and Forecast - by Other Applications
- 11. Asia Pacific Coal Industry Australia Analysis, Insights and Forecast, 2020-2032
- 11.1. Market Analysis, Insights and Forecast - by Electricity
- 11.2. Market Analysis, Insights and Forecast - by Iron and Steel
- 11.3. Market Analysis, Insights and Forecast - by Other Applications
- 12. Competitive Analysis
- 12.1. Company Profiles
- 12.1.1 Peabody Energy Corporation
- 12.1.1.1. Company Overview
- 12.1.1.2. Products
- 12.1.1.3. Company Financials
- 12.1.1.4. SWOT Analysis
- 12.1.2 HardRock Coal Mining Pty Ltd
- 12.1.2.1. Company Overview
- 12.1.2.2. Products
- 12.1.2.3. Company Financials
- 12.1.2.4. SWOT Analysis
- 12.1.3 Bloomfield Collieries Pty Ltd
- 12.1.3.1. Company Overview
- 12.1.3.2. Products
- 12.1.3.3. Company Financials
- 12.1.3.4. SWOT Analysis
- 12.1.4 Yancoal Australia Ltd
- 12.1.4.1. Company Overview
- 12.1.4.2. Products
- 12.1.4.3. Company Financials
- 12.1.4.4. SWOT Analysis
- 12.1.5 Whitehaven Coal Limited*List Not Exhaustive
- 12.1.5.1. Company Overview
- 12.1.5.2. Products
- 12.1.5.3. Company Financials
- 12.1.5.4. SWOT Analysis
- 12.1.6 Idemitsu Australia Resources Pty Ltd
- 12.1.6.1. Company Overview
- 12.1.6.2. Products
- 12.1.6.3. Company Financials
- 12.1.6.4. SWOT Analysis
- 12.1.7 Jellinbah Group Pty Ltd
- 12.1.7.1. Company Overview
- 12.1.7.2. Products
- 12.1.7.3. Company Financials
- 12.1.7.4. SWOT Analysis
- 12.1.8 BHP Group Ltd
- 12.1.8.1. Company Overview
- 12.1.8.2. Products
- 12.1.8.3. Company Financials
- 12.1.8.4. SWOT Analysis
- 12.1.9 Centennial Coal Company Ltd
- 12.1.9.1. Company Overview
- 12.1.9.2. Products
- 12.1.9.3. Company Financials
- 12.1.9.4. SWOT Analysis
- 12.1.10 Vale S A
- 12.1.10.1. Company Overview
- 12.1.10.2. Products
- 12.1.10.3. Company Financials
- 12.1.10.4. SWOT Analysis
- 12.1.1 Peabody Energy Corporation
- 12.2. Market Entropy
- 12.2.1 Company's Key Areas Served
- 12.2.2 Recent Developments
- 12.3. Company Market Share Analysis 2025
- 12.3.1 Top 5 Companies Market Share Analysis
- 12.3.2 Top 3 Companies Market Share Analysis
- 12.4. List of Potential Customers
- 13. Research Methodology
List of Figures
- Figure 1: Global Coal Industry Australia Revenue Breakdown (billion, %) by Region 2025 & 2033
- Figure 2: Global Coal Industry Australia Volume Breakdown (Kiloton, %) by Region 2025 & 2033
- Figure 3: North America Coal Industry Australia Revenue (billion), by Electricity 2025 & 2033
- Figure 4: North America Coal Industry Australia Volume (Kiloton), by Electricity 2025 & 2033
- Figure 5: North America Coal Industry Australia Revenue Share (%), by Electricity 2025 & 2033
- Figure 6: North America Coal Industry Australia Volume Share (%), by Electricity 2025 & 2033
- Figure 7: North America Coal Industry Australia Revenue (billion), by Iron and Steel 2025 & 2033
- Figure 8: North America Coal Industry Australia Volume (Kiloton), by Iron and Steel 2025 & 2033
- Figure 9: North America Coal Industry Australia Revenue Share (%), by Iron and Steel 2025 & 2033
- Figure 10: North America Coal Industry Australia Volume Share (%), by Iron and Steel 2025 & 2033
- Figure 11: North America Coal Industry Australia Revenue (billion), by Other Applications 2025 & 2033
- Figure 12: North America Coal Industry Australia Volume (Kiloton), by Other Applications 2025 & 2033
- Figure 13: North America Coal Industry Australia Revenue Share (%), by Other Applications 2025 & 2033
- Figure 14: North America Coal Industry Australia Volume Share (%), by Other Applications 2025 & 2033
- Figure 15: North America Coal Industry Australia Revenue (billion), by Country 2025 & 2033
- Figure 16: North America Coal Industry Australia Volume (Kiloton), by Country 2025 & 2033
- Figure 17: North America Coal Industry Australia Revenue Share (%), by Country 2025 & 2033
- Figure 18: North America Coal Industry Australia Volume Share (%), by Country 2025 & 2033
- Figure 19: South America Coal Industry Australia Revenue (billion), by Electricity 2025 & 2033
- Figure 20: South America Coal Industry Australia Volume (Kiloton), by Electricity 2025 & 2033
- Figure 21: South America Coal Industry Australia Revenue Share (%), by Electricity 2025 & 2033
- Figure 22: South America Coal Industry Australia Volume Share (%), by Electricity 2025 & 2033
- Figure 23: South America Coal Industry Australia Revenue (billion), by Iron and Steel 2025 & 2033
- Figure 24: South America Coal Industry Australia Volume (Kiloton), by Iron and Steel 2025 & 2033
- Figure 25: South America Coal Industry Australia Revenue Share (%), by Iron and Steel 2025 & 2033
- Figure 26: South America Coal Industry Australia Volume Share (%), by Iron and Steel 2025 & 2033
- Figure 27: South America Coal Industry Australia Revenue (billion), by Other Applications 2025 & 2033
- Figure 28: South America Coal Industry Australia Volume (Kiloton), by Other Applications 2025 & 2033
- Figure 29: South America Coal Industry Australia Revenue Share (%), by Other Applications 2025 & 2033
- Figure 30: South America Coal Industry Australia Volume Share (%), by Other Applications 2025 & 2033
- Figure 31: South America Coal Industry Australia Revenue (billion), by Country 2025 & 2033
- Figure 32: South America Coal Industry Australia Volume (Kiloton), by Country 2025 & 2033
- Figure 33: South America Coal Industry Australia Revenue Share (%), by Country 2025 & 2033
- Figure 34: South America Coal Industry Australia Volume Share (%), by Country 2025 & 2033
- Figure 35: Europe Coal Industry Australia Revenue (billion), by Electricity 2025 & 2033
- Figure 36: Europe Coal Industry Australia Volume (Kiloton), by Electricity 2025 & 2033
- Figure 37: Europe Coal Industry Australia Revenue Share (%), by Electricity 2025 & 2033
- Figure 38: Europe Coal Industry Australia Volume Share (%), by Electricity 2025 & 2033
- Figure 39: Europe Coal Industry Australia Revenue (billion), by Iron and Steel 2025 & 2033
- Figure 40: Europe Coal Industry Australia Volume (Kiloton), by Iron and Steel 2025 & 2033
- Figure 41: Europe Coal Industry Australia Revenue Share (%), by Iron and Steel 2025 & 2033
- Figure 42: Europe Coal Industry Australia Volume Share (%), by Iron and Steel 2025 & 2033
- Figure 43: Europe Coal Industry Australia Revenue (billion), by Other Applications 2025 & 2033
- Figure 44: Europe Coal Industry Australia Volume (Kiloton), by Other Applications 2025 & 2033
- Figure 45: Europe Coal Industry Australia Revenue Share (%), by Other Applications 2025 & 2033
- Figure 46: Europe Coal Industry Australia Volume Share (%), by Other Applications 2025 & 2033
- Figure 47: Europe Coal Industry Australia Revenue (billion), by Country 2025 & 2033
- Figure 48: Europe Coal Industry Australia Volume (Kiloton), by Country 2025 & 2033
- Figure 49: Europe Coal Industry Australia Revenue Share (%), by Country 2025 & 2033
- Figure 50: Europe Coal Industry Australia Volume Share (%), by Country 2025 & 2033
- Figure 51: Middle East & Africa Coal Industry Australia Revenue (billion), by Electricity 2025 & 2033
- Figure 52: Middle East & Africa Coal Industry Australia Volume (Kiloton), by Electricity 2025 & 2033
- Figure 53: Middle East & Africa Coal Industry Australia Revenue Share (%), by Electricity 2025 & 2033
- Figure 54: Middle East & Africa Coal Industry Australia Volume Share (%), by Electricity 2025 & 2033
- Figure 55: Middle East & Africa Coal Industry Australia Revenue (billion), by Iron and Steel 2025 & 2033
- Figure 56: Middle East & Africa Coal Industry Australia Volume (Kiloton), by Iron and Steel 2025 & 2033
- Figure 57: Middle East & Africa Coal Industry Australia Revenue Share (%), by Iron and Steel 2025 & 2033
- Figure 58: Middle East & Africa Coal Industry Australia Volume Share (%), by Iron and Steel 2025 & 2033
- Figure 59: Middle East & Africa Coal Industry Australia Revenue (billion), by Other Applications 2025 & 2033
- Figure 60: Middle East & Africa Coal Industry Australia Volume (Kiloton), by Other Applications 2025 & 2033
- Figure 61: Middle East & Africa Coal Industry Australia Revenue Share (%), by Other Applications 2025 & 2033
- Figure 62: Middle East & Africa Coal Industry Australia Volume Share (%), by Other Applications 2025 & 2033
- Figure 63: Middle East & Africa Coal Industry Australia Revenue (billion), by Country 2025 & 2033
- Figure 64: Middle East & Africa Coal Industry Australia Volume (Kiloton), by Country 2025 & 2033
- Figure 65: Middle East & Africa Coal Industry Australia Revenue Share (%), by Country 2025 & 2033
- Figure 66: Middle East & Africa Coal Industry Australia Volume Share (%), by Country 2025 & 2033
- Figure 67: Asia Pacific Coal Industry Australia Revenue (billion), by Electricity 2025 & 2033
- Figure 68: Asia Pacific Coal Industry Australia Volume (Kiloton), by Electricity 2025 & 2033
- Figure 69: Asia Pacific Coal Industry Australia Revenue Share (%), by Electricity 2025 & 2033
- Figure 70: Asia Pacific Coal Industry Australia Volume Share (%), by Electricity 2025 & 2033
- Figure 71: Asia Pacific Coal Industry Australia Revenue (billion), by Iron and Steel 2025 & 2033
- Figure 72: Asia Pacific Coal Industry Australia Volume (Kiloton), by Iron and Steel 2025 & 2033
- Figure 73: Asia Pacific Coal Industry Australia Revenue Share (%), by Iron and Steel 2025 & 2033
- Figure 74: Asia Pacific Coal Industry Australia Volume Share (%), by Iron and Steel 2025 & 2033
- Figure 75: Asia Pacific Coal Industry Australia Revenue (billion), by Other Applications 2025 & 2033
- Figure 76: Asia Pacific Coal Industry Australia Volume (Kiloton), by Other Applications 2025 & 2033
- Figure 77: Asia Pacific Coal Industry Australia Revenue Share (%), by Other Applications 2025 & 2033
- Figure 78: Asia Pacific Coal Industry Australia Volume Share (%), by Other Applications 2025 & 2033
- Figure 79: Asia Pacific Coal Industry Australia Revenue (billion), by Country 2025 & 2033
- Figure 80: Asia Pacific Coal Industry Australia Volume (Kiloton), by Country 2025 & 2033
- Figure 81: Asia Pacific Coal Industry Australia Revenue Share (%), by Country 2025 & 2033
- Figure 82: Asia Pacific Coal Industry Australia Volume Share (%), by Country 2025 & 2033
List of Tables
- Table 1: Global Coal Industry Australia Revenue billion Forecast, by Electricity 2020 & 2033
- Table 2: Global Coal Industry Australia Volume Kiloton Forecast, by Electricity 2020 & 2033
- Table 3: Global Coal Industry Australia Revenue billion Forecast, by Iron and Steel 2020 & 2033
- Table 4: Global Coal Industry Australia Volume Kiloton Forecast, by Iron and Steel 2020 & 2033
- Table 5: Global Coal Industry Australia Revenue billion Forecast, by Other Applications 2020 & 2033
- Table 6: Global Coal Industry Australia Volume Kiloton Forecast, by Other Applications 2020 & 2033
- Table 7: Global Coal Industry Australia Revenue billion Forecast, by Region 2020 & 2033
- Table 8: Global Coal Industry Australia Volume Kiloton Forecast, by Region 2020 & 2033
- Table 9: Global Coal Industry Australia Revenue billion Forecast, by Electricity 2020 & 2033
- Table 10: Global Coal Industry Australia Volume Kiloton Forecast, by Electricity 2020 & 2033
- Table 11: Global Coal Industry Australia Revenue billion Forecast, by Iron and Steel 2020 & 2033
- Table 12: Global Coal Industry Australia Volume Kiloton Forecast, by Iron and Steel 2020 & 2033
- Table 13: Global Coal Industry Australia Revenue billion Forecast, by Other Applications 2020 & 2033
- Table 14: Global Coal Industry Australia Volume Kiloton Forecast, by Other Applications 2020 & 2033
- Table 15: Global Coal Industry Australia Revenue billion Forecast, by Country 2020 & 2033
- Table 16: Global Coal Industry Australia Volume Kiloton Forecast, by Country 2020 & 2033
- Table 17: United States Coal Industry Australia Revenue (billion) Forecast, by Application 2020 & 2033
- Table 18: United States Coal Industry Australia Volume (Kiloton) Forecast, by Application 2020 & 2033
- Table 19: Canada Coal Industry Australia Revenue (billion) Forecast, by Application 2020 & 2033
- Table 20: Canada Coal Industry Australia Volume (Kiloton) Forecast, by Application 2020 & 2033
- Table 21: Mexico Coal Industry Australia Revenue (billion) Forecast, by Application 2020 & 2033
- Table 22: Mexico Coal Industry Australia Volume (Kiloton) Forecast, by Application 2020 & 2033
- Table 23: Global Coal Industry Australia Revenue billion Forecast, by Electricity 2020 & 2033
- Table 24: Global Coal Industry Australia Volume Kiloton Forecast, by Electricity 2020 & 2033
- Table 25: Global Coal Industry Australia Revenue billion Forecast, by Iron and Steel 2020 & 2033
- Table 26: Global Coal Industry Australia Volume Kiloton Forecast, by Iron and Steel 2020 & 2033
- Table 27: Global Coal Industry Australia Revenue billion Forecast, by Other Applications 2020 & 2033
- Table 28: Global Coal Industry Australia Volume Kiloton Forecast, by Other Applications 2020 & 2033
- Table 29: Global Coal Industry Australia Revenue billion Forecast, by Country 2020 & 2033
- Table 30: Global Coal Industry Australia Volume Kiloton Forecast, by Country 2020 & 2033
- Table 31: Brazil Coal Industry Australia Revenue (billion) Forecast, by Application 2020 & 2033
- Table 32: Brazil Coal Industry Australia Volume (Kiloton) Forecast, by Application 2020 & 2033
- Table 33: Argentina Coal Industry Australia Revenue (billion) Forecast, by Application 2020 & 2033
- Table 34: Argentina Coal Industry Australia Volume (Kiloton) Forecast, by Application 2020 & 2033
- Table 35: Rest of South America Coal Industry Australia Revenue (billion) Forecast, by Application 2020 & 2033
- Table 36: Rest of South America Coal Industry Australia Volume (Kiloton) Forecast, by Application 2020 & 2033
- Table 37: Global Coal Industry Australia Revenue billion Forecast, by Electricity 2020 & 2033
- Table 38: Global Coal Industry Australia Volume Kiloton Forecast, by Electricity 2020 & 2033
- Table 39: Global Coal Industry Australia Revenue billion Forecast, by Iron and Steel 2020 & 2033
- Table 40: Global Coal Industry Australia Volume Kiloton Forecast, by Iron and Steel 2020 & 2033
- Table 41: Global Coal Industry Australia Revenue billion Forecast, by Other Applications 2020 & 2033
- Table 42: Global Coal Industry Australia Volume Kiloton Forecast, by Other Applications 2020 & 2033
- Table 43: Global Coal Industry Australia Revenue billion Forecast, by Country 2020 & 2033
- Table 44: Global Coal Industry Australia Volume Kiloton Forecast, by Country 2020 & 2033
- Table 45: United Kingdom Coal Industry Australia Revenue (billion) Forecast, by Application 2020 & 2033
- Table 46: United Kingdom Coal Industry Australia Volume (Kiloton) Forecast, by Application 2020 & 2033
- Table 47: Germany Coal Industry Australia Revenue (billion) Forecast, by Application 2020 & 2033
- Table 48: Germany Coal Industry Australia Volume (Kiloton) Forecast, by Application 2020 & 2033
- Table 49: France Coal Industry Australia Revenue (billion) Forecast, by Application 2020 & 2033
- Table 50: France Coal Industry Australia Volume (Kiloton) Forecast, by Application 2020 & 2033
- Table 51: Italy Coal Industry Australia Revenue (billion) Forecast, by Application 2020 & 2033
- Table 52: Italy Coal Industry Australia Volume (Kiloton) Forecast, by Application 2020 & 2033
- Table 53: Spain Coal Industry Australia Revenue (billion) Forecast, by Application 2020 & 2033
- Table 54: Spain Coal Industry Australia Volume (Kiloton) Forecast, by Application 2020 & 2033
- Table 55: Russia Coal Industry Australia Revenue (billion) Forecast, by Application 2020 & 2033
- Table 56: Russia Coal Industry Australia Volume (Kiloton) Forecast, by Application 2020 & 2033
- Table 57: Benelux Coal Industry Australia Revenue (billion) Forecast, by Application 2020 & 2033
- Table 58: Benelux Coal Industry Australia Volume (Kiloton) Forecast, by Application 2020 & 2033
- Table 59: Nordics Coal Industry Australia Revenue (billion) Forecast, by Application 2020 & 2033
- Table 60: Nordics Coal Industry Australia Volume (Kiloton) Forecast, by Application 2020 & 2033
- Table 61: Rest of Europe Coal Industry Australia Revenue (billion) Forecast, by Application 2020 & 2033
- Table 62: Rest of Europe Coal Industry Australia Volume (Kiloton) Forecast, by Application 2020 & 2033
- Table 63: Global Coal Industry Australia Revenue billion Forecast, by Electricity 2020 & 2033
- Table 64: Global Coal Industry Australia Volume Kiloton Forecast, by Electricity 2020 & 2033
- Table 65: Global Coal Industry Australia Revenue billion Forecast, by Iron and Steel 2020 & 2033
- Table 66: Global Coal Industry Australia Volume Kiloton Forecast, by Iron and Steel 2020 & 2033
- Table 67: Global Coal Industry Australia Revenue billion Forecast, by Other Applications 2020 & 2033
- Table 68: Global Coal Industry Australia Volume Kiloton Forecast, by Other Applications 2020 & 2033
- Table 69: Global Coal Industry Australia Revenue billion Forecast, by Country 2020 & 2033
- Table 70: Global Coal Industry Australia Volume Kiloton Forecast, by Country 2020 & 2033
- Table 71: Turkey Coal Industry Australia Revenue (billion) Forecast, by Application 2020 & 2033
- Table 72: Turkey Coal Industry Australia Volume (Kiloton) Forecast, by Application 2020 & 2033
- Table 73: Israel Coal Industry Australia Revenue (billion) Forecast, by Application 2020 & 2033
- Table 74: Israel Coal Industry Australia Volume (Kiloton) Forecast, by Application 2020 & 2033
- Table 75: GCC Coal Industry Australia Revenue (billion) Forecast, by Application 2020 & 2033
- Table 76: GCC Coal Industry Australia Volume (Kiloton) Forecast, by Application 2020 & 2033
- Table 77: North Africa Coal Industry Australia Revenue (billion) Forecast, by Application 2020 & 2033
- Table 78: North Africa Coal Industry Australia Volume (Kiloton) Forecast, by Application 2020 & 2033
- Table 79: South Africa Coal Industry Australia Revenue (billion) Forecast, by Application 2020 & 2033
- Table 80: South Africa Coal Industry Australia Volume (Kiloton) Forecast, by Application 2020 & 2033
- Table 81: Rest of Middle East & Africa Coal Industry Australia Revenue (billion) Forecast, by Application 2020 & 2033
- Table 82: Rest of Middle East & Africa Coal Industry Australia Volume (Kiloton) Forecast, by Application 2020 & 2033
- Table 83: Global Coal Industry Australia Revenue billion Forecast, by Electricity 2020 & 2033
- Table 84: Global Coal Industry Australia Volume Kiloton Forecast, by Electricity 2020 & 2033
- Table 85: Global Coal Industry Australia Revenue billion Forecast, by Iron and Steel 2020 & 2033
- Table 86: Global Coal Industry Australia Volume Kiloton Forecast, by Iron and Steel 2020 & 2033
- Table 87: Global Coal Industry Australia Revenue billion Forecast, by Other Applications 2020 & 2033
- Table 88: Global Coal Industry Australia Volume Kiloton Forecast, by Other Applications 2020 & 2033
- Table 89: Global Coal Industry Australia Revenue billion Forecast, by Country 2020 & 2033
- Table 90: Global Coal Industry Australia Volume Kiloton Forecast, by Country 2020 & 2033
- Table 91: China Coal Industry Australia Revenue (billion) Forecast, by Application 2020 & 2033
- Table 92: China Coal Industry Australia Volume (Kiloton) Forecast, by Application 2020 & 2033
- Table 93: India Coal Industry Australia Revenue (billion) Forecast, by Application 2020 & 2033
- Table 94: India Coal Industry Australia Volume (Kiloton) Forecast, by Application 2020 & 2033
- Table 95: Japan Coal Industry Australia Revenue (billion) Forecast, by Application 2020 & 2033
- Table 96: Japan Coal Industry Australia Volume (Kiloton) Forecast, by Application 2020 & 2033
- Table 97: South Korea Coal Industry Australia Revenue (billion) Forecast, by Application 2020 & 2033
- Table 98: South Korea Coal Industry Australia Volume (Kiloton) Forecast, by Application 2020 & 2033
- Table 99: ASEAN Coal Industry Australia Revenue (billion) Forecast, by Application 2020 & 2033
- Table 100: ASEAN Coal Industry Australia Volume (Kiloton) Forecast, by Application 2020 & 2033
- Table 101: Oceania Coal Industry Australia Revenue (billion) Forecast, by Application 2020 & 2033
- Table 102: Oceania Coal Industry Australia Volume (Kiloton) Forecast, by Application 2020 & 2033
- Table 103: Rest of Asia Pacific Coal Industry Australia Revenue (billion) Forecast, by Application 2020 & 2033
- Table 104: Rest of Asia Pacific Coal Industry Australia Volume (Kiloton) Forecast, by Application 2020 & 2033
Frequently Asked Questions
1. What is the projected Compound Annual Growth Rate (CAGR) of the Coal Industry Australia?
The projected CAGR is approximately 2.2%.
2. Which companies are prominent players in the Coal Industry Australia?
Key companies in the market include Peabody Energy Corporation, HardRock Coal Mining Pty Ltd, Bloomfield Collieries Pty Ltd, Yancoal Australia Ltd, Whitehaven Coal Limited*List Not Exhaustive, Idemitsu Australia Resources Pty Ltd, Jellinbah Group Pty Ltd, BHP Group Ltd, Centennial Coal Company Ltd, Vale S A.
3. What are the main segments of the Coal Industry Australia?
The market segments include Electricity, Iron and Steel, Other Applications.
4. Can you provide details about the market size?
The market size is estimated to be USD 57 billion as of 2022.
5. What are some drivers contributing to market growth?
4.; Increase in Prices of Electricity Procured from Conventional Mechanisms 4.; Decline in Cost of Solar Energy Infrastructure.
6. What are the notable trends driving market growth?
Demand for Bituminous Coal to Drive the Market.
7. Are there any restraints impacting market growth?
4.; Competition from Other Alternative Energy Sources.
8. Can you provide examples of recent developments in the market?
September 2022: AGL Energy announced the company's coal-fired Loy Yang A power station in Victoria will close in 2035.
9. What pricing options are available for accessing the report?
Pricing options include single-user, multi-user, and enterprise licenses priced at USD 3800, USD 4500, and USD 5800 respectively.
10. Is the market size provided in terms of value or volume?
The market size is provided in terms of value, measured in billion and volume, measured in Kiloton.
11. Are there any specific market keywords associated with the report?
Yes, the market keyword associated with the report is "Coal Industry Australia," which aids in identifying and referencing the specific market segment covered.
12. How do I determine which pricing option suits my needs best?
The pricing options vary based on user requirements and access needs. Individual users may opt for single-user licenses, while businesses requiring broader access may choose multi-user or enterprise licenses for cost-effective access to the report.
13. Are there any additional resources or data provided in the Coal Industry Australia report?
While the report offers comprehensive insights, it's advisable to review the specific contents or supplementary materials provided to ascertain if additional resources or data are available.
14. How can I stay updated on further developments or reports in the Coal Industry Australia?
To stay informed about further developments, trends, and reports in the Coal Industry Australia, consider subscribing to industry newsletters, following relevant companies and organizations, or regularly checking reputable industry news sources and publications.
Methodology
Step 1 - Identification of Relevant Samples Size from Population Database


Step 2 - Approaches for Defining Global Market Size (Value, Volume* & Price*)

Note*: In applicable scenarios
Step 3 - Data Sources
Primary Research
- Web Analytics
- Survey Reports
- Research Institute
- Latest Research Reports
- Opinion Leaders
Secondary Research
- Annual Reports
- White Paper
- Latest Press Release
- Industry Association
- Paid Database
- Investor Presentations

Step 4 - Data Triangulation
Involves using different sources of information in order to increase the validity of a study
These sources are likely to be stakeholders in a program - participants, other researchers, program staff, other community members, and so on.
Then we put all data in single framework & apply various statistical tools to find out the dynamic on the market.
During the analysis stage, feedback from the stakeholder groups would be compared to determine areas of agreement as well as areas of divergence