

Key Insights
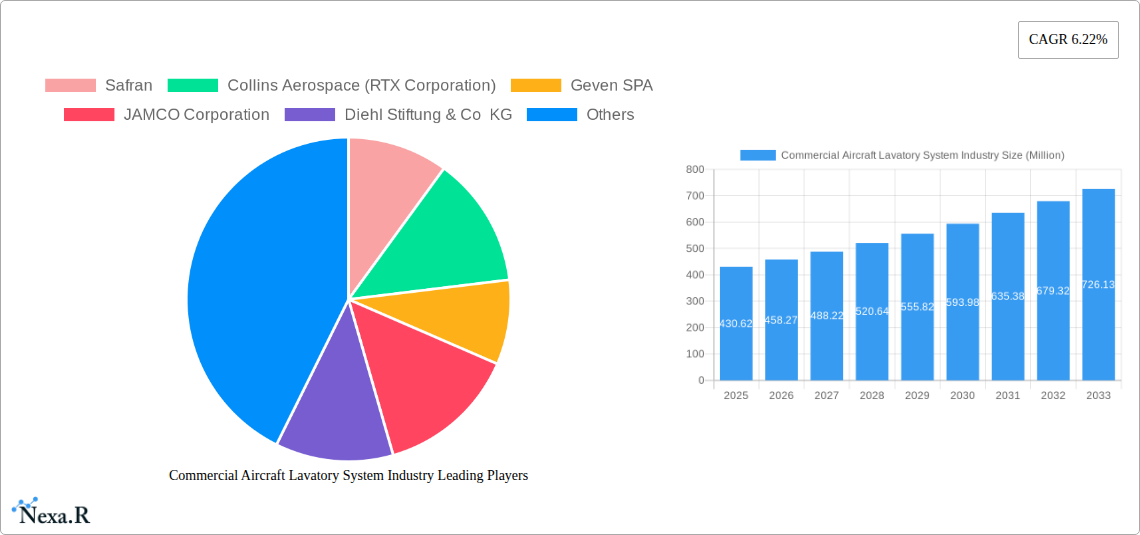
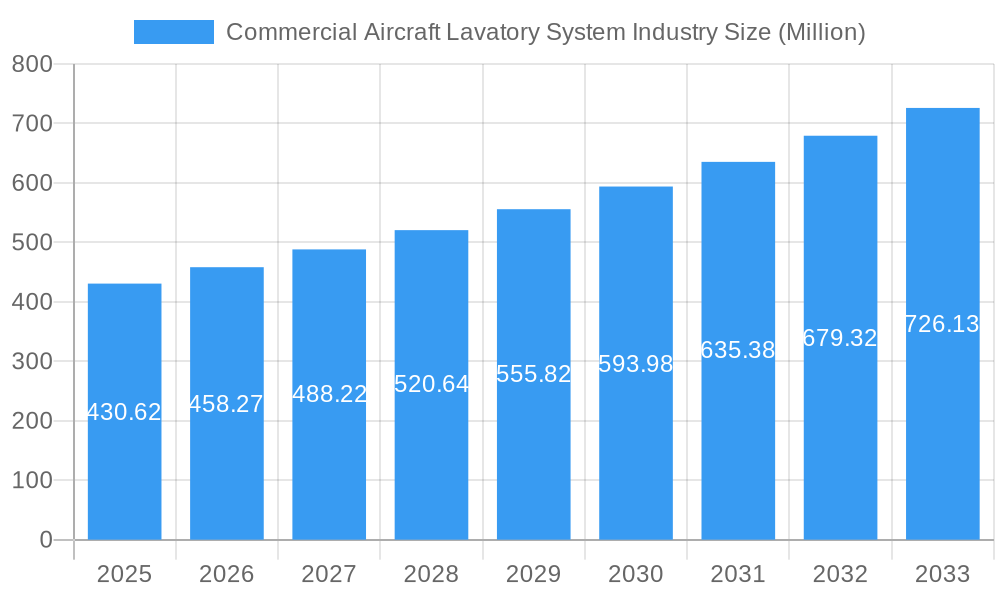
The commercial aircraft lavatory system market is poised for significant growth, projected to reach \$430.62 million in 2025 and maintain a Compound Annual Growth Rate (CAGR) of 6.22% from 2025 to 2033. This expansion is driven by several key factors. Firstly, the increasing demand for air travel globally fuels a corresponding need for improved and more numerous lavatory systems in aircraft. Secondly, technological advancements in lavatory design are leading to lighter weight, more efficient, and more sustainable systems, reducing operational costs for airlines and enhancing passenger comfort. This includes the integration of smart technologies for waste management and improved hygiene. Furthermore, stringent regulatory requirements regarding sanitation and waste disposal within the aviation industry are pushing manufacturers to innovate and invest in advanced lavatory solutions. The market segmentation, with narrow-body, wide-body, and regional jets each contributing to the overall growth, reflects diverse needs and technological specifications across different aircraft types. The major players in the market are constantly striving to offer innovative products and services, leading to competitive pricing and product differentiation.
Commercial Aircraft Lavatory System Industry Market Size (In Million)
The regional distribution of the market is expected to be heavily influenced by the growth of air travel within specific regions. North America and Europe will likely maintain substantial market shares due to their established aviation industries and high passenger volumes. However, rapidly developing economies in Asia-Pacific and the Middle East and Africa are also expected to experience significant growth in demand for new aircraft and associated lavatory systems. This expansion presents opportunities for both established and emerging manufacturers to secure contracts and expand their market presence. The competitive landscape remains dynamic, with key players focusing on strategic partnerships, mergers and acquisitions, and research and development to maintain their competitive edge. Future growth is largely contingent upon the sustained growth of air travel and ongoing advancements in aircraft lavatory system technology.
Commercial Aircraft Lavatory System Industry Company Market Share
Commercial Aircraft Lavatory System Industry Market Report: 2019-2033
This comprehensive report provides a detailed analysis of the Commercial Aircraft Lavatory System industry, covering market dynamics, growth trends, regional landscapes, key players, and future outlook. The report uses data from 2019-2024 (Historical Period), with 2025 as the Base Year and Estimated Year, projecting the market's trajectory until 2033 (Forecast Period). The study encompasses both the parent market (Commercial Aircraft Aftermarket) and the child market (Aircraft Lavatory Systems), delivering granular insights for informed decision-making. The total market size is projected to reach XX Million units by 2033.
Commercial Aircraft Lavatory System Industry Market Dynamics & Structure
The Commercial Aircraft Lavatory System market is characterized by moderate concentration, with key players holding significant market share. Technological advancements, stringent safety regulations, and the rise of sustainable materials are major drivers. Competitive substitution pressures exist from alternative lavatory designs and materials. The industry is witnessing increasing consolidation through mergers and acquisitions (M&A), with an estimated XX M&A deals during the historical period (2019-2024). End-user demographics are shifting towards larger, more comfortable lavatories, particularly in wide-body aircraft.
- Market Concentration: Moderately concentrated, with top 5 players holding approximately XX% of the market share in 2024.
- Technological Innovation: Focus on lightweight materials, improved hygiene features, and water-saving technologies.
- Regulatory Framework: Stringent safety and environmental regulations influence product design and manufacturing.
- Competitive Substitutes: Emergence of alternative materials and designs presents competitive pressure.
- End-User Demographics: Growing demand for enhanced comfort and hygiene in lavatories, especially in wide-body aircraft.
- M&A Trends: Consolidation through acquisitions driving market restructuring and innovation.
Commercial Aircraft Lavatory System Industry Growth Trends & Insights
The global Commercial Aircraft Lavatory System market exhibited a CAGR of XX% during the historical period (2019-2024), reaching XX Million units in 2024. Adoption rates are largely tied to new aircraft deliveries and retrofitting initiatives. Technological disruptions, such as the integration of smart technologies and sustainable materials, are accelerating growth. Shifting consumer preferences towards enhanced comfort and hygiene are also influencing market demand. The forecast period (2025-2033) is expected to see a CAGR of XX%, driven by increasing air travel and a focus on improving passenger experience. Market penetration is expected to reach XX% by 2033.
Dominant Regions, Countries, or Segments in Commercial Aircraft Lavatory System Industry
North America currently holds the largest market share in the Commercial Aircraft Lavatory System industry, driven by a robust aviation sector and high aircraft delivery rates. Within aircraft types, the narrow-body segment dominates due to the larger number of narrow-body aircraft in operation globally.
North America Dominance: High aircraft production and strong aftermarket demand fuel market growth.
Narrow-body Segment Leadership: High volume of narrow-body aircraft drives significant demand.
Asia-Pacific Growth Potential: Rapid growth in air travel and aircraft fleet expansion create significant opportunities.
Europe's Stable Market: Established aviation industry and focus on sustainability contribute to steady growth.
Key Drivers:
- Strong air travel growth, particularly in Asia-Pacific.
- Increased aircraft deliveries and fleet modernization.
- Growing focus on passenger experience and comfort.
Commercial Aircraft Lavatory System Industry Product Landscape
The product landscape features a wide range of lavatory systems tailored to different aircraft types and airline needs. Innovations focus on lightweight materials (e.g., composites), improved waste management systems, and enhanced hygiene features (e.g., antimicrobial surfaces). Unique selling propositions include improved durability, reduced maintenance costs, and enhanced passenger comfort. Technological advancements include the integration of smart sensors for monitoring and predictive maintenance.
Key Drivers, Barriers & Challenges in Commercial Aircraft Lavatory System Industry
Key Drivers:
- Growing air passenger traffic globally.
- Increasing demand for improved passenger comfort and hygiene.
- Technological advancements leading to more efficient and sustainable lavatory systems.
- Stringent safety regulations driving innovation.
Challenges & Restraints:
- High initial investment costs for advanced lavatory systems.
- Supply chain disruptions impacting production and delivery timelines.
- Intense competition among established players and new entrants.
- Fluctuations in fuel prices and economic conditions affecting airline investment.
Emerging Opportunities in Commercial Aircraft Lavatory System Industry
- Development of lightweight and sustainable lavatory systems.
- Integration of smart technologies for improved maintenance and hygiene.
- Expansion into emerging markets with growing air travel demand.
- Focus on customized lavatory solutions for different aircraft types and airline requirements.
Growth Accelerators in the Commercial Aircraft Lavatory System Industry Industry
Technological breakthroughs in materials science and waste management are driving growth, leading to lighter, more efficient, and sustainable lavatory systems. Strategic partnerships between manufacturers and airlines enhance product development and market penetration. Expansion into emerging markets and the increasing focus on enhancing passenger experience further accelerate market expansion.
Key Players Shaping the Commercial Aircraft Lavatory System Market
- Safran
- Collins Aerospace (RTX Corporation)
- Geven SPA
- JAMCO Corporation
- Diehl Stiftung & Co KG
- The NORDAM Group LLC
- Yokohama Aerospace America Inc
- Satys
- Hong Kong Aircraft Engineering Company Limited
- CIRCOr Aerospac
Notable Milestones in Commercial Aircraft Lavatory System Industry Sector
- 2020: Introduction of a new lightweight lavatory system by Safran.
- 2022: Collins Aerospace acquires a smaller lavatory system manufacturer.
- 2023: Several companies launch lavatories incorporating sustainable materials.
In-Depth Commercial Aircraft Lavatory System Industry Market Outlook
The Commercial Aircraft Lavatory System market is poised for continued growth driven by increasing air passenger traffic and the ongoing trend toward enhanced passenger experience. Strategic investments in research and development, focusing on sustainable and technologically advanced lavatory systems, will shape future market dynamics. Expansion into emerging markets and strategic partnerships offer significant opportunities for market players. The market is expected to witness a robust growth trajectory, exceeding XX Million units by 2033.
Commercial Aircraft Lavatory System Industry Segmentation
- 1. Production Analysis
- 2. Consumption Analysis
- 3. Import Market Analysis (Value & Volume)
- 4. Export Market Analysis (Value & Volume)
- 5. Price Trend Analysis
Commercial Aircraft Lavatory System Industry Segmentation By Geography
-
1. North America
- 1.1. United States
- 1.2. Canada
-
2. Europe
- 2.1. United Kingdom
- 2.2. Germany
- 2.3. France
- 2.4. Italy
- 2.5. Russia
- 2.6. Rest of Europe
-
3. Asia Pacific
- 3.1. China
- 3.2. India
- 3.3. Japan
- 3.4. South Korea
- 3.5. Rest of Asia Pacific
-
4. Latin America
- 4.1. Brazil
- 4.2. Mexico
- 4.3. Rest of Latin America
-
5. Middle East and Africa
- 5.1. United Arab Emirates
- 5.2. Saudi Arabia
- 5.3. Qatar
- 5.4. South Africa
- 5.5. Rest of Middle East and Africa
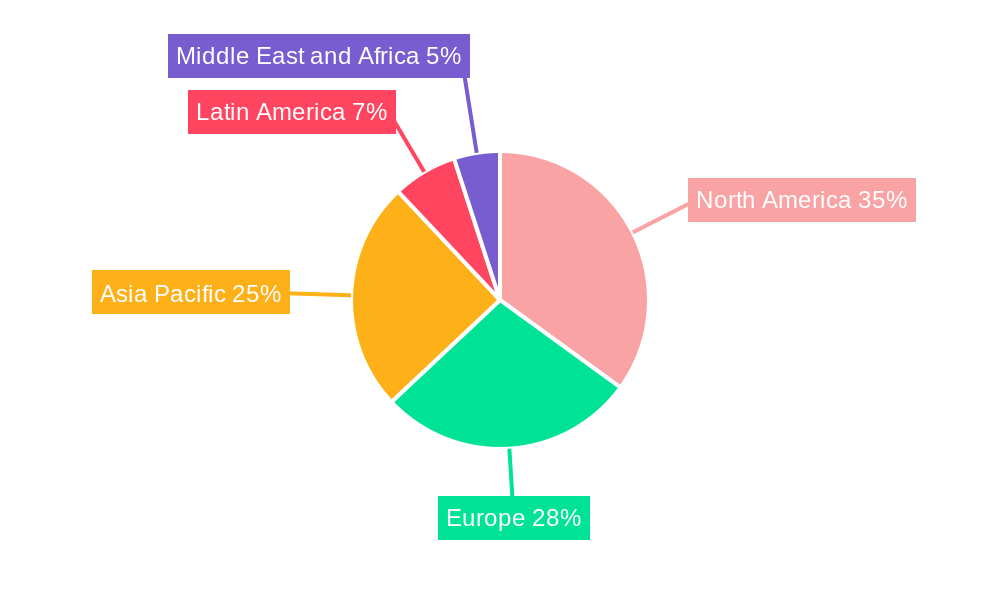
Commercial Aircraft Lavatory System Industry Regional Market Share
Geographic Coverage of Commercial Aircraft Lavatory System Industry
Commercial Aircraft Lavatory System Industry REPORT HIGHLIGHTS
| Aspects | Details |
|---|---|
| Study Period | 2020-2034 |
| Base Year | 2025 |
| Estimated Year | 2026 |
| Forecast Period | 2026-2034 |
| Historical Period | 2020-2025 |
| Growth Rate | CAGR of 6.22% from 2020-2034 |
| Segmentation |
|
Table of Contents
- 1. Introduction
- 1.1. Research Scope
- 1.2. Market Segmentation
- 1.3. Research Objective
- 1.4. Definitions and Assumptions
- 2. Executive Summary
- 2.1. Market Snapshot
- 3. Market Dynamics
- 3.1. Market Drivers
- 3.2. Market Restrains
- 3.3. Market Trends
- 3.4. Market Opportunities
- 4. Market Factor Analysis
- 4.1. Porters Five Forces
- 4.1.1. Bargaining Power of Suppliers
- 4.1.2. Bargaining Power of Buyers
- 4.1.3. Threat of New Entrants
- 4.1.4. Threat of Substitutes
- 4.1.5. Competitive Rivalry
- 4.2. PESTEL analysis
- 4.3. BCG Analysis
- 4.3.1. Stars (High Growth, High Market Share)
- 4.3.2. Cash Cows (Low Growth, High Market Share)
- 4.3.3. Question Mark (High Growth, Low Market Share)
- 4.3.4. Dogs (Low Growth, Low Market Share)
- 4.4. Ansoff Matrix Analysis
- 4.5. Supply Chain Analysis
- 4.6. Regulatory Landscape
- 4.7. Current Market Potential and Opportunity Assessment (TAM–SAM–SOM Framework)
- 4.8. NRP Analyst Note
- 4.1. Porters Five Forces
- 5. Market Analysis, Insights and Forecast 2021-2033
- 5.1. Market Analysis, Insights and Forecast - by Production Analysis
- 5.2. Market Analysis, Insights and Forecast - by Consumption Analysis
- 5.3. Market Analysis, Insights and Forecast - by Import Market Analysis (Value & Volume)
- 5.4. Market Analysis, Insights and Forecast - by Export Market Analysis (Value & Volume)
- 5.5. Market Analysis, Insights and Forecast - by Price Trend Analysis
- 5.6. Market Analysis, Insights and Forecast - by Region
- 5.6.1. North America
- 5.6.2. Europe
- 5.6.3. Asia Pacific
- 5.6.4. Latin America
- 5.6.5. Middle East and Africa
- 6. Global Commercial Aircraft Lavatory System Industry Analysis, Insights and Forecast, 2021-2033
- 6.1. Market Analysis, Insights and Forecast - by Production Analysis
- 6.2. Market Analysis, Insights and Forecast - by Consumption Analysis
- 6.3. Market Analysis, Insights and Forecast - by Import Market Analysis (Value & Volume)
- 6.4. Market Analysis, Insights and Forecast - by Export Market Analysis (Value & Volume)
- 6.5. Market Analysis, Insights and Forecast - by Price Trend Analysis
- 7. North America Commercial Aircraft Lavatory System Industry Analysis, Insights and Forecast, 2020-2032
- 7.1. Market Analysis, Insights and Forecast - by Production Analysis
- 7.2. Market Analysis, Insights and Forecast - by Consumption Analysis
- 7.3. Market Analysis, Insights and Forecast - by Import Market Analysis (Value & Volume)
- 7.4. Market Analysis, Insights and Forecast - by Export Market Analysis (Value & Volume)
- 7.5. Market Analysis, Insights and Forecast - by Price Trend Analysis
- 8. Europe Commercial Aircraft Lavatory System Industry Analysis, Insights and Forecast, 2020-2032
- 8.1. Market Analysis, Insights and Forecast - by Production Analysis
- 8.2. Market Analysis, Insights and Forecast - by Consumption Analysis
- 8.3. Market Analysis, Insights and Forecast - by Import Market Analysis (Value & Volume)
- 8.4. Market Analysis, Insights and Forecast - by Export Market Analysis (Value & Volume)
- 8.5. Market Analysis, Insights and Forecast - by Price Trend Analysis
- 9. Asia Pacific Commercial Aircraft Lavatory System Industry Analysis, Insights and Forecast, 2020-2032
- 9.1. Market Analysis, Insights and Forecast - by Production Analysis
- 9.2. Market Analysis, Insights and Forecast - by Consumption Analysis
- 9.3. Market Analysis, Insights and Forecast - by Import Market Analysis (Value & Volume)
- 9.4. Market Analysis, Insights and Forecast - by Export Market Analysis (Value & Volume)
- 9.5. Market Analysis, Insights and Forecast - by Price Trend Analysis
- 10. Latin America Commercial Aircraft Lavatory System Industry Analysis, Insights and Forecast, 2020-2032
- 10.1. Market Analysis, Insights and Forecast - by Production Analysis
- 10.2. Market Analysis, Insights and Forecast - by Consumption Analysis
- 10.3. Market Analysis, Insights and Forecast - by Import Market Analysis (Value & Volume)
- 10.4. Market Analysis, Insights and Forecast - by Export Market Analysis (Value & Volume)
- 10.5. Market Analysis, Insights and Forecast - by Price Trend Analysis
- 11. Middle East and Africa Commercial Aircraft Lavatory System Industry Analysis, Insights and Forecast, 2020-2032
- 11.1. Market Analysis, Insights and Forecast - by Production Analysis
- 11.2. Market Analysis, Insights and Forecast - by Consumption Analysis
- 11.3. Market Analysis, Insights and Forecast - by Import Market Analysis (Value & Volume)
- 11.4. Market Analysis, Insights and Forecast - by Export Market Analysis (Value & Volume)
- 11.5. Market Analysis, Insights and Forecast - by Price Trend Analysis
- 12. Competitive Analysis
- 12.1. Company Profiles
- 12.1.1 Safran
- 12.1.1.1. Company Overview
- 12.1.1.2. Products
- 12.1.1.3. Company Financials
- 12.1.1.4. SWOT Analysis
- 12.1.2 Collins Aerospace (RTX Corporation)
- 12.1.2.1. Company Overview
- 12.1.2.2. Products
- 12.1.2.3. Company Financials
- 12.1.2.4. SWOT Analysis
- 12.1.3 Geven SPA
- 12.1.3.1. Company Overview
- 12.1.3.2. Products
- 12.1.3.3. Company Financials
- 12.1.3.4. SWOT Analysis
- 12.1.4 JAMCO Corporation
- 12.1.4.1. Company Overview
- 12.1.4.2. Products
- 12.1.4.3. Company Financials
- 12.1.4.4. SWOT Analysis
- 12.1.5 Diehl Stiftung & Co KG
- 12.1.5.1. Company Overview
- 12.1.5.2. Products
- 12.1.5.3. Company Financials
- 12.1.5.4. SWOT Analysis
- 12.1.6 The NORDAM Group LLC
- 12.1.6.1. Company Overview
- 12.1.6.2. Products
- 12.1.6.3. Company Financials
- 12.1.6.4. SWOT Analysis
- 12.1.7 Yokohama Aerospace America Inc
- 12.1.7.1. Company Overview
- 12.1.7.2. Products
- 12.1.7.3. Company Financials
- 12.1.7.4. SWOT Analysis
- 12.1.8 Satys
- 12.1.8.1. Company Overview
- 12.1.8.2. Products
- 12.1.8.3. Company Financials
- 12.1.8.4. SWOT Analysis
- 12.1.9 Hong Kong Aircraft Engineering Company Limited
- 12.1.9.1. Company Overview
- 12.1.9.2. Products
- 12.1.9.3. Company Financials
- 12.1.9.4. SWOT Analysis
- 12.1.10 CIRCOR Aerospac
- 12.1.10.1. Company Overview
- 12.1.10.2. Products
- 12.1.10.3. Company Financials
- 12.1.10.4. SWOT Analysis
- 12.1.1 Safran
- 12.2. Market Entropy
- 12.2.1 Company's Key Areas Served
- 12.2.2 Recent Developments
- 12.3. Company Market Share Analysis 2025
- 12.3.1 Top 5 Companies Market Share Analysis
- 12.3.2 Top 3 Companies Market Share Analysis
- 12.4. List of Potential Customers
- 13. Research Methodology
List of Figures
- Figure 1: Global Commercial Aircraft Lavatory System Industry Revenue Breakdown (Million, %) by Region 2025 & 2033
- Figure 2: North America Commercial Aircraft Lavatory System Industry Revenue (Million), by Production Analysis 2025 & 2033
- Figure 3: North America Commercial Aircraft Lavatory System Industry Revenue Share (%), by Production Analysis 2025 & 2033
- Figure 4: North America Commercial Aircraft Lavatory System Industry Revenue (Million), by Consumption Analysis 2025 & 2033
- Figure 5: North America Commercial Aircraft Lavatory System Industry Revenue Share (%), by Consumption Analysis 2025 & 2033
- Figure 6: North America Commercial Aircraft Lavatory System Industry Revenue (Million), by Import Market Analysis (Value & Volume) 2025 & 2033
- Figure 7: North America Commercial Aircraft Lavatory System Industry Revenue Share (%), by Import Market Analysis (Value & Volume) 2025 & 2033
- Figure 8: North America Commercial Aircraft Lavatory System Industry Revenue (Million), by Export Market Analysis (Value & Volume) 2025 & 2033
- Figure 9: North America Commercial Aircraft Lavatory System Industry Revenue Share (%), by Export Market Analysis (Value & Volume) 2025 & 2033
- Figure 10: North America Commercial Aircraft Lavatory System Industry Revenue (Million), by Price Trend Analysis 2025 & 2033
- Figure 11: North America Commercial Aircraft Lavatory System Industry Revenue Share (%), by Price Trend Analysis 2025 & 2033
- Figure 12: North America Commercial Aircraft Lavatory System Industry Revenue (Million), by Country 2025 & 2033
- Figure 13: North America Commercial Aircraft Lavatory System Industry Revenue Share (%), by Country 2025 & 2033
- Figure 14: Europe Commercial Aircraft Lavatory System Industry Revenue (Million), by Production Analysis 2025 & 2033
- Figure 15: Europe Commercial Aircraft Lavatory System Industry Revenue Share (%), by Production Analysis 2025 & 2033
- Figure 16: Europe Commercial Aircraft Lavatory System Industry Revenue (Million), by Consumption Analysis 2025 & 2033
- Figure 17: Europe Commercial Aircraft Lavatory System Industry Revenue Share (%), by Consumption Analysis 2025 & 2033
- Figure 18: Europe Commercial Aircraft Lavatory System Industry Revenue (Million), by Import Market Analysis (Value & Volume) 2025 & 2033
- Figure 19: Europe Commercial Aircraft Lavatory System Industry Revenue Share (%), by Import Market Analysis (Value & Volume) 2025 & 2033
- Figure 20: Europe Commercial Aircraft Lavatory System Industry Revenue (Million), by Export Market Analysis (Value & Volume) 2025 & 2033
- Figure 21: Europe Commercial Aircraft Lavatory System Industry Revenue Share (%), by Export Market Analysis (Value & Volume) 2025 & 2033
- Figure 22: Europe Commercial Aircraft Lavatory System Industry Revenue (Million), by Price Trend Analysis 2025 & 2033
- Figure 23: Europe Commercial Aircraft Lavatory System Industry Revenue Share (%), by Price Trend Analysis 2025 & 2033
- Figure 24: Europe Commercial Aircraft Lavatory System Industry Revenue (Million), by Country 2025 & 2033
- Figure 25: Europe Commercial Aircraft Lavatory System Industry Revenue Share (%), by Country 2025 & 2033
- Figure 26: Asia Pacific Commercial Aircraft Lavatory System Industry Revenue (Million), by Production Analysis 2025 & 2033
- Figure 27: Asia Pacific Commercial Aircraft Lavatory System Industry Revenue Share (%), by Production Analysis 2025 & 2033
- Figure 28: Asia Pacific Commercial Aircraft Lavatory System Industry Revenue (Million), by Consumption Analysis 2025 & 2033
- Figure 29: Asia Pacific Commercial Aircraft Lavatory System Industry Revenue Share (%), by Consumption Analysis 2025 & 2033
- Figure 30: Asia Pacific Commercial Aircraft Lavatory System Industry Revenue (Million), by Import Market Analysis (Value & Volume) 2025 & 2033
- Figure 31: Asia Pacific Commercial Aircraft Lavatory System Industry Revenue Share (%), by Import Market Analysis (Value & Volume) 2025 & 2033
- Figure 32: Asia Pacific Commercial Aircraft Lavatory System Industry Revenue (Million), by Export Market Analysis (Value & Volume) 2025 & 2033
- Figure 33: Asia Pacific Commercial Aircraft Lavatory System Industry Revenue Share (%), by Export Market Analysis (Value & Volume) 2025 & 2033
- Figure 34: Asia Pacific Commercial Aircraft Lavatory System Industry Revenue (Million), by Price Trend Analysis 2025 & 2033
- Figure 35: Asia Pacific Commercial Aircraft Lavatory System Industry Revenue Share (%), by Price Trend Analysis 2025 & 2033
- Figure 36: Asia Pacific Commercial Aircraft Lavatory System Industry Revenue (Million), by Country 2025 & 2033
- Figure 37: Asia Pacific Commercial Aircraft Lavatory System Industry Revenue Share (%), by Country 2025 & 2033
- Figure 38: Latin America Commercial Aircraft Lavatory System Industry Revenue (Million), by Production Analysis 2025 & 2033
- Figure 39: Latin America Commercial Aircraft Lavatory System Industry Revenue Share (%), by Production Analysis 2025 & 2033
- Figure 40: Latin America Commercial Aircraft Lavatory System Industry Revenue (Million), by Consumption Analysis 2025 & 2033
- Figure 41: Latin America Commercial Aircraft Lavatory System Industry Revenue Share (%), by Consumption Analysis 2025 & 2033
- Figure 42: Latin America Commercial Aircraft Lavatory System Industry Revenue (Million), by Import Market Analysis (Value & Volume) 2025 & 2033
- Figure 43: Latin America Commercial Aircraft Lavatory System Industry Revenue Share (%), by Import Market Analysis (Value & Volume) 2025 & 2033
- Figure 44: Latin America Commercial Aircraft Lavatory System Industry Revenue (Million), by Export Market Analysis (Value & Volume) 2025 & 2033
- Figure 45: Latin America Commercial Aircraft Lavatory System Industry Revenue Share (%), by Export Market Analysis (Value & Volume) 2025 & 2033
- Figure 46: Latin America Commercial Aircraft Lavatory System Industry Revenue (Million), by Price Trend Analysis 2025 & 2033
- Figure 47: Latin America Commercial Aircraft Lavatory System Industry Revenue Share (%), by Price Trend Analysis 2025 & 2033
- Figure 48: Latin America Commercial Aircraft Lavatory System Industry Revenue (Million), by Country 2025 & 2033
- Figure 49: Latin America Commercial Aircraft Lavatory System Industry Revenue Share (%), by Country 2025 & 2033
- Figure 50: Middle East and Africa Commercial Aircraft Lavatory System Industry Revenue (Million), by Production Analysis 2025 & 2033
- Figure 51: Middle East and Africa Commercial Aircraft Lavatory System Industry Revenue Share (%), by Production Analysis 2025 & 2033
- Figure 52: Middle East and Africa Commercial Aircraft Lavatory System Industry Revenue (Million), by Consumption Analysis 2025 & 2033
- Figure 53: Middle East and Africa Commercial Aircraft Lavatory System Industry Revenue Share (%), by Consumption Analysis 2025 & 2033
- Figure 54: Middle East and Africa Commercial Aircraft Lavatory System Industry Revenue (Million), by Import Market Analysis (Value & Volume) 2025 & 2033
- Figure 55: Middle East and Africa Commercial Aircraft Lavatory System Industry Revenue Share (%), by Import Market Analysis (Value & Volume) 2025 & 2033
- Figure 56: Middle East and Africa Commercial Aircraft Lavatory System Industry Revenue (Million), by Export Market Analysis (Value & Volume) 2025 & 2033
- Figure 57: Middle East and Africa Commercial Aircraft Lavatory System Industry Revenue Share (%), by Export Market Analysis (Value & Volume) 2025 & 2033
- Figure 58: Middle East and Africa Commercial Aircraft Lavatory System Industry Revenue (Million), by Price Trend Analysis 2025 & 2033
- Figure 59: Middle East and Africa Commercial Aircraft Lavatory System Industry Revenue Share (%), by Price Trend Analysis 2025 & 2033
- Figure 60: Middle East and Africa Commercial Aircraft Lavatory System Industry Revenue (Million), by Country 2025 & 2033
- Figure 61: Middle East and Africa Commercial Aircraft Lavatory System Industry Revenue Share (%), by Country 2025 & 2033
List of Tables
- Table 1: Global Commercial Aircraft Lavatory System Industry Revenue Million Forecast, by Production Analysis 2020 & 2033
- Table 2: Global Commercial Aircraft Lavatory System Industry Revenue Million Forecast, by Consumption Analysis 2020 & 2033
- Table 3: Global Commercial Aircraft Lavatory System Industry Revenue Million Forecast, by Import Market Analysis (Value & Volume) 2020 & 2033
- Table 4: Global Commercial Aircraft Lavatory System Industry Revenue Million Forecast, by Export Market Analysis (Value & Volume) 2020 & 2033
- Table 5: Global Commercial Aircraft Lavatory System Industry Revenue Million Forecast, by Price Trend Analysis 2020 & 2033
- Table 6: Global Commercial Aircraft Lavatory System Industry Revenue Million Forecast, by Region 2020 & 2033
- Table 7: Global Commercial Aircraft Lavatory System Industry Revenue Million Forecast, by Production Analysis 2020 & 2033
- Table 8: Global Commercial Aircraft Lavatory System Industry Revenue Million Forecast, by Consumption Analysis 2020 & 2033
- Table 9: Global Commercial Aircraft Lavatory System Industry Revenue Million Forecast, by Import Market Analysis (Value & Volume) 2020 & 2033
- Table 10: Global Commercial Aircraft Lavatory System Industry Revenue Million Forecast, by Export Market Analysis (Value & Volume) 2020 & 2033
- Table 11: Global Commercial Aircraft Lavatory System Industry Revenue Million Forecast, by Price Trend Analysis 2020 & 2033
- Table 12: Global Commercial Aircraft Lavatory System Industry Revenue Million Forecast, by Country 2020 & 2033
- Table 13: United States Commercial Aircraft Lavatory System Industry Revenue (Million) Forecast, by Application 2020 & 2033
- Table 14: Canada Commercial Aircraft Lavatory System Industry Revenue (Million) Forecast, by Application 2020 & 2033
- Table 15: Global Commercial Aircraft Lavatory System Industry Revenue Million Forecast, by Production Analysis 2020 & 2033
- Table 16: Global Commercial Aircraft Lavatory System Industry Revenue Million Forecast, by Consumption Analysis 2020 & 2033
- Table 17: Global Commercial Aircraft Lavatory System Industry Revenue Million Forecast, by Import Market Analysis (Value & Volume) 2020 & 2033
- Table 18: Global Commercial Aircraft Lavatory System Industry Revenue Million Forecast, by Export Market Analysis (Value & Volume) 2020 & 2033
- Table 19: Global Commercial Aircraft Lavatory System Industry Revenue Million Forecast, by Price Trend Analysis 2020 & 2033
- Table 20: Global Commercial Aircraft Lavatory System Industry Revenue Million Forecast, by Country 2020 & 2033
- Table 21: United Kingdom Commercial Aircraft Lavatory System Industry Revenue (Million) Forecast, by Application 2020 & 2033
- Table 22: Germany Commercial Aircraft Lavatory System Industry Revenue (Million) Forecast, by Application 2020 & 2033
- Table 23: France Commercial Aircraft Lavatory System Industry Revenue (Million) Forecast, by Application 2020 & 2033
- Table 24: Italy Commercial Aircraft Lavatory System Industry Revenue (Million) Forecast, by Application 2020 & 2033
- Table 25: Russia Commercial Aircraft Lavatory System Industry Revenue (Million) Forecast, by Application 2020 & 2033
- Table 26: Rest of Europe Commercial Aircraft Lavatory System Industry Revenue (Million) Forecast, by Application 2020 & 2033
- Table 27: Global Commercial Aircraft Lavatory System Industry Revenue Million Forecast, by Production Analysis 2020 & 2033
- Table 28: Global Commercial Aircraft Lavatory System Industry Revenue Million Forecast, by Consumption Analysis 2020 & 2033
- Table 29: Global Commercial Aircraft Lavatory System Industry Revenue Million Forecast, by Import Market Analysis (Value & Volume) 2020 & 2033
- Table 30: Global Commercial Aircraft Lavatory System Industry Revenue Million Forecast, by Export Market Analysis (Value & Volume) 2020 & 2033
- Table 31: Global Commercial Aircraft Lavatory System Industry Revenue Million Forecast, by Price Trend Analysis 2020 & 2033
- Table 32: Global Commercial Aircraft Lavatory System Industry Revenue Million Forecast, by Country 2020 & 2033
- Table 33: China Commercial Aircraft Lavatory System Industry Revenue (Million) Forecast, by Application 2020 & 2033
- Table 34: India Commercial Aircraft Lavatory System Industry Revenue (Million) Forecast, by Application 2020 & 2033
- Table 35: Japan Commercial Aircraft Lavatory System Industry Revenue (Million) Forecast, by Application 2020 & 2033
- Table 36: South Korea Commercial Aircraft Lavatory System Industry Revenue (Million) Forecast, by Application 2020 & 2033
- Table 37: Rest of Asia Pacific Commercial Aircraft Lavatory System Industry Revenue (Million) Forecast, by Application 2020 & 2033
- Table 38: Global Commercial Aircraft Lavatory System Industry Revenue Million Forecast, by Production Analysis 2020 & 2033
- Table 39: Global Commercial Aircraft Lavatory System Industry Revenue Million Forecast, by Consumption Analysis 2020 & 2033
- Table 40: Global Commercial Aircraft Lavatory System Industry Revenue Million Forecast, by Import Market Analysis (Value & Volume) 2020 & 2033
- Table 41: Global Commercial Aircraft Lavatory System Industry Revenue Million Forecast, by Export Market Analysis (Value & Volume) 2020 & 2033
- Table 42: Global Commercial Aircraft Lavatory System Industry Revenue Million Forecast, by Price Trend Analysis 2020 & 2033
- Table 43: Global Commercial Aircraft Lavatory System Industry Revenue Million Forecast, by Country 2020 & 2033
- Table 44: Brazil Commercial Aircraft Lavatory System Industry Revenue (Million) Forecast, by Application 2020 & 2033
- Table 45: Mexico Commercial Aircraft Lavatory System Industry Revenue (Million) Forecast, by Application 2020 & 2033
- Table 46: Rest of Latin America Commercial Aircraft Lavatory System Industry Revenue (Million) Forecast, by Application 2020 & 2033
- Table 47: Global Commercial Aircraft Lavatory System Industry Revenue Million Forecast, by Production Analysis 2020 & 2033
- Table 48: Global Commercial Aircraft Lavatory System Industry Revenue Million Forecast, by Consumption Analysis 2020 & 2033
- Table 49: Global Commercial Aircraft Lavatory System Industry Revenue Million Forecast, by Import Market Analysis (Value & Volume) 2020 & 2033
- Table 50: Global Commercial Aircraft Lavatory System Industry Revenue Million Forecast, by Export Market Analysis (Value & Volume) 2020 & 2033
- Table 51: Global Commercial Aircraft Lavatory System Industry Revenue Million Forecast, by Price Trend Analysis 2020 & 2033
- Table 52: Global Commercial Aircraft Lavatory System Industry Revenue Million Forecast, by Country 2020 & 2033
- Table 53: United Arab Emirates Commercial Aircraft Lavatory System Industry Revenue (Million) Forecast, by Application 2020 & 2033
- Table 54: Saudi Arabia Commercial Aircraft Lavatory System Industry Revenue (Million) Forecast, by Application 2020 & 2033
- Table 55: Qatar Commercial Aircraft Lavatory System Industry Revenue (Million) Forecast, by Application 2020 & 2033
- Table 56: South Africa Commercial Aircraft Lavatory System Industry Revenue (Million) Forecast, by Application 2020 & 2033
- Table 57: Rest of Middle East and Africa Commercial Aircraft Lavatory System Industry Revenue (Million) Forecast, by Application 2020 & 2033
Frequently Asked Questions
1. What is the projected Compound Annual Growth Rate (CAGR) of the Commercial Aircraft Lavatory System Industry?
The projected CAGR is approximately 6.22%.
2. Which companies are prominent players in the Commercial Aircraft Lavatory System Industry?
Key companies in the market include Safran, Collins Aerospace (RTX Corporation), Geven SPA, JAMCO Corporation, Diehl Stiftung & Co KG, The NORDAM Group LLC, Yokohama Aerospace America Inc, Satys, Hong Kong Aircraft Engineering Company Limited, CIRCOR Aerospac.
3. What are the main segments of the Commercial Aircraft Lavatory System Industry?
The market segments include Production Analysis, Consumption Analysis, Import Market Analysis (Value & Volume), Export Market Analysis (Value & Volume), Price Trend Analysis.
4. Can you provide details about the market size?
The market size is estimated to be USD 430.62 Million as of 2022.
5. What are some drivers contributing to market growth?
N/A
6. What are the notable trends driving market growth?
Wide-body Segment is Dominate Market Share During the Forecast Period.
7. Are there any restraints impacting market growth?
N/A
8. Can you provide examples of recent developments in the market?
N/A
9. What pricing options are available for accessing the report?
Pricing options include single-user, multi-user, and enterprise licenses priced at USD 4750, USD 5250, and USD 8750 respectively.
10. Is the market size provided in terms of value or volume?
The market size is provided in terms of value, measured in Million.
11. Are there any specific market keywords associated with the report?
Yes, the market keyword associated with the report is "Commercial Aircraft Lavatory System Industry," which aids in identifying and referencing the specific market segment covered.
12. How do I determine which pricing option suits my needs best?
The pricing options vary based on user requirements and access needs. Individual users may opt for single-user licenses, while businesses requiring broader access may choose multi-user or enterprise licenses for cost-effective access to the report.
13. Are there any additional resources or data provided in the Commercial Aircraft Lavatory System Industry report?
While the report offers comprehensive insights, it's advisable to review the specific contents or supplementary materials provided to ascertain if additional resources or data are available.
14. How can I stay updated on further developments or reports in the Commercial Aircraft Lavatory System Industry?
To stay informed about further developments, trends, and reports in the Commercial Aircraft Lavatory System Industry, consider subscribing to industry newsletters, following relevant companies and organizations, or regularly checking reputable industry news sources and publications.
Methodology
Step 1 - Identification of Relevant Samples Size from Population Database


Step 2 - Approaches for Defining Global Market Size (Value, Volume* & Price*)

Note*: In applicable scenarios
Step 3 - Data Sources
Primary Research
- Web Analytics
- Survey Reports
- Research Institute
- Latest Research Reports
- Opinion Leaders
Secondary Research
- Annual Reports
- White Paper
- Latest Press Release
- Industry Association
- Paid Database
- Investor Presentations

Step 4 - Data Triangulation
Involves using different sources of information in order to increase the validity of a study
These sources are likely to be stakeholders in a program - participants, other researchers, program staff, other community members, and so on.
Then we put all data in single framework & apply various statistical tools to find out the dynamic on the market.
During the analysis stage, feedback from the stakeholder groups would be compared to determine areas of agreement as well as areas of divergence