

Key Insights
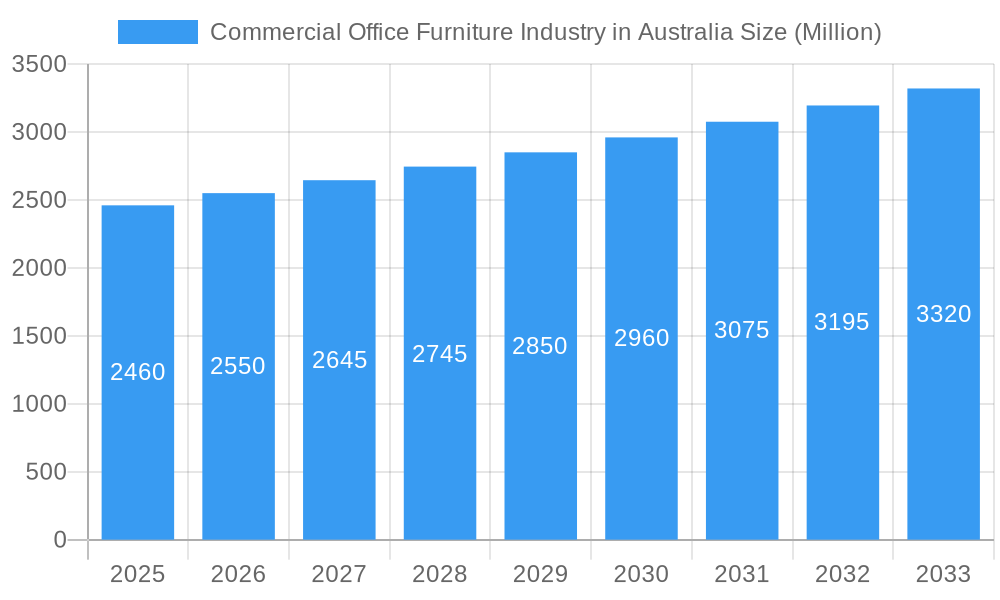
The Australian commercial office furniture market, valued at $2.46 billion in 2025, is projected to experience steady growth, exhibiting a Compound Annual Growth Rate (CAGR) of 3.54% from 2025 to 2033. This growth is fueled by several key drivers. The increasing number of startups and established businesses expanding their operations in Australia contributes significantly to the demand for office furniture. Furthermore, a growing emphasis on creating ergonomic and aesthetically pleasing workspaces, coupled with the ongoing trend of hybrid work models, is driving investment in high-quality, adaptable furniture solutions. The preference for modular and customizable furniture allows companies to easily adapt their office layouts to meet changing needs, further stimulating market growth. However, economic fluctuations and potential supply chain disruptions pose challenges to the market's sustained expansion. While the offline distribution channel currently dominates, the online sector is experiencing growth, reflecting evolving purchasing preferences. Segmentation reveals strong demand across various product categories, including seating (office chairs, guest chairs, and sofas), storage units (cabinets and shelves), and tables (conference and occasional tables). Wood, metal, and plastic remain popular materials, reflecting diverse aesthetic and functional requirements. Leading players like Advanta, Krost Business Furniture, and others are vying for market share through product innovation, strategic partnerships, and expanding distribution networks.
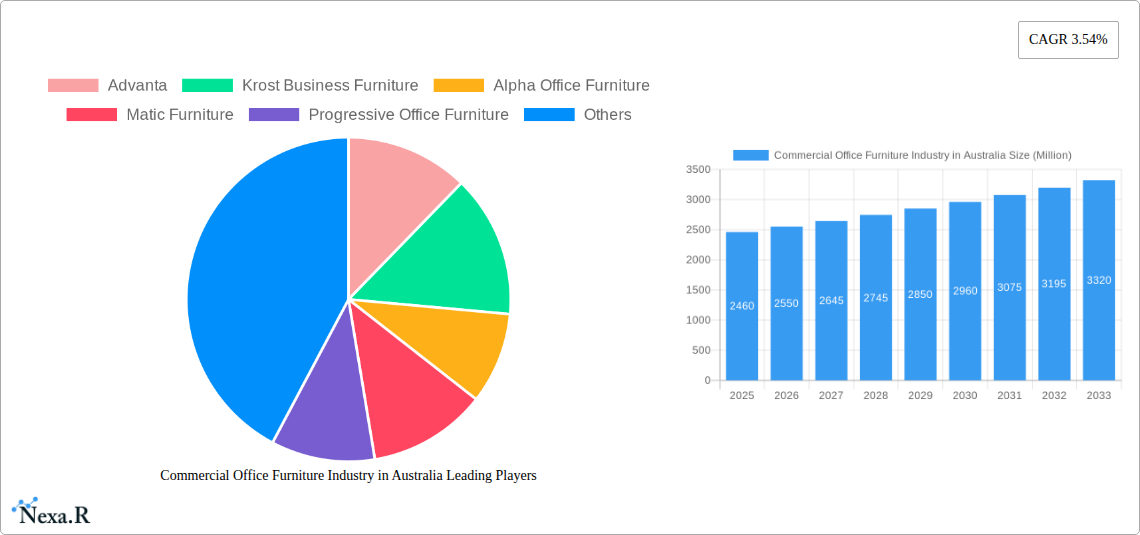
Commercial Office Furniture Industry in Australia Market Size (In Billion)
The market is segmented by material (wood, metal, plastic, other materials), product type (seating, storage units, tables, others), and distribution channel (offline, online). The strong presence of established players and emerging companies indicates a competitive market landscape. Future growth will likely be shaped by technological advancements in office furniture design, the increasing integration of smart office technologies, and the ongoing adaptation to evolving workplace strategies. The emphasis on sustainability and environmentally friendly materials is also anticipated to influence purchasing decisions, impacting the material segment in the years to come. A deeper understanding of these trends and challenges will be critical for companies operating in the Australian commercial office furniture market to achieve sustainable growth and maintain a competitive edge.
Commercial Office Furniture Industry in Australia Company Market Share
Commercial Office Furniture Industry in Australia: A Comprehensive Market Report (2019-2033)
This in-depth report provides a comprehensive analysis of the Australian commercial office furniture market, covering market dynamics, growth trends, key players, and future outlook. The study period spans from 2019 to 2033, with 2025 serving as the base and estimated year. The report leverages extensive market research and data analysis to offer actionable insights for businesses operating in or planning to enter this dynamic sector. This report is invaluable for industry professionals, investors, and researchers seeking a clear understanding of this significant market.
Commercial Office Furniture Industry in Australia Market Dynamics & Structure
The Australian commercial office furniture market is characterized by a moderately concentrated landscape, with several established players alongside smaller, specialized businesses. Market concentration is estimated at xx%, with the top 5 players holding approximately xx% of the market share in 2025. Technological innovation, driven by increasing demand for ergonomic and sustainable products, is a key driver. Regulatory frameworks concerning workplace safety and environmental standards significantly impact product design and manufacturing processes. The market faces competition from substitute products like repurposed furniture and modular systems. End-user demographics are shifting towards younger, tech-savvy professionals, who prioritize flexible and adaptable workspaces. M&A activity in the sector is moderate, with approximately xx deals recorded in the historical period (2019-2024), primarily focused on expanding product portfolios and market reach.
- Market Concentration: xx% (2025)
- Top 5 Players Market Share: xx% (2025)
- M&A Deals (2019-2024): xx
- Key Innovation Drivers: Ergonomics, Sustainability, Technology Integration
- Regulatory Impacts: Workplace Safety Standards, Environmental Regulations
Commercial Office Furniture Industry in Australia Growth Trends & Insights
The Australian commercial office furniture market experienced steady growth during the historical period (2019-2024), with a CAGR of xx%. Market size reached approximately xx million units in 2025. This growth is driven by factors such as increasing office construction and renovations, the rising adoption of flexible workspace solutions, and growing awareness of workplace ergonomics. Technological disruptions, such as the integration of smart office technology and the use of data-driven design, are transforming the industry. Consumer behavior is shifting towards a preference for sustainable and customizable furniture, reflecting a broader shift towards environmentally conscious practices. Market penetration of ergonomic seating, a key product segment, is estimated at xx% in 2025, showcasing significant room for future growth. The forecast period (2025-2033) projects a CAGR of xx%, with the market size expected to reach xx million units by 2033.
Dominant Regions, Countries, or Segments in Commercial Office Furniture Industry in Australia
The major cities of Sydney, Melbourne, and Brisbane dominate the Australian commercial office furniture market, accounting for approximately xx% of total sales in 2025. Within product segments, seating (particularly office chairs) holds the largest market share, followed by storage units and tables. The "Wood" material segment continues to hold significant market share due to its aesthetic appeal and perceived quality, although metal and other materials are gaining traction due to their durability and cost-effectiveness. The offline distribution channel remains the primary sales avenue, but online sales are witnessing robust growth, reflecting changing consumer preferences and the increasing availability of e-commerce platforms.
- Leading Regions: Sydney, Melbourne, Brisbane
- Dominant Product Segment: Seating (Office Chairs)
- Leading Material Segment: Wood
- Primary Distribution Channel: Offline
- Fastest-Growing Segment: Online Sales
Commercial Office Furniture Industry in Australia Product Landscape
Product innovation focuses on ergonomic design, sustainable materials (recycled content, sustainably sourced timber), and smart features such as height-adjustable desks and integrated power solutions. Performance metrics are increasingly focused on durability, longevity, and environmental impact. Unique selling propositions often center on customization options, modular designs, and advanced technology integration. Technological advancements are driving the development of sophisticated seating systems, intelligent storage solutions, and interactive collaborative tables.
Key Drivers, Barriers & Challenges in Commercial Office Furniture Industry in Australia
Key Drivers: Growing office construction activity, increasing demand for ergonomic furniture, rising adoption of activity-based working, government initiatives promoting sustainable building practices.
Key Challenges: Fluctuations in raw material costs, intense competition, supply chain disruptions (particularly during the pandemic), and the increasing pressure to adopt sustainable manufacturing practices. These challenges collectively impact profitability and growth projections by an estimated xx% in 2025.
Emerging Opportunities in Commercial Office Furniture Industry in Australia
Emerging opportunities lie in the growing demand for flexible workspace solutions, increasing adoption of co-working spaces, and a rising focus on employee wellbeing. Untapped markets include specialized furniture for healthcare and education settings. Innovative applications, such as integrating technology into furniture for improved collaboration and productivity, offer significant growth potential. Evolving consumer preferences towards sustainable and ethically sourced products present opportunities for companies to differentiate themselves.
Growth Accelerators in the Commercial Office Furniture Industry in Australia Industry
Long-term growth will be fueled by technological advancements in materials science, design, and manufacturing processes, enabling the creation of more sustainable, ergonomic, and intelligent office furniture. Strategic partnerships between furniture manufacturers and technology companies will lead to innovative product offerings. Expanding into new market segments, such as healthcare and education, and leveraging the growing online sales channel will also drive market expansion.
Key Players Shaping the Commercial Office Furniture Industry in Australia Market
- Advanta
- Krost Business Furniture
- Alpha Office Furniture
- Matic Furniture
- Progressive Office Furniture
- AMS Furniture
- Aspen Commercial Interiors
- Emanate Design
- Diami
- Burgtec
- Fursys
- BFX Furniture
Notable Milestones in Commercial Office Furniture Industry in Australia Sector
- 2020: Increased demand for home office furniture due to pandemic-induced remote work.
- 2022: Several major players launched new product lines featuring sustainable materials.
- 2023: Significant investment in automation and digitalization by leading manufacturers.
- 2024: Increased adoption of modular office furniture systems.
In-Depth Commercial Office Furniture Industry in Australia Market Outlook
The Australian commercial office furniture market is poised for continued growth, driven by strong economic fundamentals and increasing focus on creating healthy and productive workspaces. Strategic opportunities lie in developing innovative, sustainable, and technologically advanced products, fostering strategic partnerships, and expanding into new market segments. The market’s future potential is considerable, with a projected market size of xx million units by 2033, presenting significant opportunities for established players and new entrants alike.
Commercial Office Furniture Industry in Australia Segmentation
-
1. Material
- 1.1. Wood
- 1.2. Metal
- 1.3. Plastic
- 1.4. Other Materials
-
2. Product
- 2.1. Seating
- 2.2. Storage Units (Bins & Shelves, Cabinets, Others)
- 2.3. Tables (
-
3. Distribution Channel
- 3.1. Offline
- 3.2. Online
Commercial Office Furniture Industry in Australia Segmentation By Geography
-
1. North America
- 1.1. United States
- 1.2. Canada
- 1.3. Mexico
-
2. South America
- 2.1. Brazil
- 2.2. Argentina
- 2.3. Rest of South America
-
3. Europe
- 3.1. United Kingdom
- 3.2. Germany
- 3.3. France
- 3.4. Italy
- 3.5. Spain
- 3.6. Russia
- 3.7. Benelux
- 3.8. Nordics
- 3.9. Rest of Europe
-
4. Middle East & Africa
- 4.1. Turkey
- 4.2. Israel
- 4.3. GCC
- 4.4. North Africa
- 4.5. South Africa
- 4.6. Rest of Middle East & Africa
-
5. Asia Pacific
- 5.1. China
- 5.2. India
- 5.3. Japan
- 5.4. South Korea
- 5.5. ASEAN
- 5.6. Oceania
- 5.7. Rest of Asia Pacific
Commercial Office Furniture Industry in Australia Regional Market Share
Geographic Coverage of Commercial Office Furniture Industry in Australia
Commercial Office Furniture Industry in Australia REPORT HIGHLIGHTS
| Aspects | Details |
|---|---|
| Study Period | 2020-2034 |
| Base Year | 2025 |
| Estimated Year | 2026 |
| Forecast Period | 2026-2034 |
| Historical Period | 2020-2025 |
| Growth Rate | CAGR of 3.54% from 2020-2034 |
| Segmentation |
|
Table of Contents
- 1. Introduction
- 1.1. Research Scope
- 1.2. Market Segmentation
- 1.3. Research Objective
- 1.4. Definitions and Assumptions
- 2. Executive Summary
- 2.1. Market Snapshot
- 3. Market Dynamics
- 3.1. Market Drivers
- 3.2. Market Restrains
- 3.3. Market Trends
- 3.4. Market Opportunities
- 4. Market Factor Analysis
- 4.1. Porters Five Forces
- 4.1.1. Bargaining Power of Suppliers
- 4.1.2. Bargaining Power of Buyers
- 4.1.3. Threat of New Entrants
- 4.1.4. Threat of Substitutes
- 4.1.5. Competitive Rivalry
- 4.2. PESTEL analysis
- 4.3. BCG Analysis
- 4.3.1. Stars (High Growth, High Market Share)
- 4.3.2. Cash Cows (Low Growth, High Market Share)
- 4.3.3. Question Mark (High Growth, Low Market Share)
- 4.3.4. Dogs (Low Growth, Low Market Share)
- 4.4. Ansoff Matrix Analysis
- 4.5. Supply Chain Analysis
- 4.6. Regulatory Landscape
- 4.7. Current Market Potential and Opportunity Assessment (TAM–SAM–SOM Framework)
- 4.8. NRP Analyst Note
- 4.1. Porters Five Forces
- 5. Market Analysis, Insights and Forecast 2021-2033
- 5.1. Market Analysis, Insights and Forecast - by Material
- 5.1.1. Wood
- 5.1.2. Metal
- 5.1.3. Plastic
- 5.1.4. Other Materials
- 5.2. Market Analysis, Insights and Forecast - by Product
- 5.2.1. Seating
- 5.2.2. Storage Units (Bins & Shelves, Cabinets, Others)
- 5.2.3. Tables (
- 5.3. Market Analysis, Insights and Forecast - by Distribution Channel
- 5.3.1. Offline
- 5.3.2. Online
- 5.4. Market Analysis, Insights and Forecast - by Region
- 5.4.1. North America
- 5.4.2. South America
- 5.4.3. Europe
- 5.4.4. Middle East & Africa
- 5.4.5. Asia Pacific
- 5.1. Market Analysis, Insights and Forecast - by Material
- 6. Global Commercial Office Furniture Industry in Australia Analysis, Insights and Forecast, 2021-2033
- 6.1. Market Analysis, Insights and Forecast - by Material
- 6.1.1. Wood
- 6.1.2. Metal
- 6.1.3. Plastic
- 6.1.4. Other Materials
- 6.2. Market Analysis, Insights and Forecast - by Product
- 6.2.1. Seating
- 6.2.2. Storage Units (Bins & Shelves, Cabinets, Others)
- 6.2.3. Tables (
- 6.3. Market Analysis, Insights and Forecast - by Distribution Channel
- 6.3.1. Offline
- 6.3.2. Online
- 6.1. Market Analysis, Insights and Forecast - by Material
- 7. North America Commercial Office Furniture Industry in Australia Analysis, Insights and Forecast, 2020-2032
- 7.1. Market Analysis, Insights and Forecast - by Material
- 7.1.1. Wood
- 7.1.2. Metal
- 7.1.3. Plastic
- 7.1.4. Other Materials
- 7.2. Market Analysis, Insights and Forecast - by Product
- 7.2.1. Seating
- 7.2.2. Storage Units (Bins & Shelves, Cabinets, Others)
- 7.2.3. Tables (
- 7.3. Market Analysis, Insights and Forecast - by Distribution Channel
- 7.3.1. Offline
- 7.3.2. Online
- 7.1. Market Analysis, Insights and Forecast - by Material
- 8. South America Commercial Office Furniture Industry in Australia Analysis, Insights and Forecast, 2020-2032
- 8.1. Market Analysis, Insights and Forecast - by Material
- 8.1.1. Wood
- 8.1.2. Metal
- 8.1.3. Plastic
- 8.1.4. Other Materials
- 8.2. Market Analysis, Insights and Forecast - by Product
- 8.2.1. Seating
- 8.2.2. Storage Units (Bins & Shelves, Cabinets, Others)
- 8.2.3. Tables (
- 8.3. Market Analysis, Insights and Forecast - by Distribution Channel
- 8.3.1. Offline
- 8.3.2. Online
- 8.1. Market Analysis, Insights and Forecast - by Material
- 9. Europe Commercial Office Furniture Industry in Australia Analysis, Insights and Forecast, 2020-2032
- 9.1. Market Analysis, Insights and Forecast - by Material
- 9.1.1. Wood
- 9.1.2. Metal
- 9.1.3. Plastic
- 9.1.4. Other Materials
- 9.2. Market Analysis, Insights and Forecast - by Product
- 9.2.1. Seating
- 9.2.2. Storage Units (Bins & Shelves, Cabinets, Others)
- 9.2.3. Tables (
- 9.3. Market Analysis, Insights and Forecast - by Distribution Channel
- 9.3.1. Offline
- 9.3.2. Online
- 9.1. Market Analysis, Insights and Forecast - by Material
- 10. Middle East & Africa Commercial Office Furniture Industry in Australia Analysis, Insights and Forecast, 2020-2032
- 10.1. Market Analysis, Insights and Forecast - by Material
- 10.1.1. Wood
- 10.1.2. Metal
- 10.1.3. Plastic
- 10.1.4. Other Materials
- 10.2. Market Analysis, Insights and Forecast - by Product
- 10.2.1. Seating
- 10.2.2. Storage Units (Bins & Shelves, Cabinets, Others)
- 10.2.3. Tables (
- 10.3. Market Analysis, Insights and Forecast - by Distribution Channel
- 10.3.1. Offline
- 10.3.2. Online
- 10.1. Market Analysis, Insights and Forecast - by Material
- 11. Asia Pacific Commercial Office Furniture Industry in Australia Analysis, Insights and Forecast, 2020-2032
- 11.1. Market Analysis, Insights and Forecast - by Material
- 11.1.1. Wood
- 11.1.2. Metal
- 11.1.3. Plastic
- 11.1.4. Other Materials
- 11.2. Market Analysis, Insights and Forecast - by Product
- 11.2.1. Seating
- 11.2.2. Storage Units (Bins & Shelves, Cabinets, Others)
- 11.2.3. Tables (
- 11.3. Market Analysis, Insights and Forecast - by Distribution Channel
- 11.3.1. Offline
- 11.3.2. Online
- 11.1. Market Analysis, Insights and Forecast - by Material
- 12. Competitive Analysis
- 12.1. Company Profiles
- 12.1.1 Advanta
- 12.1.1.1. Company Overview
- 12.1.1.2. Products
- 12.1.1.3. Company Financials
- 12.1.1.4. SWOT Analysis
- 12.1.2 Krost Business Furniture
- 12.1.2.1. Company Overview
- 12.1.2.2. Products
- 12.1.2.3. Company Financials
- 12.1.2.4. SWOT Analysis
- 12.1.3 Alpha Office Furniture
- 12.1.3.1. Company Overview
- 12.1.3.2. Products
- 12.1.3.3. Company Financials
- 12.1.3.4. SWOT Analysis
- 12.1.4 Matic Furniture
- 12.1.4.1. Company Overview
- 12.1.4.2. Products
- 12.1.4.3. Company Financials
- 12.1.4.4. SWOT Analysis
- 12.1.5 Progressive Office Furniture
- 12.1.5.1. Company Overview
- 12.1.5.2. Products
- 12.1.5.3. Company Financials
- 12.1.5.4. SWOT Analysis
- 12.1.6 AMS Furniture
- 12.1.6.1. Company Overview
- 12.1.6.2. Products
- 12.1.6.3. Company Financials
- 12.1.6.4. SWOT Analysis
- 12.1.7 Aspen Commercial Interiors
- 12.1.7.1. Company Overview
- 12.1.7.2. Products
- 12.1.7.3. Company Financials
- 12.1.7.4. SWOT Analysis
- 12.1.8 Emanate Design
- 12.1.8.1. Company Overview
- 12.1.8.2. Products
- 12.1.8.3. Company Financials
- 12.1.8.4. SWOT Analysis
- 12.1.9 Diami
- 12.1.9.1. Company Overview
- 12.1.9.2. Products
- 12.1.9.3. Company Financials
- 12.1.9.4. SWOT Analysis
- 12.1.10 Burgtec
- 12.1.10.1. Company Overview
- 12.1.10.2. Products
- 12.1.10.3. Company Financials
- 12.1.10.4. SWOT Analysis
- 12.1.11 Fursys
- 12.1.11.1. Company Overview
- 12.1.11.2. Products
- 12.1.11.3. Company Financials
- 12.1.11.4. SWOT Analysis
- 12.1.12 BFX Furniture
- 12.1.12.1. Company Overview
- 12.1.12.2. Products
- 12.1.12.3. Company Financials
- 12.1.12.4. SWOT Analysis
- 12.1.1 Advanta
- 12.2. Market Entropy
- 12.2.1 Company's Key Areas Served
- 12.2.2 Recent Developments
- 12.3. Company Market Share Analysis 2025
- 12.3.1 Top 5 Companies Market Share Analysis
- 12.3.2 Top 3 Companies Market Share Analysis
- 12.4. List of Potential Customers
- 13. Research Methodology
List of Figures
- Figure 1: Global Commercial Office Furniture Industry in Australia Revenue Breakdown (Million, %) by Region 2025 & 2033
- Figure 2: Global Commercial Office Furniture Industry in Australia Volume Breakdown (K Unit, %) by Region 2025 & 2033
- Figure 3: North America Commercial Office Furniture Industry in Australia Revenue (Million), by Material 2025 & 2033
- Figure 4: North America Commercial Office Furniture Industry in Australia Volume (K Unit), by Material 2025 & 2033
- Figure 5: North America Commercial Office Furniture Industry in Australia Revenue Share (%), by Material 2025 & 2033
- Figure 6: North America Commercial Office Furniture Industry in Australia Volume Share (%), by Material 2025 & 2033
- Figure 7: North America Commercial Office Furniture Industry in Australia Revenue (Million), by Product 2025 & 2033
- Figure 8: North America Commercial Office Furniture Industry in Australia Volume (K Unit), by Product 2025 & 2033
- Figure 9: North America Commercial Office Furniture Industry in Australia Revenue Share (%), by Product 2025 & 2033
- Figure 10: North America Commercial Office Furniture Industry in Australia Volume Share (%), by Product 2025 & 2033
- Figure 11: North America Commercial Office Furniture Industry in Australia Revenue (Million), by Distribution Channel 2025 & 2033
- Figure 12: North America Commercial Office Furniture Industry in Australia Volume (K Unit), by Distribution Channel 2025 & 2033
- Figure 13: North America Commercial Office Furniture Industry in Australia Revenue Share (%), by Distribution Channel 2025 & 2033
- Figure 14: North America Commercial Office Furniture Industry in Australia Volume Share (%), by Distribution Channel 2025 & 2033
- Figure 15: North America Commercial Office Furniture Industry in Australia Revenue (Million), by Country 2025 & 2033
- Figure 16: North America Commercial Office Furniture Industry in Australia Volume (K Unit), by Country 2025 & 2033
- Figure 17: North America Commercial Office Furniture Industry in Australia Revenue Share (%), by Country 2025 & 2033
- Figure 18: North America Commercial Office Furniture Industry in Australia Volume Share (%), by Country 2025 & 2033
- Figure 19: South America Commercial Office Furniture Industry in Australia Revenue (Million), by Material 2025 & 2033
- Figure 20: South America Commercial Office Furniture Industry in Australia Volume (K Unit), by Material 2025 & 2033
- Figure 21: South America Commercial Office Furniture Industry in Australia Revenue Share (%), by Material 2025 & 2033
- Figure 22: South America Commercial Office Furniture Industry in Australia Volume Share (%), by Material 2025 & 2033
- Figure 23: South America Commercial Office Furniture Industry in Australia Revenue (Million), by Product 2025 & 2033
- Figure 24: South America Commercial Office Furniture Industry in Australia Volume (K Unit), by Product 2025 & 2033
- Figure 25: South America Commercial Office Furniture Industry in Australia Revenue Share (%), by Product 2025 & 2033
- Figure 26: South America Commercial Office Furniture Industry in Australia Volume Share (%), by Product 2025 & 2033
- Figure 27: South America Commercial Office Furniture Industry in Australia Revenue (Million), by Distribution Channel 2025 & 2033
- Figure 28: South America Commercial Office Furniture Industry in Australia Volume (K Unit), by Distribution Channel 2025 & 2033
- Figure 29: South America Commercial Office Furniture Industry in Australia Revenue Share (%), by Distribution Channel 2025 & 2033
- Figure 30: South America Commercial Office Furniture Industry in Australia Volume Share (%), by Distribution Channel 2025 & 2033
- Figure 31: South America Commercial Office Furniture Industry in Australia Revenue (Million), by Country 2025 & 2033
- Figure 32: South America Commercial Office Furniture Industry in Australia Volume (K Unit), by Country 2025 & 2033
- Figure 33: South America Commercial Office Furniture Industry in Australia Revenue Share (%), by Country 2025 & 2033
- Figure 34: South America Commercial Office Furniture Industry in Australia Volume Share (%), by Country 2025 & 2033
- Figure 35: Europe Commercial Office Furniture Industry in Australia Revenue (Million), by Material 2025 & 2033
- Figure 36: Europe Commercial Office Furniture Industry in Australia Volume (K Unit), by Material 2025 & 2033
- Figure 37: Europe Commercial Office Furniture Industry in Australia Revenue Share (%), by Material 2025 & 2033
- Figure 38: Europe Commercial Office Furniture Industry in Australia Volume Share (%), by Material 2025 & 2033
- Figure 39: Europe Commercial Office Furniture Industry in Australia Revenue (Million), by Product 2025 & 2033
- Figure 40: Europe Commercial Office Furniture Industry in Australia Volume (K Unit), by Product 2025 & 2033
- Figure 41: Europe Commercial Office Furniture Industry in Australia Revenue Share (%), by Product 2025 & 2033
- Figure 42: Europe Commercial Office Furniture Industry in Australia Volume Share (%), by Product 2025 & 2033
- Figure 43: Europe Commercial Office Furniture Industry in Australia Revenue (Million), by Distribution Channel 2025 & 2033
- Figure 44: Europe Commercial Office Furniture Industry in Australia Volume (K Unit), by Distribution Channel 2025 & 2033
- Figure 45: Europe Commercial Office Furniture Industry in Australia Revenue Share (%), by Distribution Channel 2025 & 2033
- Figure 46: Europe Commercial Office Furniture Industry in Australia Volume Share (%), by Distribution Channel 2025 & 2033
- Figure 47: Europe Commercial Office Furniture Industry in Australia Revenue (Million), by Country 2025 & 2033
- Figure 48: Europe Commercial Office Furniture Industry in Australia Volume (K Unit), by Country 2025 & 2033
- Figure 49: Europe Commercial Office Furniture Industry in Australia Revenue Share (%), by Country 2025 & 2033
- Figure 50: Europe Commercial Office Furniture Industry in Australia Volume Share (%), by Country 2025 & 2033
- Figure 51: Middle East & Africa Commercial Office Furniture Industry in Australia Revenue (Million), by Material 2025 & 2033
- Figure 52: Middle East & Africa Commercial Office Furniture Industry in Australia Volume (K Unit), by Material 2025 & 2033
- Figure 53: Middle East & Africa Commercial Office Furniture Industry in Australia Revenue Share (%), by Material 2025 & 2033
- Figure 54: Middle East & Africa Commercial Office Furniture Industry in Australia Volume Share (%), by Material 2025 & 2033
- Figure 55: Middle East & Africa Commercial Office Furniture Industry in Australia Revenue (Million), by Product 2025 & 2033
- Figure 56: Middle East & Africa Commercial Office Furniture Industry in Australia Volume (K Unit), by Product 2025 & 2033
- Figure 57: Middle East & Africa Commercial Office Furniture Industry in Australia Revenue Share (%), by Product 2025 & 2033
- Figure 58: Middle East & Africa Commercial Office Furniture Industry in Australia Volume Share (%), by Product 2025 & 2033
- Figure 59: Middle East & Africa Commercial Office Furniture Industry in Australia Revenue (Million), by Distribution Channel 2025 & 2033
- Figure 60: Middle East & Africa Commercial Office Furniture Industry in Australia Volume (K Unit), by Distribution Channel 2025 & 2033
- Figure 61: Middle East & Africa Commercial Office Furniture Industry in Australia Revenue Share (%), by Distribution Channel 2025 & 2033
- Figure 62: Middle East & Africa Commercial Office Furniture Industry in Australia Volume Share (%), by Distribution Channel 2025 & 2033
- Figure 63: Middle East & Africa Commercial Office Furniture Industry in Australia Revenue (Million), by Country 2025 & 2033
- Figure 64: Middle East & Africa Commercial Office Furniture Industry in Australia Volume (K Unit), by Country 2025 & 2033
- Figure 65: Middle East & Africa Commercial Office Furniture Industry in Australia Revenue Share (%), by Country 2025 & 2033
- Figure 66: Middle East & Africa Commercial Office Furniture Industry in Australia Volume Share (%), by Country 2025 & 2033
- Figure 67: Asia Pacific Commercial Office Furniture Industry in Australia Revenue (Million), by Material 2025 & 2033
- Figure 68: Asia Pacific Commercial Office Furniture Industry in Australia Volume (K Unit), by Material 2025 & 2033
- Figure 69: Asia Pacific Commercial Office Furniture Industry in Australia Revenue Share (%), by Material 2025 & 2033
- Figure 70: Asia Pacific Commercial Office Furniture Industry in Australia Volume Share (%), by Material 2025 & 2033
- Figure 71: Asia Pacific Commercial Office Furniture Industry in Australia Revenue (Million), by Product 2025 & 2033
- Figure 72: Asia Pacific Commercial Office Furniture Industry in Australia Volume (K Unit), by Product 2025 & 2033
- Figure 73: Asia Pacific Commercial Office Furniture Industry in Australia Revenue Share (%), by Product 2025 & 2033
- Figure 74: Asia Pacific Commercial Office Furniture Industry in Australia Volume Share (%), by Product 2025 & 2033
- Figure 75: Asia Pacific Commercial Office Furniture Industry in Australia Revenue (Million), by Distribution Channel 2025 & 2033
- Figure 76: Asia Pacific Commercial Office Furniture Industry in Australia Volume (K Unit), by Distribution Channel 2025 & 2033
- Figure 77: Asia Pacific Commercial Office Furniture Industry in Australia Revenue Share (%), by Distribution Channel 2025 & 2033
- Figure 78: Asia Pacific Commercial Office Furniture Industry in Australia Volume Share (%), by Distribution Channel 2025 & 2033
- Figure 79: Asia Pacific Commercial Office Furniture Industry in Australia Revenue (Million), by Country 2025 & 2033
- Figure 80: Asia Pacific Commercial Office Furniture Industry in Australia Volume (K Unit), by Country 2025 & 2033
- Figure 81: Asia Pacific Commercial Office Furniture Industry in Australia Revenue Share (%), by Country 2025 & 2033
- Figure 82: Asia Pacific Commercial Office Furniture Industry in Australia Volume Share (%), by Country 2025 & 2033
List of Tables
- Table 1: Global Commercial Office Furniture Industry in Australia Revenue Million Forecast, by Material 2020 & 2033
- Table 2: Global Commercial Office Furniture Industry in Australia Volume K Unit Forecast, by Material 2020 & 2033
- Table 3: Global Commercial Office Furniture Industry in Australia Revenue Million Forecast, by Product 2020 & 2033
- Table 4: Global Commercial Office Furniture Industry in Australia Volume K Unit Forecast, by Product 2020 & 2033
- Table 5: Global Commercial Office Furniture Industry in Australia Revenue Million Forecast, by Distribution Channel 2020 & 2033
- Table 6: Global Commercial Office Furniture Industry in Australia Volume K Unit Forecast, by Distribution Channel 2020 & 2033
- Table 7: Global Commercial Office Furniture Industry in Australia Revenue Million Forecast, by Region 2020 & 2033
- Table 8: Global Commercial Office Furniture Industry in Australia Volume K Unit Forecast, by Region 2020 & 2033
- Table 9: Global Commercial Office Furniture Industry in Australia Revenue Million Forecast, by Material 2020 & 2033
- Table 10: Global Commercial Office Furniture Industry in Australia Volume K Unit Forecast, by Material 2020 & 2033
- Table 11: Global Commercial Office Furniture Industry in Australia Revenue Million Forecast, by Product 2020 & 2033
- Table 12: Global Commercial Office Furniture Industry in Australia Volume K Unit Forecast, by Product 2020 & 2033
- Table 13: Global Commercial Office Furniture Industry in Australia Revenue Million Forecast, by Distribution Channel 2020 & 2033
- Table 14: Global Commercial Office Furniture Industry in Australia Volume K Unit Forecast, by Distribution Channel 2020 & 2033
- Table 15: Global Commercial Office Furniture Industry in Australia Revenue Million Forecast, by Country 2020 & 2033
- Table 16: Global Commercial Office Furniture Industry in Australia Volume K Unit Forecast, by Country 2020 & 2033
- Table 17: United States Commercial Office Furniture Industry in Australia Revenue (Million) Forecast, by Application 2020 & 2033
- Table 18: United States Commercial Office Furniture Industry in Australia Volume (K Unit) Forecast, by Application 2020 & 2033
- Table 19: Canada Commercial Office Furniture Industry in Australia Revenue (Million) Forecast, by Application 2020 & 2033
- Table 20: Canada Commercial Office Furniture Industry in Australia Volume (K Unit) Forecast, by Application 2020 & 2033
- Table 21: Mexico Commercial Office Furniture Industry in Australia Revenue (Million) Forecast, by Application 2020 & 2033
- Table 22: Mexico Commercial Office Furniture Industry in Australia Volume (K Unit) Forecast, by Application 2020 & 2033
- Table 23: Global Commercial Office Furniture Industry in Australia Revenue Million Forecast, by Material 2020 & 2033
- Table 24: Global Commercial Office Furniture Industry in Australia Volume K Unit Forecast, by Material 2020 & 2033
- Table 25: Global Commercial Office Furniture Industry in Australia Revenue Million Forecast, by Product 2020 & 2033
- Table 26: Global Commercial Office Furniture Industry in Australia Volume K Unit Forecast, by Product 2020 & 2033
- Table 27: Global Commercial Office Furniture Industry in Australia Revenue Million Forecast, by Distribution Channel 2020 & 2033
- Table 28: Global Commercial Office Furniture Industry in Australia Volume K Unit Forecast, by Distribution Channel 2020 & 2033
- Table 29: Global Commercial Office Furniture Industry in Australia Revenue Million Forecast, by Country 2020 & 2033
- Table 30: Global Commercial Office Furniture Industry in Australia Volume K Unit Forecast, by Country 2020 & 2033
- Table 31: Brazil Commercial Office Furniture Industry in Australia Revenue (Million) Forecast, by Application 2020 & 2033
- Table 32: Brazil Commercial Office Furniture Industry in Australia Volume (K Unit) Forecast, by Application 2020 & 2033
- Table 33: Argentina Commercial Office Furniture Industry in Australia Revenue (Million) Forecast, by Application 2020 & 2033
- Table 34: Argentina Commercial Office Furniture Industry in Australia Volume (K Unit) Forecast, by Application 2020 & 2033
- Table 35: Rest of South America Commercial Office Furniture Industry in Australia Revenue (Million) Forecast, by Application 2020 & 2033
- Table 36: Rest of South America Commercial Office Furniture Industry in Australia Volume (K Unit) Forecast, by Application 2020 & 2033
- Table 37: Global Commercial Office Furniture Industry in Australia Revenue Million Forecast, by Material 2020 & 2033
- Table 38: Global Commercial Office Furniture Industry in Australia Volume K Unit Forecast, by Material 2020 & 2033
- Table 39: Global Commercial Office Furniture Industry in Australia Revenue Million Forecast, by Product 2020 & 2033
- Table 40: Global Commercial Office Furniture Industry in Australia Volume K Unit Forecast, by Product 2020 & 2033
- Table 41: Global Commercial Office Furniture Industry in Australia Revenue Million Forecast, by Distribution Channel 2020 & 2033
- Table 42: Global Commercial Office Furniture Industry in Australia Volume K Unit Forecast, by Distribution Channel 2020 & 2033
- Table 43: Global Commercial Office Furniture Industry in Australia Revenue Million Forecast, by Country 2020 & 2033
- Table 44: Global Commercial Office Furniture Industry in Australia Volume K Unit Forecast, by Country 2020 & 2033
- Table 45: United Kingdom Commercial Office Furniture Industry in Australia Revenue (Million) Forecast, by Application 2020 & 2033
- Table 46: United Kingdom Commercial Office Furniture Industry in Australia Volume (K Unit) Forecast, by Application 2020 & 2033
- Table 47: Germany Commercial Office Furniture Industry in Australia Revenue (Million) Forecast, by Application 2020 & 2033
- Table 48: Germany Commercial Office Furniture Industry in Australia Volume (K Unit) Forecast, by Application 2020 & 2033
- Table 49: France Commercial Office Furniture Industry in Australia Revenue (Million) Forecast, by Application 2020 & 2033
- Table 50: France Commercial Office Furniture Industry in Australia Volume (K Unit) Forecast, by Application 2020 & 2033
- Table 51: Italy Commercial Office Furniture Industry in Australia Revenue (Million) Forecast, by Application 2020 & 2033
- Table 52: Italy Commercial Office Furniture Industry in Australia Volume (K Unit) Forecast, by Application 2020 & 2033
- Table 53: Spain Commercial Office Furniture Industry in Australia Revenue (Million) Forecast, by Application 2020 & 2033
- Table 54: Spain Commercial Office Furniture Industry in Australia Volume (K Unit) Forecast, by Application 2020 & 2033
- Table 55: Russia Commercial Office Furniture Industry in Australia Revenue (Million) Forecast, by Application 2020 & 2033
- Table 56: Russia Commercial Office Furniture Industry in Australia Volume (K Unit) Forecast, by Application 2020 & 2033
- Table 57: Benelux Commercial Office Furniture Industry in Australia Revenue (Million) Forecast, by Application 2020 & 2033
- Table 58: Benelux Commercial Office Furniture Industry in Australia Volume (K Unit) Forecast, by Application 2020 & 2033
- Table 59: Nordics Commercial Office Furniture Industry in Australia Revenue (Million) Forecast, by Application 2020 & 2033
- Table 60: Nordics Commercial Office Furniture Industry in Australia Volume (K Unit) Forecast, by Application 2020 & 2033
- Table 61: Rest of Europe Commercial Office Furniture Industry in Australia Revenue (Million) Forecast, by Application 2020 & 2033
- Table 62: Rest of Europe Commercial Office Furniture Industry in Australia Volume (K Unit) Forecast, by Application 2020 & 2033
- Table 63: Global Commercial Office Furniture Industry in Australia Revenue Million Forecast, by Material 2020 & 2033
- Table 64: Global Commercial Office Furniture Industry in Australia Volume K Unit Forecast, by Material 2020 & 2033
- Table 65: Global Commercial Office Furniture Industry in Australia Revenue Million Forecast, by Product 2020 & 2033
- Table 66: Global Commercial Office Furniture Industry in Australia Volume K Unit Forecast, by Product 2020 & 2033
- Table 67: Global Commercial Office Furniture Industry in Australia Revenue Million Forecast, by Distribution Channel 2020 & 2033
- Table 68: Global Commercial Office Furniture Industry in Australia Volume K Unit Forecast, by Distribution Channel 2020 & 2033
- Table 69: Global Commercial Office Furniture Industry in Australia Revenue Million Forecast, by Country 2020 & 2033
- Table 70: Global Commercial Office Furniture Industry in Australia Volume K Unit Forecast, by Country 2020 & 2033
- Table 71: Turkey Commercial Office Furniture Industry in Australia Revenue (Million) Forecast, by Application 2020 & 2033
- Table 72: Turkey Commercial Office Furniture Industry in Australia Volume (K Unit) Forecast, by Application 2020 & 2033
- Table 73: Israel Commercial Office Furniture Industry in Australia Revenue (Million) Forecast, by Application 2020 & 2033
- Table 74: Israel Commercial Office Furniture Industry in Australia Volume (K Unit) Forecast, by Application 2020 & 2033
- Table 75: GCC Commercial Office Furniture Industry in Australia Revenue (Million) Forecast, by Application 2020 & 2033
- Table 76: GCC Commercial Office Furniture Industry in Australia Volume (K Unit) Forecast, by Application 2020 & 2033
- Table 77: North Africa Commercial Office Furniture Industry in Australia Revenue (Million) Forecast, by Application 2020 & 2033
- Table 78: North Africa Commercial Office Furniture Industry in Australia Volume (K Unit) Forecast, by Application 2020 & 2033
- Table 79: South Africa Commercial Office Furniture Industry in Australia Revenue (Million) Forecast, by Application 2020 & 2033
- Table 80: South Africa Commercial Office Furniture Industry in Australia Volume (K Unit) Forecast, by Application 2020 & 2033
- Table 81: Rest of Middle East & Africa Commercial Office Furniture Industry in Australia Revenue (Million) Forecast, by Application 2020 & 2033
- Table 82: Rest of Middle East & Africa Commercial Office Furniture Industry in Australia Volume (K Unit) Forecast, by Application 2020 & 2033
- Table 83: Global Commercial Office Furniture Industry in Australia Revenue Million Forecast, by Material 2020 & 2033
- Table 84: Global Commercial Office Furniture Industry in Australia Volume K Unit Forecast, by Material 2020 & 2033
- Table 85: Global Commercial Office Furniture Industry in Australia Revenue Million Forecast, by Product 2020 & 2033
- Table 86: Global Commercial Office Furniture Industry in Australia Volume K Unit Forecast, by Product 2020 & 2033
- Table 87: Global Commercial Office Furniture Industry in Australia Revenue Million Forecast, by Distribution Channel 2020 & 2033
- Table 88: Global Commercial Office Furniture Industry in Australia Volume K Unit Forecast, by Distribution Channel 2020 & 2033
- Table 89: Global Commercial Office Furniture Industry in Australia Revenue Million Forecast, by Country 2020 & 2033
- Table 90: Global Commercial Office Furniture Industry in Australia Volume K Unit Forecast, by Country 2020 & 2033
- Table 91: China Commercial Office Furniture Industry in Australia Revenue (Million) Forecast, by Application 2020 & 2033
- Table 92: China Commercial Office Furniture Industry in Australia Volume (K Unit) Forecast, by Application 2020 & 2033
- Table 93: India Commercial Office Furniture Industry in Australia Revenue (Million) Forecast, by Application 2020 & 2033
- Table 94: India Commercial Office Furniture Industry in Australia Volume (K Unit) Forecast, by Application 2020 & 2033
- Table 95: Japan Commercial Office Furniture Industry in Australia Revenue (Million) Forecast, by Application 2020 & 2033
- Table 96: Japan Commercial Office Furniture Industry in Australia Volume (K Unit) Forecast, by Application 2020 & 2033
- Table 97: South Korea Commercial Office Furniture Industry in Australia Revenue (Million) Forecast, by Application 2020 & 2033
- Table 98: South Korea Commercial Office Furniture Industry in Australia Volume (K Unit) Forecast, by Application 2020 & 2033
- Table 99: ASEAN Commercial Office Furniture Industry in Australia Revenue (Million) Forecast, by Application 2020 & 2033
- Table 100: ASEAN Commercial Office Furniture Industry in Australia Volume (K Unit) Forecast, by Application 2020 & 2033
- Table 101: Oceania Commercial Office Furniture Industry in Australia Revenue (Million) Forecast, by Application 2020 & 2033
- Table 102: Oceania Commercial Office Furniture Industry in Australia Volume (K Unit) Forecast, by Application 2020 & 2033
- Table 103: Rest of Asia Pacific Commercial Office Furniture Industry in Australia Revenue (Million) Forecast, by Application 2020 & 2033
- Table 104: Rest of Asia Pacific Commercial Office Furniture Industry in Australia Volume (K Unit) Forecast, by Application 2020 & 2033
Frequently Asked Questions
1. What is the projected Compound Annual Growth Rate (CAGR) of the Commercial Office Furniture Industry in Australia?
The projected CAGR is approximately 3.54%.
2. Which companies are prominent players in the Commercial Office Furniture Industry in Australia?
Key companies in the market include Advanta, Krost Business Furniture, Alpha Office Furniture, Matic Furniture, Progressive Office Furniture, AMS Furniture, Aspen Commercial Interiors, Emanate Design, Diami, Burgtec, Fursys, BFX Furniture.
3. What are the main segments of the Commercial Office Furniture Industry in Australia?
The market segments include Material, Product, Distribution Channel.
4. Can you provide details about the market size?
The market size is estimated to be USD 2.46 Million as of 2022.
5. What are some drivers contributing to market growth?
Rise in New Offices in South Korea; Wide Range of Design Broadening Consumer Base.
6. What are the notable trends driving market growth?
Rise in Commercial Space Construction.
7. Are there any restraints impacting market growth?
Fluctuations in Raw Material Prices and Rise in Shipping Prices; Intense Competition from Both Local and International Players.
8. Can you provide examples of recent developments in the market?
N/A
9. What pricing options are available for accessing the report?
Pricing options include single-user, multi-user, and enterprise licenses priced at USD 3800, USD 4500, and USD 5800 respectively.
10. Is the market size provided in terms of value or volume?
The market size is provided in terms of value, measured in Million and volume, measured in K Unit.
11. Are there any specific market keywords associated with the report?
Yes, the market keyword associated with the report is "Commercial Office Furniture Industry in Australia," which aids in identifying and referencing the specific market segment covered.
12. How do I determine which pricing option suits my needs best?
The pricing options vary based on user requirements and access needs. Individual users may opt for single-user licenses, while businesses requiring broader access may choose multi-user or enterprise licenses for cost-effective access to the report.
13. Are there any additional resources or data provided in the Commercial Office Furniture Industry in Australia report?
While the report offers comprehensive insights, it's advisable to review the specific contents or supplementary materials provided to ascertain if additional resources or data are available.
14. How can I stay updated on further developments or reports in the Commercial Office Furniture Industry in Australia?
To stay informed about further developments, trends, and reports in the Commercial Office Furniture Industry in Australia, consider subscribing to industry newsletters, following relevant companies and organizations, or regularly checking reputable industry news sources and publications.
Methodology
Step 1 - Identification of Relevant Samples Size from Population Database


Step 2 - Approaches for Defining Global Market Size (Value, Volume* & Price*)

Note*: In applicable scenarios
Step 3 - Data Sources
Primary Research
- Web Analytics
- Survey Reports
- Research Institute
- Latest Research Reports
- Opinion Leaders
Secondary Research
- Annual Reports
- White Paper
- Latest Press Release
- Industry Association
- Paid Database
- Investor Presentations

Step 4 - Data Triangulation
Involves using different sources of information in order to increase the validity of a study
These sources are likely to be stakeholders in a program - participants, other researchers, program staff, other community members, and so on.
Then we put all data in single framework & apply various statistical tools to find out the dynamic on the market.
During the analysis stage, feedback from the stakeholder groups would be compared to determine areas of agreement as well as areas of divergence