

Key Insights
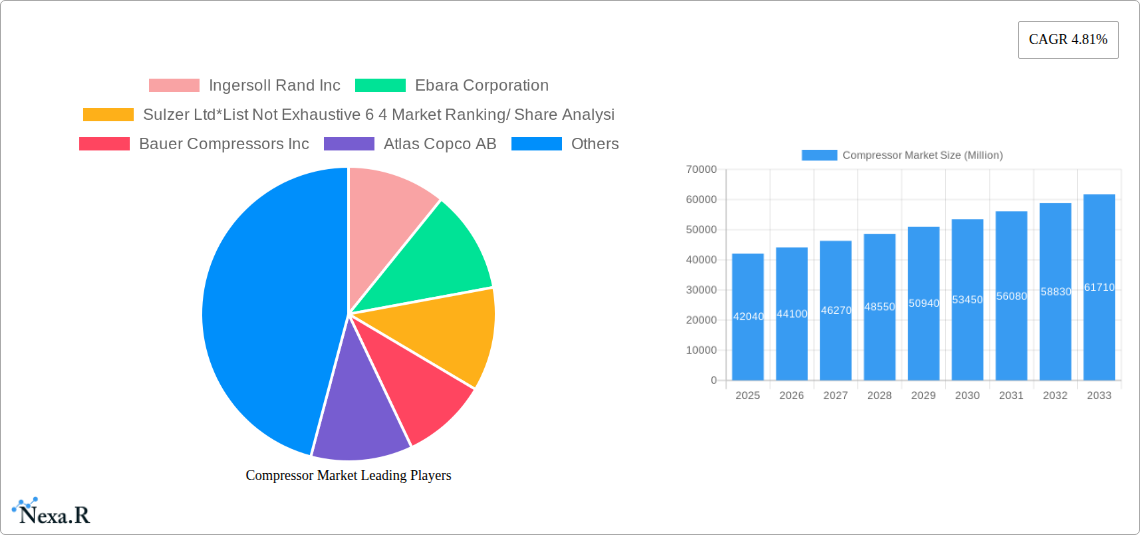
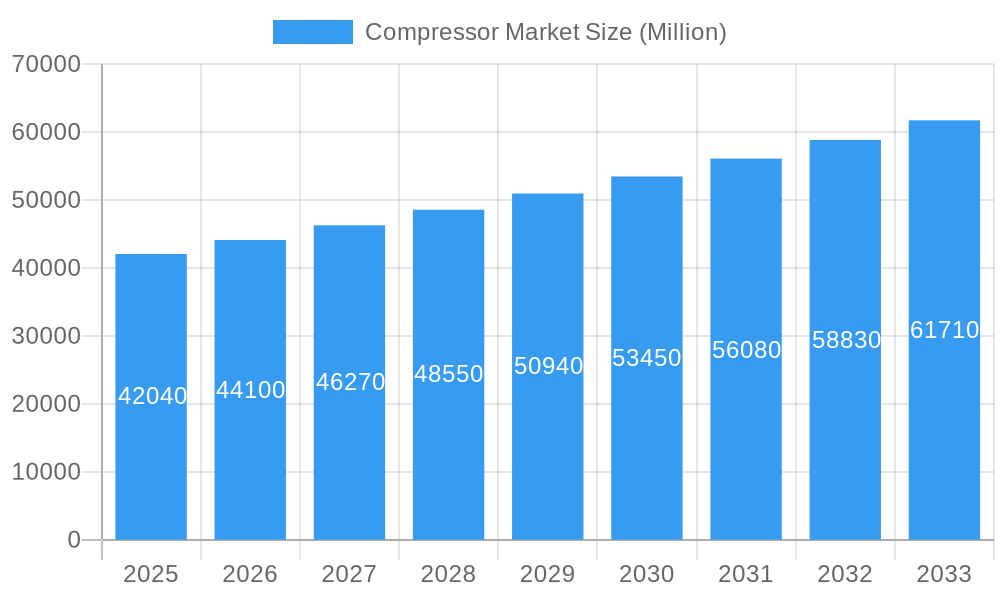
The global compressor market, valued at $42.04 billion in 2025, is projected to experience robust growth, driven by increasing industrialization and rising energy demands across key sectors. A compound annual growth rate (CAGR) of 4.81% from 2025 to 2033 indicates a significant expansion, reaching an estimated market value of approximately $60 billion by 2033. This growth is fueled by several factors. The oil and gas industry's continued reliance on compression technologies for extraction and processing remains a significant market driver. Furthermore, the expansion of power generation, particularly renewable energy sources requiring efficient compression systems, is contributing significantly to market expansion. The manufacturing sector's automation drive and the chemicals and petrochemicals industry's continuous production necessitate sophisticated compressor technologies, further bolstering market growth. Market segmentation reveals strong demand for both positive displacement and dynamic compressors, each catering to specific application needs. Geographically, North America and Asia Pacific are expected to dominate the market, driven by robust industrial activity and substantial infrastructure development. However, the market faces certain constraints including fluctuating raw material prices, stringent environmental regulations necessitating energy-efficient designs, and potential supply chain disruptions. Leading players like Ingersoll Rand, Atlas Copco, and Siemens Energy are actively investing in research and development to enhance efficiency and expand their product portfolios to maintain a competitive edge in this dynamic market.
Compressor Market Market Size (In Billion)
The competitive landscape is characterized by both established multinational corporations and specialized compressor manufacturers. Strategic partnerships, mergers, and acquisitions are expected to shape the industry's future. Companies are focusing on innovative compressor designs, incorporating advanced materials and control systems to optimize performance and reduce environmental impact. The growing adoption of Industry 4.0 principles and the integration of smart technologies are also shaping the market, driving demand for connected and data-driven compressor systems. Regional variations in regulatory landscapes and economic growth will influence the market's trajectory in the coming years. The adoption of energy-efficient technologies and sustainable practices will be crucial for companies to ensure long-term growth and maintain market competitiveness. Overall, the compressor market presents lucrative opportunities for businesses that can adapt to evolving technological advancements and customer demands.
Compressor Market Company Market Share
Compressor Market: A Comprehensive Market Report (2019-2033)
This in-depth report provides a comprehensive analysis of the global compressor market, encompassing market dynamics, growth trends, regional dominance, product landscape, key players, and future outlook. The study period covers 2019-2033, with a base year of 2025 and a forecast period of 2025-2033. The report segments the market by end-user (Oil and Gas Industry, Power Sector, Manufacturing Sector, Chemicals and Petrochemical Industry, Other End-Users) and by type (Positive Displacement, Dynamic). This analysis will be invaluable for industry professionals, investors, and strategic decision-makers seeking to understand and capitalize on opportunities within this dynamic market. The market size is projected to reach xx Million units by 2033.
Compressor Market Dynamics & Structure
The compressor market is characterized by a moderately concentrated landscape, with several major players holding significant market share. Technological innovation, driven by the demand for higher efficiency, lower emissions, and enhanced reliability, is a key driver of market growth. Stringent environmental regulations globally are shaping product development and influencing market dynamics. The market witnesses continuous mergers and acquisitions (M&A) activity, reflecting strategic consolidation among industry players. Competitive substitutes, such as alternative energy technologies, pose a potential challenge, but the overall demand for compression technologies across various sectors remains robust.
- Market Concentration: The top 10 players account for approximately 64% of the global market share in 2025.
- Technological Innovation: Focus on energy efficiency, smart technologies, and digitalization are driving innovation.
- Regulatory Framework: Emission standards and safety regulations significantly impact compressor design and manufacturing.
- M&A Activity: An estimated xx M&A deals were recorded between 2019 and 2024, with an average deal value of xx Million USD.
- Competitive Substitutes: Emerging technologies present a moderate competitive threat, particularly in niche applications.
- Innovation Barriers: High R&D investment and stringent regulatory compliance pose significant barriers.
Compressor Market Growth Trends & Insights
The global compressor market experienced steady growth during the historical period (2019-2024), driven by increasing industrialization and infrastructure development across various regions. The market size is estimated to be xx Million units in 2025. The adoption rate of advanced compressor technologies, such as those incorporating digitalization and automation, is growing steadily. Technological disruptions, such as the increasing adoption of energy-efficient designs and smart controls, are reshaping the market landscape, leading to improved operational efficiency and reduced energy consumption. Shifts in consumer behavior toward sustainable and environmentally friendly solutions are also impacting market demand. The CAGR for the forecast period (2025-2033) is projected at xx%. Market penetration is expected to increase significantly, driven by growth in emerging economies and the increasing demand for compressed air and gas in diverse applications.
Dominant Regions, Countries, or Segments in Compressor Market
The Oil and Gas Industry remains the dominant end-user segment, representing xx% of the global market share in 2025, owing to high demand for gas compression in upstream, midstream, and downstream applications. North America and Europe are currently the leading regions, but the Asia-Pacific region shows significant growth potential, driven by rapid industrialization and infrastructure development. Within compressor types, Positive Displacement compressors hold the largest market share (xx%) due to their reliability and suitability for diverse applications.
- Key Drivers (Oil & Gas): Exploration and production activities, pipeline infrastructure development, and LNG processing.
- Key Drivers (Power Sector): Expansion of power generation capacity, particularly in renewable energy sources.
- Key Drivers (Manufacturing): Automation, increased production capacity, and rising demand for compressed air in various manufacturing processes.
- Key Drivers (Chemicals & Petrochemicals): Growth in chemical production, and increasing demand for specialized compressors in petrochemical plants.
- Regional Dominance: North America and Europe lead in terms of market size and technological advancement, but Asia-Pacific exhibits the fastest growth rate.
- Segment Dominance: Oil and Gas and Positive Displacement compressors are the leading segments.
Compressor Market Product Landscape
The compressor market offers a diverse range of products, including reciprocating, centrifugal, screw, and scroll compressors, each tailored to specific applications. Recent innovations focus on enhancing energy efficiency, reducing noise levels, and improving operational reliability. Key advancements include the integration of smart technologies, advanced materials, and improved control systems. Unique selling propositions often center on energy savings, reduced maintenance requirements, and increased lifespan.
Key Drivers, Barriers & Challenges in Compressor Market
Key Drivers:
- Increasing industrialization and infrastructure development globally.
- Growing demand for compressed air and gas across various sectors.
- Technological advancements leading to improved efficiency and performance.
- Favorable government policies supporting industrial growth.
Key Challenges:
- Fluctuations in raw material prices, impacting production costs.
- Stringent environmental regulations requiring compliance with emission standards.
- Intense competition among established players and new entrants.
- Supply chain disruptions impacting availability and delivery times. This resulted in a xx% increase in lead times during 2022.
Emerging Opportunities in Compressor Market
- Expanding applications in renewable energy sectors (e.g., biogas compression).
- Growth in the demand for energy-efficient and environmentally friendly compressors.
- Increasing adoption of smart compressors and digitalization technologies.
- Untapped potential in emerging economies with rapid industrialization.
Growth Accelerators in the Compressor Market Industry
Technological breakthroughs in compressor design and materials science are driving significant efficiency improvements. Strategic partnerships between compressor manufacturers and end-users are fostering innovation and accelerating market adoption. Market expansion strategies focused on emerging economies and new applications further propel market growth.
Key Players Shaping the Compressor Market Market
- Ingersoll Rand Inc
- Ebara Corporation
- Sulzer Ltd
- Bauer Compressors Inc
- Atlas Copco AB
- Baker Hughes Co
- Ariel Corporation
- Aerzener Maschinenfabrik GmbH
- Burckhardt Compression Holding AG
- Siemens Energy AG
Notable Milestones in Compressor Market Sector
- April 2024: The Srikail gas field in Cumilla, Bangladesh signed a contract for three wellhead compressors with a capacity of 10 million cubic feet per day. This signifies significant investment in the region’s gas infrastructure.
- March 2023: Sapphire Gas Solutions and Bauer Compressors Inc. formed a national partnership to install, service, and maintain Bauer compressors across the US, Canada, and Mexico. This expands Bauer's market reach and service capabilities.
In-Depth Compressor Market Market Outlook
The compressor market is poised for continued growth, driven by sustained demand across key end-user segments and ongoing technological innovation. Strategic partnerships, expansion into emerging markets, and the development of energy-efficient solutions present significant opportunities for market participants. The focus on sustainability and digitalization will further shape the market landscape in the coming years, creating a dynamic environment ripe for growth and innovation.
Compressor Market Segmentation
-
1. End-User
- 1.1. Oil and Gas Industry
- 1.2. Power Sector
- 1.3. Manufacturing Sector
- 1.4. Chemicals and Petrochemical Industry
- 1.5. Other End-Users
-
2. Type
- 2.1. Positive Displacement
- 2.2. Dynamic
Compressor Market Segmentation By Geography
-
1. North America
- 1.1. United States
- 1.2. Canada
- 1.3. Rest of North America
-
2. Europe
- 2.1. Germany
- 2.2. France
- 2.3. United Kingdom
- 2.4. Spain
- 2.5. Norway
- 2.6. Turkey
- 2.7. Russia
- 2.8. NORDIC
- 2.9. Rest of Europe
-
3. Asia Pacific
- 3.1. China
- 3.2. India
- 3.3. Malaysia
- 3.4. Thailand
- 3.5. Australia
- 3.6. Indonesia
- 3.7. Vietnam
- 4. Rest of Asia Pacific
-
5. South America
- 5.1. Brazil
- 5.2. Argentina
- 5.3. Colombia
- 5.4. Rest of South America
-
6. Middle East and Africa
- 6.1. Saudi Arabia
- 6.2. United Arab Emirates
- 6.3. South Africa
- 6.4. Nigeria
- 6.5. Qatar
- 7. Egypt
- 8. Rest of Middle East and Africa
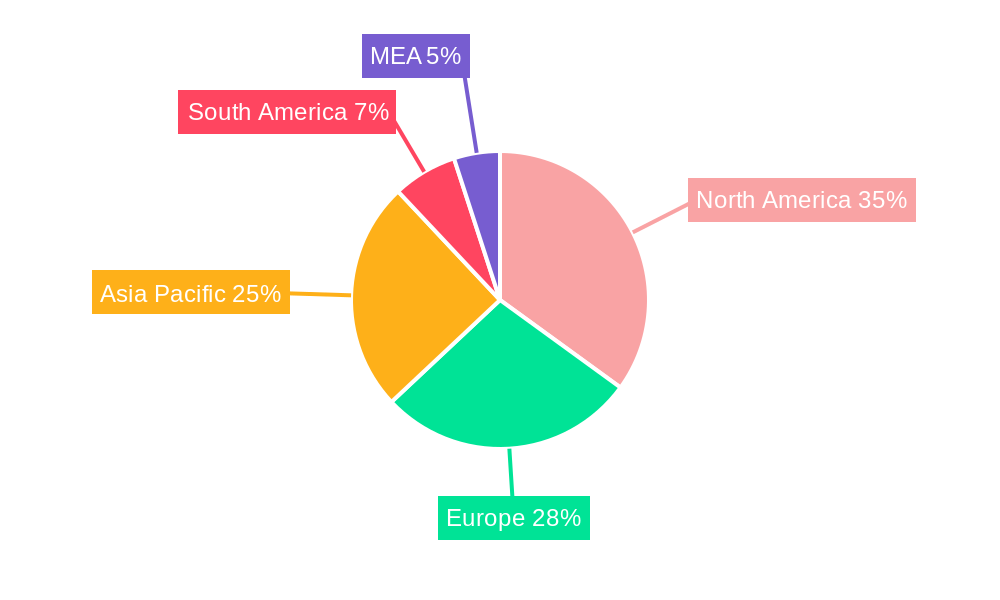
Compressor Market Regional Market Share
Geographic Coverage of Compressor Market
Compressor Market REPORT HIGHLIGHTS
| Aspects | Details |
|---|---|
| Study Period | 2020-2034 |
| Base Year | 2025 |
| Estimated Year | 2026 |
| Forecast Period | 2026-2034 |
| Historical Period | 2020-2025 |
| Growth Rate | CAGR of 4.81% from 2020-2034 |
| Segmentation |
|
Table of Contents
- 1. Introduction
- 1.1. Research Scope
- 1.2. Market Segmentation
- 1.3. Research Objective
- 1.4. Definitions and Assumptions
- 2. Executive Summary
- 2.1. Market Snapshot
- 3. Market Dynamics
- 3.1. Market Drivers
- 3.2. Market Restrains
- 3.3. Market Trends
- 3.4. Market Opportunities
- 4. Market Factor Analysis
- 4.1. Porters Five Forces
- 4.1.1. Bargaining Power of Suppliers
- 4.1.2. Bargaining Power of Buyers
- 4.1.3. Threat of New Entrants
- 4.1.4. Threat of Substitutes
- 4.1.5. Competitive Rivalry
- 4.2. PESTEL analysis
- 4.3. BCG Analysis
- 4.3.1. Stars (High Growth, High Market Share)
- 4.3.2. Cash Cows (Low Growth, High Market Share)
- 4.3.3. Question Mark (High Growth, Low Market Share)
- 4.3.4. Dogs (Low Growth, Low Market Share)
- 4.4. Ansoff Matrix Analysis
- 4.5. Supply Chain Analysis
- 4.6. Regulatory Landscape
- 4.7. Current Market Potential and Opportunity Assessment (TAM–SAM–SOM Framework)
- 4.8. NRP Analyst Note
- 4.1. Porters Five Forces
- 5. Market Analysis, Insights and Forecast 2021-2033
- 5.1. Market Analysis, Insights and Forecast - by End-User
- 5.1.1. Oil and Gas Industry
- 5.1.2. Power Sector
- 5.1.3. Manufacturing Sector
- 5.1.4. Chemicals and Petrochemical Industry
- 5.1.5. Other End-Users
- 5.2. Market Analysis, Insights and Forecast - by Type
- 5.2.1. Positive Displacement
- 5.2.2. Dynamic
- 5.3. Market Analysis, Insights and Forecast - by Region
- 5.3.1. North America
- 5.3.2. Europe
- 5.3.3. Asia Pacific
- 5.3.4. Rest of Asia Pacific
- 5.3.5. South America
- 5.3.6. Middle East and Africa
- 5.3.7. Egypt
- 5.3.8. Rest of Middle East and Africa
- 5.1. Market Analysis, Insights and Forecast - by End-User
- 6. Global Compressor Market Analysis, Insights and Forecast, 2021-2033
- 6.1. Market Analysis, Insights and Forecast - by End-User
- 6.1.1. Oil and Gas Industry
- 6.1.2. Power Sector
- 6.1.3. Manufacturing Sector
- 6.1.4. Chemicals and Petrochemical Industry
- 6.1.5. Other End-Users
- 6.2. Market Analysis, Insights and Forecast - by Type
- 6.2.1. Positive Displacement
- 6.2.2. Dynamic
- 6.1. Market Analysis, Insights and Forecast - by End-User
- 7. North America Compressor Market Analysis, Insights and Forecast, 2020-2032
- 7.1. Market Analysis, Insights and Forecast - by End-User
- 7.1.1. Oil and Gas Industry
- 7.1.2. Power Sector
- 7.1.3. Manufacturing Sector
- 7.1.4. Chemicals and Petrochemical Industry
- 7.1.5. Other End-Users
- 7.2. Market Analysis, Insights and Forecast - by Type
- 7.2.1. Positive Displacement
- 7.2.2. Dynamic
- 7.1. Market Analysis, Insights and Forecast - by End-User
- 8. Europe Compressor Market Analysis, Insights and Forecast, 2020-2032
- 8.1. Market Analysis, Insights and Forecast - by End-User
- 8.1.1. Oil and Gas Industry
- 8.1.2. Power Sector
- 8.1.3. Manufacturing Sector
- 8.1.4. Chemicals and Petrochemical Industry
- 8.1.5. Other End-Users
- 8.2. Market Analysis, Insights and Forecast - by Type
- 8.2.1. Positive Displacement
- 8.2.2. Dynamic
- 8.1. Market Analysis, Insights and Forecast - by End-User
- 9. Asia Pacific Compressor Market Analysis, Insights and Forecast, 2020-2032
- 9.1. Market Analysis, Insights and Forecast - by End-User
- 9.1.1. Oil and Gas Industry
- 9.1.2. Power Sector
- 9.1.3. Manufacturing Sector
- 9.1.4. Chemicals and Petrochemical Industry
- 9.1.5. Other End-Users
- 9.2. Market Analysis, Insights and Forecast - by Type
- 9.2.1. Positive Displacement
- 9.2.2. Dynamic
- 9.1. Market Analysis, Insights and Forecast - by End-User
- 10. Rest of Asia Pacific Compressor Market Analysis, Insights and Forecast, 2020-2032
- 10.1. Market Analysis, Insights and Forecast - by End-User
- 10.1.1. Oil and Gas Industry
- 10.1.2. Power Sector
- 10.1.3. Manufacturing Sector
- 10.1.4. Chemicals and Petrochemical Industry
- 10.1.5. Other End-Users
- 10.2. Market Analysis, Insights and Forecast - by Type
- 10.2.1. Positive Displacement
- 10.2.2. Dynamic
- 10.1. Market Analysis, Insights and Forecast - by End-User
- 11. South America Compressor Market Analysis, Insights and Forecast, 2020-2032
- 11.1. Market Analysis, Insights and Forecast - by End-User
- 11.1.1. Oil and Gas Industry
- 11.1.2. Power Sector
- 11.1.3. Manufacturing Sector
- 11.1.4. Chemicals and Petrochemical Industry
- 11.1.5. Other End-Users
- 11.2. Market Analysis, Insights and Forecast - by Type
- 11.2.1. Positive Displacement
- 11.2.2. Dynamic
- 11.1. Market Analysis, Insights and Forecast - by End-User
- 12. Middle East and Africa Compressor Market Analysis, Insights and Forecast, 2020-2032
- 12.1. Market Analysis, Insights and Forecast - by End-User
- 12.1.1. Oil and Gas Industry
- 12.1.2. Power Sector
- 12.1.3. Manufacturing Sector
- 12.1.4. Chemicals and Petrochemical Industry
- 12.1.5. Other End-Users
- 12.2. Market Analysis, Insights and Forecast - by Type
- 12.2.1. Positive Displacement
- 12.2.2. Dynamic
- 12.1. Market Analysis, Insights and Forecast - by End-User
- 13. Egypt Compressor Market Analysis, Insights and Forecast, 2020-2032
- 13.1. Market Analysis, Insights and Forecast - by End-User
- 13.1.1. Oil and Gas Industry
- 13.1.2. Power Sector
- 13.1.3. Manufacturing Sector
- 13.1.4. Chemicals and Petrochemical Industry
- 13.1.5. Other End-Users
- 13.2. Market Analysis, Insights and Forecast - by Type
- 13.2.1. Positive Displacement
- 13.2.2. Dynamic
- 13.1. Market Analysis, Insights and Forecast - by End-User
- 14. Rest of Middle East and Africa Compressor Market Analysis, Insights and Forecast, 2020-2032
- 14.1. Market Analysis, Insights and Forecast - by End-User
- 14.1.1. Oil and Gas Industry
- 14.1.2. Power Sector
- 14.1.3. Manufacturing Sector
- 14.1.4. Chemicals and Petrochemical Industry
- 14.1.5. Other End-Users
- 14.2. Market Analysis, Insights and Forecast - by Type
- 14.2.1. Positive Displacement
- 14.2.2. Dynamic
- 14.1. Market Analysis, Insights and Forecast - by End-User
- 15. Competitive Analysis
- 15.1. Company Profiles
- 15.1.1 Ingersoll Rand Inc
- 15.1.1.1. Company Overview
- 15.1.1.2. Products
- 15.1.1.3. Company Financials
- 15.1.1.4. SWOT Analysis
- 15.1.2 Ebara Corporation
- 15.1.2.1. Company Overview
- 15.1.2.2. Products
- 15.1.2.3. Company Financials
- 15.1.2.4. SWOT Analysis
- 15.1.3 Sulzer Ltd*List Not Exhaustive 6 4 Market Ranking/ Share Analysi
- 15.1.3.1. Company Overview
- 15.1.3.2. Products
- 15.1.3.3. Company Financials
- 15.1.3.4. SWOT Analysis
- 15.1.4 Bauer Compressors Inc
- 15.1.4.1. Company Overview
- 15.1.4.2. Products
- 15.1.4.3. Company Financials
- 15.1.4.4. SWOT Analysis
- 15.1.5 Atlas Copco AB
- 15.1.5.1. Company Overview
- 15.1.5.2. Products
- 15.1.5.3. Company Financials
- 15.1.5.4. SWOT Analysis
- 15.1.6 Baker Hughes Co
- 15.1.6.1. Company Overview
- 15.1.6.2. Products
- 15.1.6.3. Company Financials
- 15.1.6.4. SWOT Analysis
- 15.1.7 Ariel Corporation
- 15.1.7.1. Company Overview
- 15.1.7.2. Products
- 15.1.7.3. Company Financials
- 15.1.7.4. SWOT Analysis
- 15.1.8 Aerzener Maschinenfabrik GmbH
- 15.1.8.1. Company Overview
- 15.1.8.2. Products
- 15.1.8.3. Company Financials
- 15.1.8.4. SWOT Analysis
- 15.1.9 Burckhardt Compression Holding AG
- 15.1.9.1. Company Overview
- 15.1.9.2. Products
- 15.1.9.3. Company Financials
- 15.1.9.4. SWOT Analysis
- 15.1.10 Siemens Energy AG
- 15.1.10.1. Company Overview
- 15.1.10.2. Products
- 15.1.10.3. Company Financials
- 15.1.10.4. SWOT Analysis
- 15.1.1 Ingersoll Rand Inc
- 15.2. Market Entropy
- 15.2.1 Company's Key Areas Served
- 15.2.2 Recent Developments
- 15.3. Company Market Share Analysis 2025
- 15.3.1 Top 5 Companies Market Share Analysis
- 15.3.2 Top 3 Companies Market Share Analysis
- 15.4. List of Potential Customers
- 16. Research Methodology
List of Figures
- Figure 1: Global Compressor Market Revenue Breakdown (Million, %) by Region 2025 & 2033
- Figure 2: North America Compressor Market Revenue (Million), by End-User 2025 & 2033
- Figure 3: North America Compressor Market Revenue Share (%), by End-User 2025 & 2033
- Figure 4: North America Compressor Market Revenue (Million), by Type 2025 & 2033
- Figure 5: North America Compressor Market Revenue Share (%), by Type 2025 & 2033
- Figure 6: North America Compressor Market Revenue (Million), by Country 2025 & 2033
- Figure 7: North America Compressor Market Revenue Share (%), by Country 2025 & 2033
- Figure 8: Europe Compressor Market Revenue (Million), by End-User 2025 & 2033
- Figure 9: Europe Compressor Market Revenue Share (%), by End-User 2025 & 2033
- Figure 10: Europe Compressor Market Revenue (Million), by Type 2025 & 2033
- Figure 11: Europe Compressor Market Revenue Share (%), by Type 2025 & 2033
- Figure 12: Europe Compressor Market Revenue (Million), by Country 2025 & 2033
- Figure 13: Europe Compressor Market Revenue Share (%), by Country 2025 & 2033
- Figure 14: Asia Pacific Compressor Market Revenue (Million), by End-User 2025 & 2033
- Figure 15: Asia Pacific Compressor Market Revenue Share (%), by End-User 2025 & 2033
- Figure 16: Asia Pacific Compressor Market Revenue (Million), by Type 2025 & 2033
- Figure 17: Asia Pacific Compressor Market Revenue Share (%), by Type 2025 & 2033
- Figure 18: Asia Pacific Compressor Market Revenue (Million), by Country 2025 & 2033
- Figure 19: Asia Pacific Compressor Market Revenue Share (%), by Country 2025 & 2033
- Figure 20: Rest of Asia Pacific Compressor Market Revenue (Million), by End-User 2025 & 2033
- Figure 21: Rest of Asia Pacific Compressor Market Revenue Share (%), by End-User 2025 & 2033
- Figure 22: Rest of Asia Pacific Compressor Market Revenue (Million), by Type 2025 & 2033
- Figure 23: Rest of Asia Pacific Compressor Market Revenue Share (%), by Type 2025 & 2033
- Figure 24: Rest of Asia Pacific Compressor Market Revenue (Million), by Country 2025 & 2033
- Figure 25: Rest of Asia Pacific Compressor Market Revenue Share (%), by Country 2025 & 2033
- Figure 26: South America Compressor Market Revenue (Million), by End-User 2025 & 2033
- Figure 27: South America Compressor Market Revenue Share (%), by End-User 2025 & 2033
- Figure 28: South America Compressor Market Revenue (Million), by Type 2025 & 2033
- Figure 29: South America Compressor Market Revenue Share (%), by Type 2025 & 2033
- Figure 30: South America Compressor Market Revenue (Million), by Country 2025 & 2033
- Figure 31: South America Compressor Market Revenue Share (%), by Country 2025 & 2033
- Figure 32: Middle East and Africa Compressor Market Revenue (Million), by End-User 2025 & 2033
- Figure 33: Middle East and Africa Compressor Market Revenue Share (%), by End-User 2025 & 2033
- Figure 34: Middle East and Africa Compressor Market Revenue (Million), by Type 2025 & 2033
- Figure 35: Middle East and Africa Compressor Market Revenue Share (%), by Type 2025 & 2033
- Figure 36: Middle East and Africa Compressor Market Revenue (Million), by Country 2025 & 2033
- Figure 37: Middle East and Africa Compressor Market Revenue Share (%), by Country 2025 & 2033
- Figure 38: Egypt Compressor Market Revenue (Million), by End-User 2025 & 2033
- Figure 39: Egypt Compressor Market Revenue Share (%), by End-User 2025 & 2033
- Figure 40: Egypt Compressor Market Revenue (Million), by Type 2025 & 2033
- Figure 41: Egypt Compressor Market Revenue Share (%), by Type 2025 & 2033
- Figure 42: Egypt Compressor Market Revenue (Million), by Country 2025 & 2033
- Figure 43: Egypt Compressor Market Revenue Share (%), by Country 2025 & 2033
- Figure 44: Rest of Middle East and Africa Compressor Market Revenue (Million), by End-User 2025 & 2033
- Figure 45: Rest of Middle East and Africa Compressor Market Revenue Share (%), by End-User 2025 & 2033
- Figure 46: Rest of Middle East and Africa Compressor Market Revenue (Million), by Type 2025 & 2033
- Figure 47: Rest of Middle East and Africa Compressor Market Revenue Share (%), by Type 2025 & 2033
- Figure 48: Rest of Middle East and Africa Compressor Market Revenue (Million), by Country 2025 & 2033
- Figure 49: Rest of Middle East and Africa Compressor Market Revenue Share (%), by Country 2025 & 2033
List of Tables
- Table 1: Global Compressor Market Revenue Million Forecast, by End-User 2020 & 2033
- Table 2: Global Compressor Market Revenue Million Forecast, by Type 2020 & 2033
- Table 3: Global Compressor Market Revenue Million Forecast, by Region 2020 & 2033
- Table 4: Global Compressor Market Revenue Million Forecast, by End-User 2020 & 2033
- Table 5: Global Compressor Market Revenue Million Forecast, by Type 2020 & 2033
- Table 6: Global Compressor Market Revenue Million Forecast, by Country 2020 & 2033
- Table 7: United States Compressor Market Revenue (Million) Forecast, by Application 2020 & 2033
- Table 8: Canada Compressor Market Revenue (Million) Forecast, by Application 2020 & 2033
- Table 9: Rest of North America Compressor Market Revenue (Million) Forecast, by Application 2020 & 2033
- Table 10: Global Compressor Market Revenue Million Forecast, by End-User 2020 & 2033
- Table 11: Global Compressor Market Revenue Million Forecast, by Type 2020 & 2033
- Table 12: Global Compressor Market Revenue Million Forecast, by Country 2020 & 2033
- Table 13: Germany Compressor Market Revenue (Million) Forecast, by Application 2020 & 2033
- Table 14: France Compressor Market Revenue (Million) Forecast, by Application 2020 & 2033
- Table 15: United Kingdom Compressor Market Revenue (Million) Forecast, by Application 2020 & 2033
- Table 16: Spain Compressor Market Revenue (Million) Forecast, by Application 2020 & 2033
- Table 17: Norway Compressor Market Revenue (Million) Forecast, by Application 2020 & 2033
- Table 18: Turkey Compressor Market Revenue (Million) Forecast, by Application 2020 & 2033
- Table 19: Russia Compressor Market Revenue (Million) Forecast, by Application 2020 & 2033
- Table 20: NORDIC Compressor Market Revenue (Million) Forecast, by Application 2020 & 2033
- Table 21: Rest of Europe Compressor Market Revenue (Million) Forecast, by Application 2020 & 2033
- Table 22: Global Compressor Market Revenue Million Forecast, by End-User 2020 & 2033
- Table 23: Global Compressor Market Revenue Million Forecast, by Type 2020 & 2033
- Table 24: Global Compressor Market Revenue Million Forecast, by Country 2020 & 2033
- Table 25: China Compressor Market Revenue (Million) Forecast, by Application 2020 & 2033
- Table 26: India Compressor Market Revenue (Million) Forecast, by Application 2020 & 2033
- Table 27: Malaysia Compressor Market Revenue (Million) Forecast, by Application 2020 & 2033
- Table 28: Thailand Compressor Market Revenue (Million) Forecast, by Application 2020 & 2033
- Table 29: Australia Compressor Market Revenue (Million) Forecast, by Application 2020 & 2033
- Table 30: Indonesia Compressor Market Revenue (Million) Forecast, by Application 2020 & 2033
- Table 31: Vietnam Compressor Market Revenue (Million) Forecast, by Application 2020 & 2033
- Table 32: Global Compressor Market Revenue Million Forecast, by End-User 2020 & 2033
- Table 33: Global Compressor Market Revenue Million Forecast, by Type 2020 & 2033
- Table 34: Global Compressor Market Revenue Million Forecast, by Country 2020 & 2033
- Table 35: Global Compressor Market Revenue Million Forecast, by End-User 2020 & 2033
- Table 36: Global Compressor Market Revenue Million Forecast, by Type 2020 & 2033
- Table 37: Global Compressor Market Revenue Million Forecast, by Country 2020 & 2033
- Table 38: Brazil Compressor Market Revenue (Million) Forecast, by Application 2020 & 2033
- Table 39: Argentina Compressor Market Revenue (Million) Forecast, by Application 2020 & 2033
- Table 40: Colombia Compressor Market Revenue (Million) Forecast, by Application 2020 & 2033
- Table 41: Rest of South America Compressor Market Revenue (Million) Forecast, by Application 2020 & 2033
- Table 42: Global Compressor Market Revenue Million Forecast, by End-User 2020 & 2033
- Table 43: Global Compressor Market Revenue Million Forecast, by Type 2020 & 2033
- Table 44: Global Compressor Market Revenue Million Forecast, by Country 2020 & 2033
- Table 45: Saudi Arabia Compressor Market Revenue (Million) Forecast, by Application 2020 & 2033
- Table 46: United Arab Emirates Compressor Market Revenue (Million) Forecast, by Application 2020 & 2033
- Table 47: South Africa Compressor Market Revenue (Million) Forecast, by Application 2020 & 2033
- Table 48: Nigeria Compressor Market Revenue (Million) Forecast, by Application 2020 & 2033
- Table 49: Qatar Compressor Market Revenue (Million) Forecast, by Application 2020 & 2033
- Table 50: Global Compressor Market Revenue Million Forecast, by End-User 2020 & 2033
- Table 51: Global Compressor Market Revenue Million Forecast, by Type 2020 & 2033
- Table 52: Global Compressor Market Revenue Million Forecast, by Country 2020 & 2033
- Table 53: Global Compressor Market Revenue Million Forecast, by End-User 2020 & 2033
- Table 54: Global Compressor Market Revenue Million Forecast, by Type 2020 & 2033
- Table 55: Global Compressor Market Revenue Million Forecast, by Country 2020 & 2033
Frequently Asked Questions
1. What is the projected Compound Annual Growth Rate (CAGR) of the Compressor Market?
The projected CAGR is approximately 4.81%.
2. Which companies are prominent players in the Compressor Market?
Key companies in the market include Ingersoll Rand Inc, Ebara Corporation, Sulzer Ltd*List Not Exhaustive 6 4 Market Ranking/ Share Analysi, Bauer Compressors Inc, Atlas Copco AB, Baker Hughes Co, Ariel Corporation, Aerzener Maschinenfabrik GmbH, Burckhardt Compression Holding AG, Siemens Energy AG.
3. What are the main segments of the Compressor Market?
The market segments include End-User, Type.
4. Can you provide details about the market size?
The market size is estimated to be USD 42.04 Million as of 2022.
5. What are some drivers contributing to market growth?
4.; The Growing Demand for Natural Gas4.; Rising Pipeline Infrastructure across Globe.
6. What are the notable trends driving market growth?
Oil and Gas Segment Expected to Dominate the Market.
7. Are there any restraints impacting market growth?
4.; Increasing Adoption of Solar and Wind Energies.
8. Can you provide examples of recent developments in the market?
April 2024: The Srikail gas field in Cumilla signed a contract to receive three wellhead compressors with a capacity of 10 million cubic feet per day, along with related infrastructure, owing to a deal inked by Bangladesh Petroleum Exploration and Production Company Ltd and SC Euro Gas Systems SRL, Romania.
9. What pricing options are available for accessing the report?
Pricing options include single-user, multi-user, and enterprise licenses priced at USD 4750, USD 5250, and USD 8750 respectively.
10. Is the market size provided in terms of value or volume?
The market size is provided in terms of value, measured in Million.
11. Are there any specific market keywords associated with the report?
Yes, the market keyword associated with the report is "Compressor Market," which aids in identifying and referencing the specific market segment covered.
12. How do I determine which pricing option suits my needs best?
The pricing options vary based on user requirements and access needs. Individual users may opt for single-user licenses, while businesses requiring broader access may choose multi-user or enterprise licenses for cost-effective access to the report.
13. Are there any additional resources or data provided in the Compressor Market report?
While the report offers comprehensive insights, it's advisable to review the specific contents or supplementary materials provided to ascertain if additional resources or data are available.
14. How can I stay updated on further developments or reports in the Compressor Market?
To stay informed about further developments, trends, and reports in the Compressor Market, consider subscribing to industry newsletters, following relevant companies and organizations, or regularly checking reputable industry news sources and publications.
Methodology
Step 1 - Identification of Relevant Samples Size from Population Database


Step 2 - Approaches for Defining Global Market Size (Value, Volume* & Price*)

Note*: In applicable scenarios
Step 3 - Data Sources
Primary Research
- Web Analytics
- Survey Reports
- Research Institute
- Latest Research Reports
- Opinion Leaders
Secondary Research
- Annual Reports
- White Paper
- Latest Press Release
- Industry Association
- Paid Database
- Investor Presentations

Step 4 - Data Triangulation
Involves using different sources of information in order to increase the validity of a study
These sources are likely to be stakeholders in a program - participants, other researchers, program staff, other community members, and so on.
Then we put all data in single framework & apply various statistical tools to find out the dynamic on the market.
During the analysis stage, feedback from the stakeholder groups would be compared to determine areas of agreement as well as areas of divergence