

Key Insights
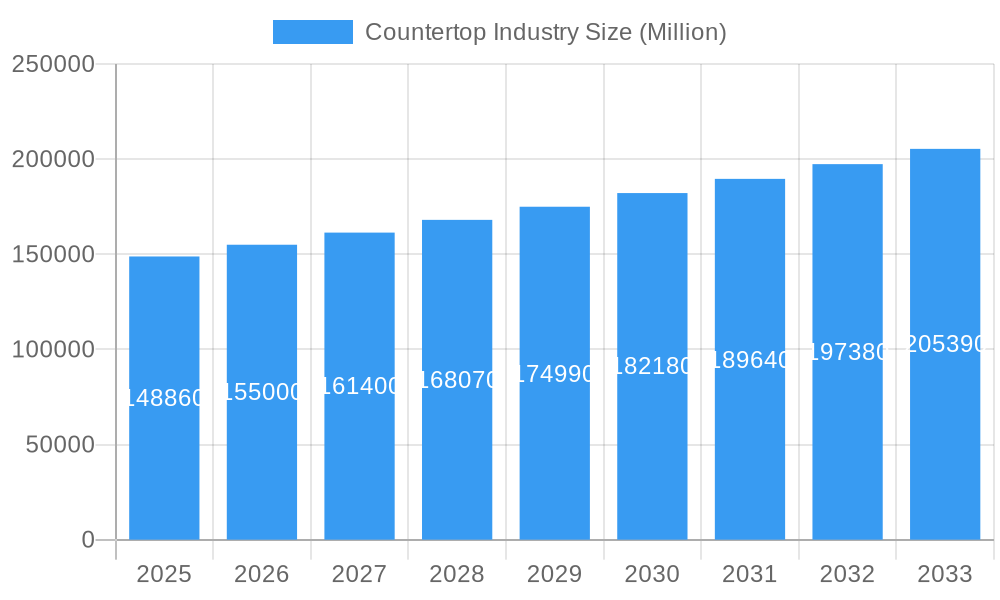
The global countertop market, valued at $148.86 billion in 2025, is projected to experience robust growth, driven by a compound annual growth rate (CAGR) of 4.22% from 2025 to 2033. This expansion is fueled by several key factors. The burgeoning construction industry, particularly in residential and commercial sectors, significantly boosts demand for countertops. A rising preference for aesthetically pleasing and durable materials like quartz and solid surfaces, coupled with increasing disposable incomes in developing economies, further propels market growth. Technological advancements leading to innovative countertop designs and improved manufacturing processes also contribute to this expansion. The kitchen and bathroom renovation market, a significant end-user segment, demonstrates consistent growth, driving demand for high-quality countertops. While material costs and supply chain disruptions may pose challenges, the overall market outlook remains positive, with significant opportunities for growth in regions like Asia-Pacific, driven by rapid urbanization and infrastructure development.
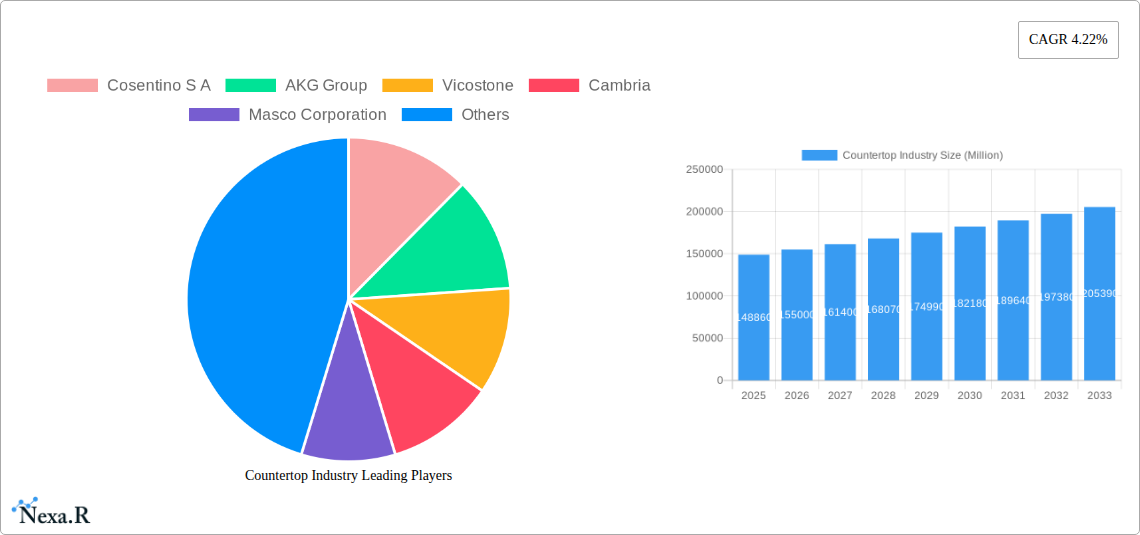
Countertop Industry Market Size (In Billion)
The market segmentation reveals significant insights into consumer preferences and market dynamics. Quartz surfaces, known for their durability and aesthetic appeal, are predicted to maintain a leading market share. The residential sector currently dominates, yet the commercial segment shows promising growth potential due to increased investment in hospitality, retail, and office spaces. Geographically, North America and Europe currently hold substantial market shares, though the Asia-Pacific region is poised for rapid expansion due to its burgeoning middle class and increasing construction activity. Key players like Cosentino, Cambria, and Caesarstone are actively shaping the market through innovation, strategic partnerships, and expansion into new markets. Competition is fierce, necessitating continuous innovation and a strong focus on customer needs to capture market share. The forecast period (2025-2033) anticipates sustained growth, largely attributed to ongoing urbanization, improved living standards, and a consistent demand for aesthetically appealing and functional kitchen and bathroom spaces.
Countertop Industry Company Market Share
Countertop Industry Market Report: 2019-2033
This comprehensive report provides a detailed analysis of the countertop industry, encompassing market dynamics, growth trends, key players, and future projections. The report covers the period from 2019 to 2033, with a focus on the 2025 market. It segments the market by material (Granite, Solid Surface, Laminate, Marble, Quartz Surfaces, Other Materials), end-user (Residential, Commercial), and type (Kitchen, Bathroom, Other Types). This in-depth analysis is crucial for industry professionals, investors, and anyone seeking a thorough understanding of this dynamic market valued at xx Million units in 2025.
Countertop Industry Market Dynamics & Structure
The countertop industry is characterized by moderate market concentration, with several key players holding significant shares. Technological innovation, particularly in materials science and manufacturing processes, is a primary driver of growth. Regulatory frameworks concerning material safety and environmental impact influence product development and market access. Competitive substitutes, such as alternative surfacing materials, pose challenges. End-user demographics, notably the increasing demand for kitchen and bathroom renovations, fuel market expansion. M&A activity has been relatively low in recent years, with xx deals recorded between 2019 and 2024, representing a xx% decrease compared to the previous period.
- Market Concentration: Moderately concentrated, with top 5 players holding approximately xx% market share in 2025.
- Technological Innovation: Focus on sustainable materials, improved durability, and aesthetically pleasing designs.
- Regulatory Framework: Stringent regulations regarding material safety and environmental standards.
- Competitive Substitutes: Alternative materials like ceramic, wood, and metal compete with traditional countertops.
- End-User Demographics: Growing demand driven by rising disposable incomes and home renovation trends.
- M&A Activity: xx deals between 2019-2024; xx% decrease compared to the preceding period.
Countertop Industry Growth Trends & Insights
The countertop industry has witnessed consistent growth over the past five years, expanding at a Compound Annual Growth Rate (CAGR) of xx% during the historical period (2019-2024). This growth is projected to continue during the forecast period (2025-2033), with a CAGR of xx%. Market penetration has increased steadily, reaching xx% in 2025 across major regions. Technological disruptions, such as the introduction of innovative materials and manufacturing techniques, have accelerated adoption rates and diversified consumer choices. Consumer preferences have evolved towards more sustainable and aesthetically versatile options, leading to increased demand for specific materials like quartz surfaces. The market size is estimated to reach xx Million units in 2025 and is projected to exceed xx Million units by 2033.
Dominant Regions, Countries, or Segments in Countertop Industry
North America and Europe currently dominate the global countertop market, accounting for approximately xx% of the total market value in 2025. Within materials, quartz surfaces exhibit the highest growth potential, driven by its durability and aesthetic appeal. The residential end-user segment remains the largest contributor to market revenue, followed by the commercial sector. Kitchen countertops continue to dominate the type segment.
- Key Drivers:
- Strong economic growth in developed nations fueling renovation activities.
- Rising disposable incomes and increased spending on home improvement projects.
- Growing adoption of quartz surfaces due to durability and aesthetic appeal.
- Dominance Factors:
- High construction activity in North America and Europe.
- Established distribution networks and strong brand presence in developed markets.
- Consumer preference for premium and durable countertop materials.
Countertop Industry Product Landscape
The countertop industry offers a wide range of products, including granite, marble, quartz, solid surface, and laminate countertops. Recent innovations have focused on enhancing material durability, scratch resistance, and stain resistance. Smart countertops with integrated technology, such as wireless charging, are emerging, offering unique selling propositions. Technological advancements have led to the development of thinner, lighter, and more sustainable materials, responding to environmental concerns and consumer demands.
Key Drivers, Barriers & Challenges in Countertop Industry
Key Drivers:
- Growing demand for home renovations and new constructions.
- Rising disposable incomes in developing economies.
- Technological advancements leading to improved product features.
Challenges and Restraints:
- Fluctuations in raw material prices. (e.g., xx% increase in granite prices in 2022 impacted production costs)
- Supply chain disruptions causing delays and increased costs.
- Intense competition among manufacturers leading to price wars.
Emerging Opportunities in Countertop Industry
- Growing demand for sustainable and eco-friendly countertop materials.
- Increasing popularity of smart home technology integrated into countertops.
- Expansion into untapped markets in developing economies.
Growth Accelerators in the Countertop Industry Industry
Technological breakthroughs in material science, strategic partnerships for distribution expansion, and targeted marketing campaigns focusing on specific consumer segments will drive long-term growth. Sustainable material development and eco-friendly production processes will further enhance the market's appeal.
Key Players Shaping the Countertop Industry Market
- Cosentino S A
- AKG Group
- Vicostone
- Cambria
- Masco Corporation
- ROSSKOPF + PARTNER AG
- DuPont de Nemours Inc
- ARISTECH SURFACES LLC
- STRASSER Steine GmbH
- Caesarstone Ltd
- Daltile
- Wilsonart LLC
- Asian Granito India Limited
- Pokarna Ltd
- Aro Granite Industries Ltd
Notable Milestones in Countertop Industry Sector
- August 2022: Wilsonart LLC wins KBB magazine's Readers' Choice Award for top kitchen countertop brand (2nd consecutive year).
- February 2022: Caesarstone Ltd. unveils eight new nature-inspired surfaces at KBIS.
- January 2022: Cambria introduces four new colors to its quartz countertop selection.
In-Depth Countertop Industry Market Outlook
The countertop industry is poised for sustained growth driven by continuous innovation, expanding consumer demand, and strategic market expansion. Opportunities exist in developing economies, sustainable product development, and integration of smart technology. The focus on superior aesthetics, durability, and functionality will continue to drive market expansion and shape future industry trends.
Countertop Industry Segmentation
-
1. Material
- 1.1. Granite
- 1.2. Solid Surface
- 1.3. Laminate
- 1.4. Marble
- 1.5. Quartz Surfaces
- 1.6. Other Materials
-
2. End User
- 2.1. Residential
- 2.2. Commercial
-
3. Type
- 3.1. Kitchen
- 3.2. Bathroom
- 3.3. Other Types
Countertop Industry Segmentation By Geography
- 1. North America
- 2. Europe
- 3. Asia Pacific
- 4. Latin America
- 5. Middle East and Africa
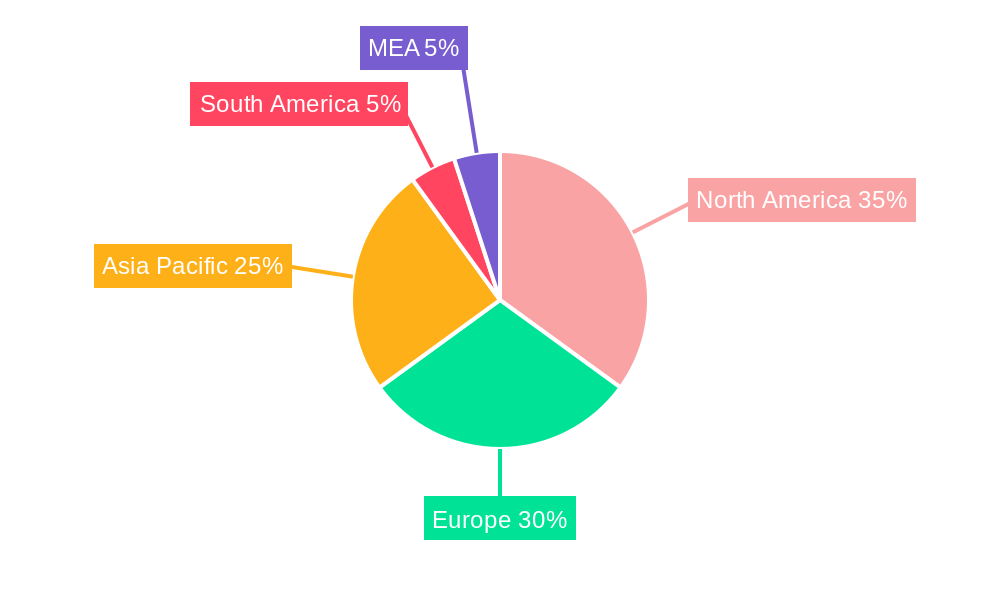
Countertop Industry Regional Market Share
Geographic Coverage of Countertop Industry
Countertop Industry REPORT HIGHLIGHTS
| Aspects | Details |
|---|---|
| Study Period | 2020-2034 |
| Base Year | 2025 |
| Estimated Year | 2026 |
| Forecast Period | 2026-2034 |
| Historical Period | 2020-2025 |
| Growth Rate | CAGR of 4.22% from 2020-2034 |
| Segmentation |
|
Table of Contents
- 1. Introduction
- 1.1. Research Scope
- 1.2. Market Segmentation
- 1.3. Research Objective
- 1.4. Definitions and Assumptions
- 2. Executive Summary
- 2.1. Market Snapshot
- 3. Market Dynamics
- 3.1. Market Drivers
- 3.2. Market Restrains
- 3.3. Market Trends
- 3.4. Market Opportunities
- 4. Market Factor Analysis
- 4.1. Porters Five Forces
- 4.1.1. Bargaining Power of Suppliers
- 4.1.2. Bargaining Power of Buyers
- 4.1.3. Threat of New Entrants
- 4.1.4. Threat of Substitutes
- 4.1.5. Competitive Rivalry
- 4.2. PESTEL analysis
- 4.3. BCG Analysis
- 4.3.1. Stars (High Growth, High Market Share)
- 4.3.2. Cash Cows (Low Growth, High Market Share)
- 4.3.3. Question Mark (High Growth, Low Market Share)
- 4.3.4. Dogs (Low Growth, Low Market Share)
- 4.4. Ansoff Matrix Analysis
- 4.5. Supply Chain Analysis
- 4.6. Regulatory Landscape
- 4.7. Current Market Potential and Opportunity Assessment (TAM–SAM–SOM Framework)
- 4.8. NRP Analyst Note
- 4.1. Porters Five Forces
- 5. Market Analysis, Insights and Forecast 2021-2033
- 5.1. Market Analysis, Insights and Forecast - by Material
- 5.1.1. Granite
- 5.1.2. Solid Surface
- 5.1.3. Laminate
- 5.1.4. Marble
- 5.1.5. Quartz Surfaces
- 5.1.6. Other Materials
- 5.2. Market Analysis, Insights and Forecast - by End User
- 5.2.1. Residential
- 5.2.2. Commercial
- 5.3. Market Analysis, Insights and Forecast - by Type
- 5.3.1. Kitchen
- 5.3.2. Bathroom
- 5.3.3. Other Types
- 5.4. Market Analysis, Insights and Forecast - by Region
- 5.4.1. North America
- 5.4.2. Europe
- 5.4.3. Asia Pacific
- 5.4.4. Latin America
- 5.4.5. Middle East and Africa
- 5.1. Market Analysis, Insights and Forecast - by Material
- 6. Global Countertop Industry Analysis, Insights and Forecast, 2021-2033
- 6.1. Market Analysis, Insights and Forecast - by Material
- 6.1.1. Granite
- 6.1.2. Solid Surface
- 6.1.3. Laminate
- 6.1.4. Marble
- 6.1.5. Quartz Surfaces
- 6.1.6. Other Materials
- 6.2. Market Analysis, Insights and Forecast - by End User
- 6.2.1. Residential
- 6.2.2. Commercial
- 6.3. Market Analysis, Insights and Forecast - by Type
- 6.3.1. Kitchen
- 6.3.2. Bathroom
- 6.3.3. Other Types
- 6.1. Market Analysis, Insights and Forecast - by Material
- 7. North America Countertop Industry Analysis, Insights and Forecast, 2020-2032
- 7.1. Market Analysis, Insights and Forecast - by Material
- 7.1.1. Granite
- 7.1.2. Solid Surface
- 7.1.3. Laminate
- 7.1.4. Marble
- 7.1.5. Quartz Surfaces
- 7.1.6. Other Materials
- 7.2. Market Analysis, Insights and Forecast - by End User
- 7.2.1. Residential
- 7.2.2. Commercial
- 7.3. Market Analysis, Insights and Forecast - by Type
- 7.3.1. Kitchen
- 7.3.2. Bathroom
- 7.3.3. Other Types
- 7.1. Market Analysis, Insights and Forecast - by Material
- 8. Europe Countertop Industry Analysis, Insights and Forecast, 2020-2032
- 8.1. Market Analysis, Insights and Forecast - by Material
- 8.1.1. Granite
- 8.1.2. Solid Surface
- 8.1.3. Laminate
- 8.1.4. Marble
- 8.1.5. Quartz Surfaces
- 8.1.6. Other Materials
- 8.2. Market Analysis, Insights and Forecast - by End User
- 8.2.1. Residential
- 8.2.2. Commercial
- 8.3. Market Analysis, Insights and Forecast - by Type
- 8.3.1. Kitchen
- 8.3.2. Bathroom
- 8.3.3. Other Types
- 8.1. Market Analysis, Insights and Forecast - by Material
- 9. Asia Pacific Countertop Industry Analysis, Insights and Forecast, 2020-2032
- 9.1. Market Analysis, Insights and Forecast - by Material
- 9.1.1. Granite
- 9.1.2. Solid Surface
- 9.1.3. Laminate
- 9.1.4. Marble
- 9.1.5. Quartz Surfaces
- 9.1.6. Other Materials
- 9.2. Market Analysis, Insights and Forecast - by End User
- 9.2.1. Residential
- 9.2.2. Commercial
- 9.3. Market Analysis, Insights and Forecast - by Type
- 9.3.1. Kitchen
- 9.3.2. Bathroom
- 9.3.3. Other Types
- 9.1. Market Analysis, Insights and Forecast - by Material
- 10. Latin America Countertop Industry Analysis, Insights and Forecast, 2020-2032
- 10.1. Market Analysis, Insights and Forecast - by Material
- 10.1.1. Granite
- 10.1.2. Solid Surface
- 10.1.3. Laminate
- 10.1.4. Marble
- 10.1.5. Quartz Surfaces
- 10.1.6. Other Materials
- 10.2. Market Analysis, Insights and Forecast - by End User
- 10.2.1. Residential
- 10.2.2. Commercial
- 10.3. Market Analysis, Insights and Forecast - by Type
- 10.3.1. Kitchen
- 10.3.2. Bathroom
- 10.3.3. Other Types
- 10.1. Market Analysis, Insights and Forecast - by Material
- 11. Middle East and Africa Countertop Industry Analysis, Insights and Forecast, 2020-2032
- 11.1. Market Analysis, Insights and Forecast - by Material
- 11.1.1. Granite
- 11.1.2. Solid Surface
- 11.1.3. Laminate
- 11.1.4. Marble
- 11.1.5. Quartz Surfaces
- 11.1.6. Other Materials
- 11.2. Market Analysis, Insights and Forecast - by End User
- 11.2.1. Residential
- 11.2.2. Commercial
- 11.3. Market Analysis, Insights and Forecast - by Type
- 11.3.1. Kitchen
- 11.3.2. Bathroom
- 11.3.3. Other Types
- 11.1. Market Analysis, Insights and Forecast - by Material
- 12. Competitive Analysis
- 12.1. Company Profiles
- 12.1.1 Cosentino S A
- 12.1.1.1. Company Overview
- 12.1.1.2. Products
- 12.1.1.3. Company Financials
- 12.1.1.4. SWOT Analysis
- 12.1.2 AKG Group
- 12.1.2.1. Company Overview
- 12.1.2.2. Products
- 12.1.2.3. Company Financials
- 12.1.2.4. SWOT Analysis
- 12.1.3 Vicostone
- 12.1.3.1. Company Overview
- 12.1.3.2. Products
- 12.1.3.3. Company Financials
- 12.1.3.4. SWOT Analysis
- 12.1.4 Cambria
- 12.1.4.1. Company Overview
- 12.1.4.2. Products
- 12.1.4.3. Company Financials
- 12.1.4.4. SWOT Analysis
- 12.1.5 Masco Corporation
- 12.1.5.1. Company Overview
- 12.1.5.2. Products
- 12.1.5.3. Company Financials
- 12.1.5.4. SWOT Analysis
- 12.1.6 ROSSKOPF + PARTNER AG
- 12.1.6.1. Company Overview
- 12.1.6.2. Products
- 12.1.6.3. Company Financials
- 12.1.6.4. SWOT Analysis
- 12.1.7 DuPont de Nemours Inc
- 12.1.7.1. Company Overview
- 12.1.7.2. Products
- 12.1.7.3. Company Financials
- 12.1.7.4. SWOT Analysis
- 12.1.8 ARISTECH SURFACES LLC
- 12.1.8.1. Company Overview
- 12.1.8.2. Products
- 12.1.8.3. Company Financials
- 12.1.8.4. SWOT Analysis
- 12.1.9 STRASSER Steine GmbH
- 12.1.9.1. Company Overview
- 12.1.9.2. Products
- 12.1.9.3. Company Financials
- 12.1.9.4. SWOT Analysis
- 12.1.10 Caesarstone Ltd
- 12.1.10.1. Company Overview
- 12.1.10.2. Products
- 12.1.10.3. Company Financials
- 12.1.10.4. SWOT Analysis
- 12.1.11 Daltile
- 12.1.11.1. Company Overview
- 12.1.11.2. Products
- 12.1.11.3. Company Financials
- 12.1.11.4. SWOT Analysis
- 12.1.12 Wilsonart LLC
- 12.1.12.1. Company Overview
- 12.1.12.2. Products
- 12.1.12.3. Company Financials
- 12.1.12.4. SWOT Analysis
- 12.1.13 Asian Granito India Limited
- 12.1.13.1. Company Overview
- 12.1.13.2. Products
- 12.1.13.3. Company Financials
- 12.1.13.4. SWOT Analysis
- 12.1.14 Pokarna Ltd
- 12.1.14.1. Company Overview
- 12.1.14.2. Products
- 12.1.14.3. Company Financials
- 12.1.14.4. SWOT Analysis
- 12.1.15 Aro Granite Industries Ltd
- 12.1.15.1. Company Overview
- 12.1.15.2. Products
- 12.1.15.3. Company Financials
- 12.1.15.4. SWOT Analysis
- 12.1.1 Cosentino S A
- 12.2. Market Entropy
- 12.2.1 Company's Key Areas Served
- 12.2.2 Recent Developments
- 12.3. Company Market Share Analysis 2025
- 12.3.1 Top 5 Companies Market Share Analysis
- 12.3.2 Top 3 Companies Market Share Analysis
- 12.4. List of Potential Customers
- 13. Research Methodology
List of Figures
- Figure 1: Global Countertop Industry Revenue Breakdown (Million, %) by Region 2025 & 2033
- Figure 2: Global Countertop Industry Volume Breakdown (K Unit, %) by Region 2025 & 2033
- Figure 3: North America Countertop Industry Revenue (Million), by Material 2025 & 2033
- Figure 4: North America Countertop Industry Volume (K Unit), by Material 2025 & 2033
- Figure 5: North America Countertop Industry Revenue Share (%), by Material 2025 & 2033
- Figure 6: North America Countertop Industry Volume Share (%), by Material 2025 & 2033
- Figure 7: North America Countertop Industry Revenue (Million), by End User 2025 & 2033
- Figure 8: North America Countertop Industry Volume (K Unit), by End User 2025 & 2033
- Figure 9: North America Countertop Industry Revenue Share (%), by End User 2025 & 2033
- Figure 10: North America Countertop Industry Volume Share (%), by End User 2025 & 2033
- Figure 11: North America Countertop Industry Revenue (Million), by Type 2025 & 2033
- Figure 12: North America Countertop Industry Volume (K Unit), by Type 2025 & 2033
- Figure 13: North America Countertop Industry Revenue Share (%), by Type 2025 & 2033
- Figure 14: North America Countertop Industry Volume Share (%), by Type 2025 & 2033
- Figure 15: North America Countertop Industry Revenue (Million), by Country 2025 & 2033
- Figure 16: North America Countertop Industry Volume (K Unit), by Country 2025 & 2033
- Figure 17: North America Countertop Industry Revenue Share (%), by Country 2025 & 2033
- Figure 18: North America Countertop Industry Volume Share (%), by Country 2025 & 2033
- Figure 19: Europe Countertop Industry Revenue (Million), by Material 2025 & 2033
- Figure 20: Europe Countertop Industry Volume (K Unit), by Material 2025 & 2033
- Figure 21: Europe Countertop Industry Revenue Share (%), by Material 2025 & 2033
- Figure 22: Europe Countertop Industry Volume Share (%), by Material 2025 & 2033
- Figure 23: Europe Countertop Industry Revenue (Million), by End User 2025 & 2033
- Figure 24: Europe Countertop Industry Volume (K Unit), by End User 2025 & 2033
- Figure 25: Europe Countertop Industry Revenue Share (%), by End User 2025 & 2033
- Figure 26: Europe Countertop Industry Volume Share (%), by End User 2025 & 2033
- Figure 27: Europe Countertop Industry Revenue (Million), by Type 2025 & 2033
- Figure 28: Europe Countertop Industry Volume (K Unit), by Type 2025 & 2033
- Figure 29: Europe Countertop Industry Revenue Share (%), by Type 2025 & 2033
- Figure 30: Europe Countertop Industry Volume Share (%), by Type 2025 & 2033
- Figure 31: Europe Countertop Industry Revenue (Million), by Country 2025 & 2033
- Figure 32: Europe Countertop Industry Volume (K Unit), by Country 2025 & 2033
- Figure 33: Europe Countertop Industry Revenue Share (%), by Country 2025 & 2033
- Figure 34: Europe Countertop Industry Volume Share (%), by Country 2025 & 2033
- Figure 35: Asia Pacific Countertop Industry Revenue (Million), by Material 2025 & 2033
- Figure 36: Asia Pacific Countertop Industry Volume (K Unit), by Material 2025 & 2033
- Figure 37: Asia Pacific Countertop Industry Revenue Share (%), by Material 2025 & 2033
- Figure 38: Asia Pacific Countertop Industry Volume Share (%), by Material 2025 & 2033
- Figure 39: Asia Pacific Countertop Industry Revenue (Million), by End User 2025 & 2033
- Figure 40: Asia Pacific Countertop Industry Volume (K Unit), by End User 2025 & 2033
- Figure 41: Asia Pacific Countertop Industry Revenue Share (%), by End User 2025 & 2033
- Figure 42: Asia Pacific Countertop Industry Volume Share (%), by End User 2025 & 2033
- Figure 43: Asia Pacific Countertop Industry Revenue (Million), by Type 2025 & 2033
- Figure 44: Asia Pacific Countertop Industry Volume (K Unit), by Type 2025 & 2033
- Figure 45: Asia Pacific Countertop Industry Revenue Share (%), by Type 2025 & 2033
- Figure 46: Asia Pacific Countertop Industry Volume Share (%), by Type 2025 & 2033
- Figure 47: Asia Pacific Countertop Industry Revenue (Million), by Country 2025 & 2033
- Figure 48: Asia Pacific Countertop Industry Volume (K Unit), by Country 2025 & 2033
- Figure 49: Asia Pacific Countertop Industry Revenue Share (%), by Country 2025 & 2033
- Figure 50: Asia Pacific Countertop Industry Volume Share (%), by Country 2025 & 2033
- Figure 51: Latin America Countertop Industry Revenue (Million), by Material 2025 & 2033
- Figure 52: Latin America Countertop Industry Volume (K Unit), by Material 2025 & 2033
- Figure 53: Latin America Countertop Industry Revenue Share (%), by Material 2025 & 2033
- Figure 54: Latin America Countertop Industry Volume Share (%), by Material 2025 & 2033
- Figure 55: Latin America Countertop Industry Revenue (Million), by End User 2025 & 2033
- Figure 56: Latin America Countertop Industry Volume (K Unit), by End User 2025 & 2033
- Figure 57: Latin America Countertop Industry Revenue Share (%), by End User 2025 & 2033
- Figure 58: Latin America Countertop Industry Volume Share (%), by End User 2025 & 2033
- Figure 59: Latin America Countertop Industry Revenue (Million), by Type 2025 & 2033
- Figure 60: Latin America Countertop Industry Volume (K Unit), by Type 2025 & 2033
- Figure 61: Latin America Countertop Industry Revenue Share (%), by Type 2025 & 2033
- Figure 62: Latin America Countertop Industry Volume Share (%), by Type 2025 & 2033
- Figure 63: Latin America Countertop Industry Revenue (Million), by Country 2025 & 2033
- Figure 64: Latin America Countertop Industry Volume (K Unit), by Country 2025 & 2033
- Figure 65: Latin America Countertop Industry Revenue Share (%), by Country 2025 & 2033
- Figure 66: Latin America Countertop Industry Volume Share (%), by Country 2025 & 2033
- Figure 67: Middle East and Africa Countertop Industry Revenue (Million), by Material 2025 & 2033
- Figure 68: Middle East and Africa Countertop Industry Volume (K Unit), by Material 2025 & 2033
- Figure 69: Middle East and Africa Countertop Industry Revenue Share (%), by Material 2025 & 2033
- Figure 70: Middle East and Africa Countertop Industry Volume Share (%), by Material 2025 & 2033
- Figure 71: Middle East and Africa Countertop Industry Revenue (Million), by End User 2025 & 2033
- Figure 72: Middle East and Africa Countertop Industry Volume (K Unit), by End User 2025 & 2033
- Figure 73: Middle East and Africa Countertop Industry Revenue Share (%), by End User 2025 & 2033
- Figure 74: Middle East and Africa Countertop Industry Volume Share (%), by End User 2025 & 2033
- Figure 75: Middle East and Africa Countertop Industry Revenue (Million), by Type 2025 & 2033
- Figure 76: Middle East and Africa Countertop Industry Volume (K Unit), by Type 2025 & 2033
- Figure 77: Middle East and Africa Countertop Industry Revenue Share (%), by Type 2025 & 2033
- Figure 78: Middle East and Africa Countertop Industry Volume Share (%), by Type 2025 & 2033
- Figure 79: Middle East and Africa Countertop Industry Revenue (Million), by Country 2025 & 2033
- Figure 80: Middle East and Africa Countertop Industry Volume (K Unit), by Country 2025 & 2033
- Figure 81: Middle East and Africa Countertop Industry Revenue Share (%), by Country 2025 & 2033
- Figure 82: Middle East and Africa Countertop Industry Volume Share (%), by Country 2025 & 2033
List of Tables
- Table 1: Global Countertop Industry Revenue Million Forecast, by Material 2020 & 2033
- Table 2: Global Countertop Industry Volume K Unit Forecast, by Material 2020 & 2033
- Table 3: Global Countertop Industry Revenue Million Forecast, by End User 2020 & 2033
- Table 4: Global Countertop Industry Volume K Unit Forecast, by End User 2020 & 2033
- Table 5: Global Countertop Industry Revenue Million Forecast, by Type 2020 & 2033
- Table 6: Global Countertop Industry Volume K Unit Forecast, by Type 2020 & 2033
- Table 7: Global Countertop Industry Revenue Million Forecast, by Region 2020 & 2033
- Table 8: Global Countertop Industry Volume K Unit Forecast, by Region 2020 & 2033
- Table 9: Global Countertop Industry Revenue Million Forecast, by Material 2020 & 2033
- Table 10: Global Countertop Industry Volume K Unit Forecast, by Material 2020 & 2033
- Table 11: Global Countertop Industry Revenue Million Forecast, by End User 2020 & 2033
- Table 12: Global Countertop Industry Volume K Unit Forecast, by End User 2020 & 2033
- Table 13: Global Countertop Industry Revenue Million Forecast, by Type 2020 & 2033
- Table 14: Global Countertop Industry Volume K Unit Forecast, by Type 2020 & 2033
- Table 15: Global Countertop Industry Revenue Million Forecast, by Country 2020 & 2033
- Table 16: Global Countertop Industry Volume K Unit Forecast, by Country 2020 & 2033
- Table 17: Global Countertop Industry Revenue Million Forecast, by Material 2020 & 2033
- Table 18: Global Countertop Industry Volume K Unit Forecast, by Material 2020 & 2033
- Table 19: Global Countertop Industry Revenue Million Forecast, by End User 2020 & 2033
- Table 20: Global Countertop Industry Volume K Unit Forecast, by End User 2020 & 2033
- Table 21: Global Countertop Industry Revenue Million Forecast, by Type 2020 & 2033
- Table 22: Global Countertop Industry Volume K Unit Forecast, by Type 2020 & 2033
- Table 23: Global Countertop Industry Revenue Million Forecast, by Country 2020 & 2033
- Table 24: Global Countertop Industry Volume K Unit Forecast, by Country 2020 & 2033
- Table 25: Global Countertop Industry Revenue Million Forecast, by Material 2020 & 2033
- Table 26: Global Countertop Industry Volume K Unit Forecast, by Material 2020 & 2033
- Table 27: Global Countertop Industry Revenue Million Forecast, by End User 2020 & 2033
- Table 28: Global Countertop Industry Volume K Unit Forecast, by End User 2020 & 2033
- Table 29: Global Countertop Industry Revenue Million Forecast, by Type 2020 & 2033
- Table 30: Global Countertop Industry Volume K Unit Forecast, by Type 2020 & 2033
- Table 31: Global Countertop Industry Revenue Million Forecast, by Country 2020 & 2033
- Table 32: Global Countertop Industry Volume K Unit Forecast, by Country 2020 & 2033
- Table 33: Global Countertop Industry Revenue Million Forecast, by Material 2020 & 2033
- Table 34: Global Countertop Industry Volume K Unit Forecast, by Material 2020 & 2033
- Table 35: Global Countertop Industry Revenue Million Forecast, by End User 2020 & 2033
- Table 36: Global Countertop Industry Volume K Unit Forecast, by End User 2020 & 2033
- Table 37: Global Countertop Industry Revenue Million Forecast, by Type 2020 & 2033
- Table 38: Global Countertop Industry Volume K Unit Forecast, by Type 2020 & 2033
- Table 39: Global Countertop Industry Revenue Million Forecast, by Country 2020 & 2033
- Table 40: Global Countertop Industry Volume K Unit Forecast, by Country 2020 & 2033
- Table 41: Global Countertop Industry Revenue Million Forecast, by Material 2020 & 2033
- Table 42: Global Countertop Industry Volume K Unit Forecast, by Material 2020 & 2033
- Table 43: Global Countertop Industry Revenue Million Forecast, by End User 2020 & 2033
- Table 44: Global Countertop Industry Volume K Unit Forecast, by End User 2020 & 2033
- Table 45: Global Countertop Industry Revenue Million Forecast, by Type 2020 & 2033
- Table 46: Global Countertop Industry Volume K Unit Forecast, by Type 2020 & 2033
- Table 47: Global Countertop Industry Revenue Million Forecast, by Country 2020 & 2033
- Table 48: Global Countertop Industry Volume K Unit Forecast, by Country 2020 & 2033
Frequently Asked Questions
1. What is the projected Compound Annual Growth Rate (CAGR) of the Countertop Industry?
The projected CAGR is approximately 4.22%.
2. Which companies are prominent players in the Countertop Industry?
Key companies in the market include Cosentino S A, AKG Group, Vicostone, Cambria, Masco Corporation, ROSSKOPF + PARTNER AG, DuPont de Nemours Inc, ARISTECH SURFACES LLC, STRASSER Steine GmbH, Caesarstone Ltd, Daltile, Wilsonart LLC, Asian Granito India Limited, Pokarna Ltd, Aro Granite Industries Ltd.
3. What are the main segments of the Countertop Industry?
The market segments include Material, End User, Type.
4. Can you provide details about the market size?
The market size is estimated to be USD 148.86 Million as of 2022.
5. What are some drivers contributing to market growth?
Safety and Security of Documents Drives the Market Growth; Facility Of Large Storage Space Drives the Market Growth.
6. What are the notable trends driving market growth?
Granite is the Most Popular Choice for Countertops.
7. Are there any restraints impacting market growth?
Complex Registration Restrictions; Poor Resistance To Water And Chemical Damage.
8. Can you provide examples of recent developments in the market?
In August 2022: Wilsonart LLC, a world-class innovator of engineered surfaces, was named a winner of Kitchen & Bath Business (KBB) magazine's 2022 Readers' Choice Awards. The company has been voted as the top kitchen countertop brand in the Readers' Choice Awards for the second consecutive year.
9. What pricing options are available for accessing the report?
Pricing options include single-user, multi-user, and enterprise licenses priced at USD 4750, USD 5250, and USD 8750 respectively.
10. Is the market size provided in terms of value or volume?
The market size is provided in terms of value, measured in Million and volume, measured in K Unit.
11. Are there any specific market keywords associated with the report?
Yes, the market keyword associated with the report is "Countertop Industry," which aids in identifying and referencing the specific market segment covered.
12. How do I determine which pricing option suits my needs best?
The pricing options vary based on user requirements and access needs. Individual users may opt for single-user licenses, while businesses requiring broader access may choose multi-user or enterprise licenses for cost-effective access to the report.
13. Are there any additional resources or data provided in the Countertop Industry report?
While the report offers comprehensive insights, it's advisable to review the specific contents or supplementary materials provided to ascertain if additional resources or data are available.
14. How can I stay updated on further developments or reports in the Countertop Industry?
To stay informed about further developments, trends, and reports in the Countertop Industry, consider subscribing to industry newsletters, following relevant companies and organizations, or regularly checking reputable industry news sources and publications.
Methodology
Step 1 - Identification of Relevant Samples Size from Population Database


Step 2 - Approaches for Defining Global Market Size (Value, Volume* & Price*)

Note*: In applicable scenarios
Step 3 - Data Sources
Primary Research
- Web Analytics
- Survey Reports
- Research Institute
- Latest Research Reports
- Opinion Leaders
Secondary Research
- Annual Reports
- White Paper
- Latest Press Release
- Industry Association
- Paid Database
- Investor Presentations

Step 4 - Data Triangulation
Involves using different sources of information in order to increase the validity of a study
These sources are likely to be stakeholders in a program - participants, other researchers, program staff, other community members, and so on.
Then we put all data in single framework & apply various statistical tools to find out the dynamic on the market.
During the analysis stage, feedback from the stakeholder groups would be compared to determine areas of agreement as well as areas of divergence