

Key Insights
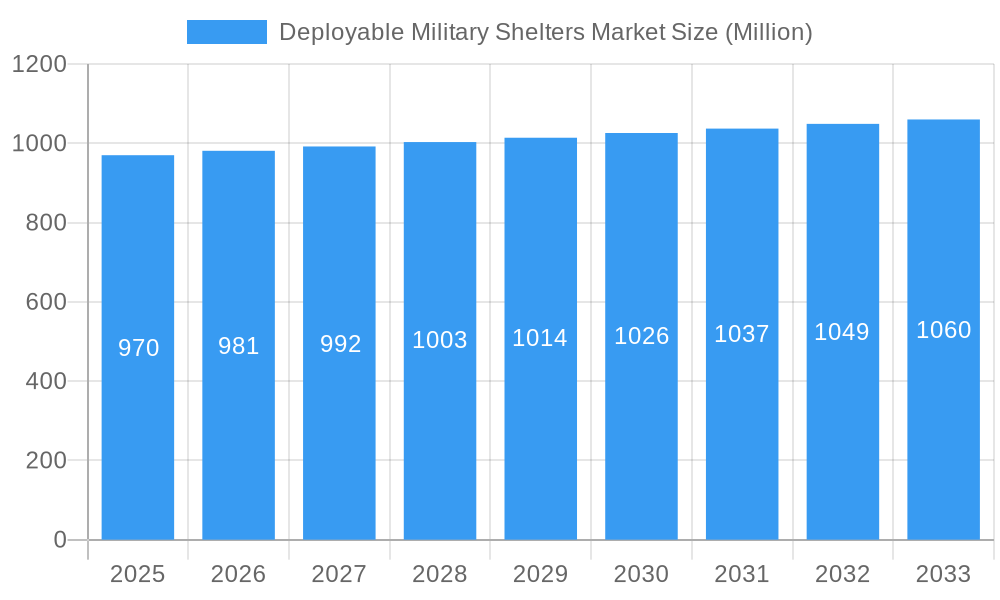
The Deployable Military Shelters market, valued at $0.97 billion in 2025, is projected to experience steady growth, driven by increasing military modernization budgets globally and the rising demand for lightweight, rapidly deployable shelters in diverse operational environments. The market's Compound Annual Growth Rate (CAGR) of 1.14% from 2025-2033 indicates a consistent, albeit moderate, expansion. Key growth drivers include the need for enhanced troop protection and improved logistical support in conflict zones and humanitarian aid missions. Technological advancements focusing on improved materials (lighter, stronger, more durable fabrics and composites) and integrated climate control systems are also contributing to market expansion. The segmentation by shelter type shows a strong preference for tents and containers, reflecting the established use of these solutions within military operations. However, the "Other Types" segment shows potential for future growth as innovative shelter designs emerge, possibly incorporating modularity, advanced energy solutions, and enhanced communication capabilities. Geographic distribution likely reflects established military bases and deployment patterns, with North America and Europe possibly holding larger market shares due to established defense industries and higher defense spending. Competitive pressures are moderate, with several established players (Camel Manufacturing, General Dynamics Corporation, HTS TENTIQ GmbH) alongside smaller, specialized companies (Litefighter Systems LLC, Weatherhaven Global Resources Ltd). This competitive landscape suggests opportunities for both established manufacturers to expand their product lines and for innovative newcomers to disrupt the market with cutting-edge technology and solutions.
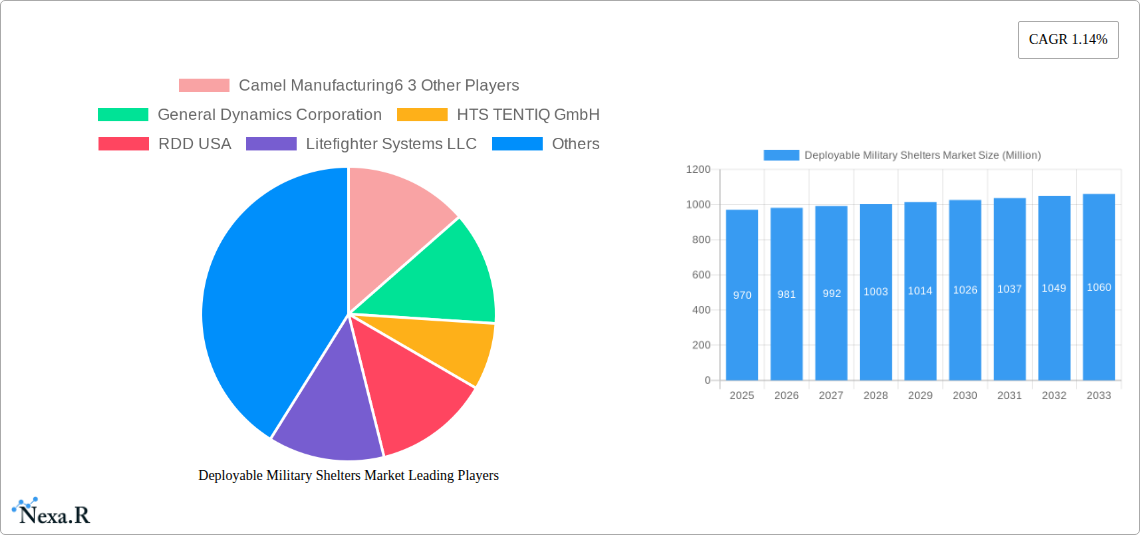
Deployable Military Shelters Market Market Size (In Million)
The market's relatively low CAGR might be attributed to factors such as the cyclical nature of military spending and the potential for technological saturation in certain segments. Restraints could also include the high initial cost of advanced shelter systems and the need for specialized training and maintenance. However, the continued focus on improving soldier welfare, enhancing operational efficiency, and optimizing logistics in diverse operational theaters points toward sustained market growth in the long term. The market's evolution is likely to be driven by a continuous interplay between the need for robust and reliable shelter solutions and the push towards lighter, more adaptable, and technologically advanced systems. The long-term prospects for the Deployable Military Shelters market remain positive, albeit with a moderate growth trajectory.
Deployable Military Shelters Market Company Market Share
Deployable Military Shelters Market: A Comprehensive Report (2019-2033)
This comprehensive report provides an in-depth analysis of the Deployable Military Shelters market, encompassing its dynamics, growth trends, regional performance, product landscape, and key players. With a study period spanning 2019-2033, a base year of 2025, and a forecast period of 2025-2033, this report offers invaluable insights for industry professionals, investors, and strategic decision-makers. The parent market is the broader military equipment market, while the child market focuses specifically on deployable shelters for military applications. The market size is estimated at XX million units in 2025 and is projected to reach XX million units by 2033.
Deployable Military Shelters Market Market Dynamics & Structure
The deployable military shelters market is characterized by a moderately concentrated landscape, with a few major players holding significant market share. The market is driven by technological innovation, particularly in materials science and design, leading to lighter, more durable, and versatile shelters. Stringent regulatory frameworks concerning safety and performance standards influence product development and adoption. Competitive substitutes include traditional fixed structures and improvised shelters, but the advantages of deployable shelters in terms of mobility and rapid deployment continue to drive demand. End-users are primarily military forces across various branches and geographies, with procurement decisions influenced by budgetary considerations and operational requirements. The past five years have witnessed a moderate level of M&A activity, with approximately xx deals completed, largely driven by strategic expansion and technological integration.
- Market Concentration: Moderately concentrated, with top 5 players holding approximately xx% market share.
- Technological Innovation: Focus on lightweight materials (e.g., advanced composites), rapid deployment mechanisms, and integrated climate control systems.
- Regulatory Framework: Stringent safety and performance standards impacting design and manufacturing.
- Competitive Substitutes: Traditional structures and improvised shelters pose limited competition.
- End-User Demographics: Primarily military forces globally, with varying needs based on mission type and deployment environment.
- M&A Trends: Moderate activity (xx deals in the past five years), driven by strategic expansion and technological capabilities.
Deployable Military Shelters Market Growth Trends & Insights
The deployable military shelters market experienced a CAGR of xx% during the historical period (2019-2024), driven by increased military spending globally, particularly in regions experiencing geopolitical instability. Adoption rates have been significantly influenced by technological advancements, resulting in improved shelter performance, functionality, and reduced weight. Technological disruptions, such as the incorporation of advanced materials and smart technologies, are expected to continue driving market growth. Consumer behavior shifts, characterized by a preference for modular and adaptable shelters, further fuel market expansion. The market is anticipated to maintain a healthy CAGR of xx% during the forecast period (2025-2033), driven by continued investment in military modernization and the increasing demand for rapid deployment capabilities. Market penetration is expected to reach xx% by 2033.
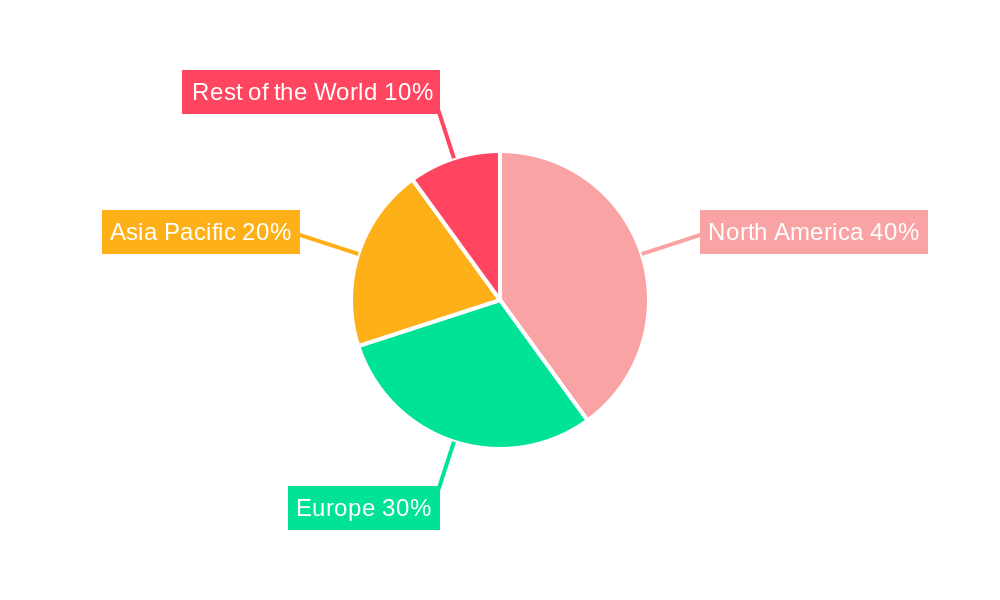
Dominant Regions, Countries, or Segments in Deployable Military Shelters Market
North America currently holds the largest market share in the deployable military shelters market, driven by significant military spending and a high concentration of key players. The region's advanced technological capabilities and robust defense infrastructure also contribute to its dominance. Europe follows closely, characterized by a strong defense industry and increasing demand for modern, deployable shelters. Within the product segments, the tents segment currently dominates, owing to its versatility, cost-effectiveness, and adaptability to various operational needs. The containers segment exhibits promising growth potential driven by its increased durability and protection capabilities.
- North America: High military spending, technological advancements, and established industry players.
- Europe: Strong defense industry and increasing demand for modern shelters.
- Asia-Pacific: Growing military modernization efforts and rising geopolitical tensions.
- Tents Segment: Dominates due to versatility and cost-effectiveness.
- Containers Segment: High growth potential due to improved durability and protection.
- Other Types: Niche applications drive steady market growth.
Deployable Military Shelters Market Product Landscape
Deployable military shelters are continuously evolving, incorporating innovative materials like lightweight composites and advanced fabrics. Applications range from medical facilities and command centers to sleeping quarters and storage units. Key performance indicators include weight, ease of deployment, durability, and climate control capabilities. Unique selling propositions include rapid deployment, modularity, and adaptability to different environments. Technological advancements focus on improved insulation, self-sufficiency (e.g., solar power integration), and enhanced security features.
Key Drivers, Barriers & Challenges in Deployable Military Shelters Market
Key Drivers: Increased military modernization efforts, growing geopolitical instability, demand for rapid deployment capabilities, and technological advancements in materials and design. For instance, the development of lightweight, yet durable materials has significantly improved shelter portability and reduced logistical burdens.
Challenges & Restraints: Supply chain disruptions, particularly related to raw material sourcing, can impact production and delivery timelines. Strict regulatory requirements and certification processes add to manufacturing costs and complexity. Intense competition among established players and the emergence of new entrants can pressure pricing and profit margins.
Emerging Opportunities in Deployable Military Shelters Market
Untapped markets in developing economies with growing military budgets present significant growth opportunities. The integration of smart technologies, such as integrated sensors and communication systems, offers potential for enhanced situational awareness and improved shelter functionality. The development of self-sufficient shelters with integrated power generation and climate control systems will cater to the evolving demand for enhanced operational capabilities.
Growth Accelerators in the Deployable Military Shelters Market Industry
Technological breakthroughs, including the development of more resilient and lightweight materials, are key growth catalysts. Strategic partnerships between shelter manufacturers and technology providers accelerate innovation and market expansion. Government initiatives promoting military modernization and the adoption of advanced technologies further drive market growth.
Key Players Shaping the Deployable Military Shelters Market Market
- Camel Manufacturing
- General Dynamics Corporation
- HTS TENTIQ GmbH
- RDD USA
- Litefighter Systems LLC
- Rubb Buildings Ltd
- Weatherhaven Global Resources Ltd
- UTS Systems
- Alaska Structures Inc
- Losberger GmbH
- Federal-Fabrics-Fibers Inc
- Eureka! Expeditionary Systems
- ROF
- NorLense AS
- AAR Corp
- Saab AB
- HDT Global
Notable Milestones in Deployable Military Shelters Market Sector
- 2021: Introduction of a new generation of lightweight, rapidly deployable shelters by Camel Manufacturing.
- 2022: Strategic partnership between General Dynamics and a technology provider to integrate smart technologies into shelters.
- 2023: Acquisition of a smaller shelter manufacturer by HTS TENTIQ GmbH, expanding its product portfolio.
- 2024: Launch of a new, self-sufficient shelter with integrated solar power by Weatherhaven Global Resources Ltd.
In-Depth Deployable Military Shelters Market Market Outlook
The deployable military shelters market is poised for sustained growth driven by continuous technological advancements, increasing military modernization budgets, and the rising demand for rapid deployment solutions in various operational scenarios. Strategic opportunities exist for players to capitalize on evolving customer needs by focusing on innovation, partnerships, and market expansion into underserved regions. The market's future is bright, with significant potential for further expansion and diversification.
Deployable Military Shelters Market Segmentation
- 1. Production Analysis
- 2. Consumption Analysis
- 3. Import Market Analysis (Value & Volume)
- 4. Export Market Analysis (Value & Volume)
- 5. Price Trend Analysis
Deployable Military Shelters Market Segmentation By Geography
-
1. North America
- 1.1. United States
- 1.2. Canada
- 1.3. Mexico
-
2. South America
- 2.1. Brazil
- 2.2. Argentina
- 2.3. Rest of South America
-
3. Europe
- 3.1. United Kingdom
- 3.2. Germany
- 3.3. France
- 3.4. Italy
- 3.5. Spain
- 3.6. Russia
- 3.7. Benelux
- 3.8. Nordics
- 3.9. Rest of Europe
-
4. Middle East & Africa
- 4.1. Turkey
- 4.2. Israel
- 4.3. GCC
- 4.4. North Africa
- 4.5. South Africa
- 4.6. Rest of Middle East & Africa
-
5. Asia Pacific
- 5.1. China
- 5.2. India
- 5.3. Japan
- 5.4. South Korea
- 5.5. ASEAN
- 5.6. Oceania
- 5.7. Rest of Asia Pacific
Deployable Military Shelters Market Regional Market Share
Geographic Coverage of Deployable Military Shelters Market
Deployable Military Shelters Market REPORT HIGHLIGHTS
| Aspects | Details |
|---|---|
| Study Period | 2020-2034 |
| Base Year | 2025 |
| Estimated Year | 2026 |
| Forecast Period | 2026-2034 |
| Historical Period | 2020-2025 |
| Growth Rate | CAGR of 1.14% from 2020-2034 |
| Segmentation |
|
Table of Contents
- 1. Introduction
- 1.1. Research Scope
- 1.2. Market Segmentation
- 1.3. Research Objective
- 1.4. Definitions and Assumptions
- 2. Executive Summary
- 2.1. Market Snapshot
- 3. Market Dynamics
- 3.1. Market Drivers
- 3.2. Market Restrains
- 3.3. Market Trends
- 3.4. Market Opportunities
- 4. Market Factor Analysis
- 4.1. Porters Five Forces
- 4.1.1. Bargaining Power of Suppliers
- 4.1.2. Bargaining Power of Buyers
- 4.1.3. Threat of New Entrants
- 4.1.4. Threat of Substitutes
- 4.1.5. Competitive Rivalry
- 4.2. PESTEL analysis
- 4.3. BCG Analysis
- 4.3.1. Stars (High Growth, High Market Share)
- 4.3.2. Cash Cows (Low Growth, High Market Share)
- 4.3.3. Question Mark (High Growth, Low Market Share)
- 4.3.4. Dogs (Low Growth, Low Market Share)
- 4.4. Ansoff Matrix Analysis
- 4.5. Supply Chain Analysis
- 4.6. Regulatory Landscape
- 4.7. Current Market Potential and Opportunity Assessment (TAM–SAM–SOM Framework)
- 4.8. NRP Analyst Note
- 4.1. Porters Five Forces
- 5. Market Analysis, Insights and Forecast 2021-2033
- 5.1. Market Analysis, Insights and Forecast - by Production Analysis
- 5.2. Market Analysis, Insights and Forecast - by Consumption Analysis
- 5.3. Market Analysis, Insights and Forecast - by Import Market Analysis (Value & Volume)
- 5.4. Market Analysis, Insights and Forecast - by Export Market Analysis (Value & Volume)
- 5.5. Market Analysis, Insights and Forecast - by Price Trend Analysis
- 5.6. Market Analysis, Insights and Forecast - by Region
- 5.6.1. North America
- 5.6.2. South America
- 5.6.3. Europe
- 5.6.4. Middle East & Africa
- 5.6.5. Asia Pacific
- 6. Global Deployable Military Shelters Market Analysis, Insights and Forecast, 2021-2033
- 6.1. Market Analysis, Insights and Forecast - by Production Analysis
- 6.2. Market Analysis, Insights and Forecast - by Consumption Analysis
- 6.3. Market Analysis, Insights and Forecast - by Import Market Analysis (Value & Volume)
- 6.4. Market Analysis, Insights and Forecast - by Export Market Analysis (Value & Volume)
- 6.5. Market Analysis, Insights and Forecast - by Price Trend Analysis
- 7. North America Deployable Military Shelters Market Analysis, Insights and Forecast, 2020-2032
- 7.1. Market Analysis, Insights and Forecast - by Production Analysis
- 7.2. Market Analysis, Insights and Forecast - by Consumption Analysis
- 7.3. Market Analysis, Insights and Forecast - by Import Market Analysis (Value & Volume)
- 7.4. Market Analysis, Insights and Forecast - by Export Market Analysis (Value & Volume)
- 7.5. Market Analysis, Insights and Forecast - by Price Trend Analysis
- 8. South America Deployable Military Shelters Market Analysis, Insights and Forecast, 2020-2032
- 8.1. Market Analysis, Insights and Forecast - by Production Analysis
- 8.2. Market Analysis, Insights and Forecast - by Consumption Analysis
- 8.3. Market Analysis, Insights and Forecast - by Import Market Analysis (Value & Volume)
- 8.4. Market Analysis, Insights and Forecast - by Export Market Analysis (Value & Volume)
- 8.5. Market Analysis, Insights and Forecast - by Price Trend Analysis
- 9. Europe Deployable Military Shelters Market Analysis, Insights and Forecast, 2020-2032
- 9.1. Market Analysis, Insights and Forecast - by Production Analysis
- 9.2. Market Analysis, Insights and Forecast - by Consumption Analysis
- 9.3. Market Analysis, Insights and Forecast - by Import Market Analysis (Value & Volume)
- 9.4. Market Analysis, Insights and Forecast - by Export Market Analysis (Value & Volume)
- 9.5. Market Analysis, Insights and Forecast - by Price Trend Analysis
- 10. Middle East & Africa Deployable Military Shelters Market Analysis, Insights and Forecast, 2020-2032
- 10.1. Market Analysis, Insights and Forecast - by Production Analysis
- 10.2. Market Analysis, Insights and Forecast - by Consumption Analysis
- 10.3. Market Analysis, Insights and Forecast - by Import Market Analysis (Value & Volume)
- 10.4. Market Analysis, Insights and Forecast - by Export Market Analysis (Value & Volume)
- 10.5. Market Analysis, Insights and Forecast - by Price Trend Analysis
- 11. Asia Pacific Deployable Military Shelters Market Analysis, Insights and Forecast, 2020-2032
- 11.1. Market Analysis, Insights and Forecast - by Production Analysis
- 11.2. Market Analysis, Insights and Forecast - by Consumption Analysis
- 11.3. Market Analysis, Insights and Forecast - by Import Market Analysis (Value & Volume)
- 11.4. Market Analysis, Insights and Forecast - by Export Market Analysis (Value & Volume)
- 11.5. Market Analysis, Insights and Forecast - by Price Trend Analysis
- 12. Competitive Analysis
- 12.1. Company Profiles
- 12.1.1 Camel Manufacturing6 3 Other Players
- 12.1.1.1. Company Overview
- 12.1.1.2. Products
- 12.1.1.3. Company Financials
- 12.1.1.4. SWOT Analysis
- 12.1.2 General Dynamics Corporation
- 12.1.2.1. Company Overview
- 12.1.2.2. Products
- 12.1.2.3. Company Financials
- 12.1.2.4. SWOT Analysis
- 12.1.3 HTS TENTIQ GmbH
- 12.1.3.1. Company Overview
- 12.1.3.2. Products
- 12.1.3.3. Company Financials
- 12.1.3.4. SWOT Analysis
- 12.1.4 RDD USA
- 12.1.4.1. Company Overview
- 12.1.4.2. Products
- 12.1.4.3. Company Financials
- 12.1.4.4. SWOT Analysis
- 12.1.5 Litefighter Systems LLC
- 12.1.5.1. Company Overview
- 12.1.5.2. Products
- 12.1.5.3. Company Financials
- 12.1.5.4. SWOT Analysis
- 12.1.6 Rubb Buildings Ltd
- 12.1.6.1. Company Overview
- 12.1.6.2. Products
- 12.1.6.3. Company Financials
- 12.1.6.4. SWOT Analysis
- 12.1.7 Weatherhaven Global Resources Ltd
- 12.1.7.1. Company Overview
- 12.1.7.2. Products
- 12.1.7.3. Company Financials
- 12.1.7.4. SWOT Analysis
- 12.1.8 UTS Systems
- 12.1.8.1. Company Overview
- 12.1.8.2. Products
- 12.1.8.3. Company Financials
- 12.1.8.4. SWOT Analysis
- 12.1.9 Alaska Structures Inc
- 12.1.9.1. Company Overview
- 12.1.9.2. Products
- 12.1.9.3. Company Financials
- 12.1.9.4. SWOT Analysis
- 12.1.10 Losberger GmbH
- 12.1.10.1. Company Overview
- 12.1.10.2. Products
- 12.1.10.3. Company Financials
- 12.1.10.4. SWOT Analysis
- 12.1.11 Federal-Fabrics-Fibers Inc
- 12.1.11.1. Company Overview
- 12.1.11.2. Products
- 12.1.11.3. Company Financials
- 12.1.11.4. SWOT Analysis
- 12.1.12 Eureka! Expeditionary Systems
- 12.1.12.1. Company Overview
- 12.1.12.2. Products
- 12.1.12.3. Company Financials
- 12.1.12.4. SWOT Analysis
- 12.1.13 ROF
- 12.1.13.1. Company Overview
- 12.1.13.2. Products
- 12.1.13.3. Company Financials
- 12.1.13.4. SWOT Analysis
- 12.1.14 NorLense AS
- 12.1.14.1. Company Overview
- 12.1.14.2. Products
- 12.1.14.3. Company Financials
- 12.1.14.4. SWOT Analysis
- 12.1.15 AAR Corp
- 12.1.15.1. Company Overview
- 12.1.15.2. Products
- 12.1.15.3. Company Financials
- 12.1.15.4. SWOT Analysis
- 12.1.16 Saab AB
- 12.1.16.1. Company Overview
- 12.1.16.2. Products
- 12.1.16.3. Company Financials
- 12.1.16.4. SWOT Analysis
- 12.1.17 HDT Global
- 12.1.17.1. Company Overview
- 12.1.17.2. Products
- 12.1.17.3. Company Financials
- 12.1.17.4. SWOT Analysis
- 12.1.1 Camel Manufacturing6 3 Other Players
- 12.2. Market Entropy
- 12.2.1 Company's Key Areas Served
- 12.2.2 Recent Developments
- 12.3. Company Market Share Analysis 2025
- 12.3.1 Top 5 Companies Market Share Analysis
- 12.3.2 Top 3 Companies Market Share Analysis
- 12.4. List of Potential Customers
- 13. Research Methodology
List of Figures
- Figure 1: Global Deployable Military Shelters Market Revenue Breakdown (billion, %) by Region 2025 & 2033
- Figure 2: North America Deployable Military Shelters Market Revenue (billion), by Production Analysis 2025 & 2033
- Figure 3: North America Deployable Military Shelters Market Revenue Share (%), by Production Analysis 2025 & 2033
- Figure 4: North America Deployable Military Shelters Market Revenue (billion), by Consumption Analysis 2025 & 2033
- Figure 5: North America Deployable Military Shelters Market Revenue Share (%), by Consumption Analysis 2025 & 2033
- Figure 6: North America Deployable Military Shelters Market Revenue (billion), by Import Market Analysis (Value & Volume) 2025 & 2033
- Figure 7: North America Deployable Military Shelters Market Revenue Share (%), by Import Market Analysis (Value & Volume) 2025 & 2033
- Figure 8: North America Deployable Military Shelters Market Revenue (billion), by Export Market Analysis (Value & Volume) 2025 & 2033
- Figure 9: North America Deployable Military Shelters Market Revenue Share (%), by Export Market Analysis (Value & Volume) 2025 & 2033
- Figure 10: North America Deployable Military Shelters Market Revenue (billion), by Price Trend Analysis 2025 & 2033
- Figure 11: North America Deployable Military Shelters Market Revenue Share (%), by Price Trend Analysis 2025 & 2033
- Figure 12: North America Deployable Military Shelters Market Revenue (billion), by Country 2025 & 2033
- Figure 13: North America Deployable Military Shelters Market Revenue Share (%), by Country 2025 & 2033
- Figure 14: South America Deployable Military Shelters Market Revenue (billion), by Production Analysis 2025 & 2033
- Figure 15: South America Deployable Military Shelters Market Revenue Share (%), by Production Analysis 2025 & 2033
- Figure 16: South America Deployable Military Shelters Market Revenue (billion), by Consumption Analysis 2025 & 2033
- Figure 17: South America Deployable Military Shelters Market Revenue Share (%), by Consumption Analysis 2025 & 2033
- Figure 18: South America Deployable Military Shelters Market Revenue (billion), by Import Market Analysis (Value & Volume) 2025 & 2033
- Figure 19: South America Deployable Military Shelters Market Revenue Share (%), by Import Market Analysis (Value & Volume) 2025 & 2033
- Figure 20: South America Deployable Military Shelters Market Revenue (billion), by Export Market Analysis (Value & Volume) 2025 & 2033
- Figure 21: South America Deployable Military Shelters Market Revenue Share (%), by Export Market Analysis (Value & Volume) 2025 & 2033
- Figure 22: South America Deployable Military Shelters Market Revenue (billion), by Price Trend Analysis 2025 & 2033
- Figure 23: South America Deployable Military Shelters Market Revenue Share (%), by Price Trend Analysis 2025 & 2033
- Figure 24: South America Deployable Military Shelters Market Revenue (billion), by Country 2025 & 2033
- Figure 25: South America Deployable Military Shelters Market Revenue Share (%), by Country 2025 & 2033
- Figure 26: Europe Deployable Military Shelters Market Revenue (billion), by Production Analysis 2025 & 2033
- Figure 27: Europe Deployable Military Shelters Market Revenue Share (%), by Production Analysis 2025 & 2033
- Figure 28: Europe Deployable Military Shelters Market Revenue (billion), by Consumption Analysis 2025 & 2033
- Figure 29: Europe Deployable Military Shelters Market Revenue Share (%), by Consumption Analysis 2025 & 2033
- Figure 30: Europe Deployable Military Shelters Market Revenue (billion), by Import Market Analysis (Value & Volume) 2025 & 2033
- Figure 31: Europe Deployable Military Shelters Market Revenue Share (%), by Import Market Analysis (Value & Volume) 2025 & 2033
- Figure 32: Europe Deployable Military Shelters Market Revenue (billion), by Export Market Analysis (Value & Volume) 2025 & 2033
- Figure 33: Europe Deployable Military Shelters Market Revenue Share (%), by Export Market Analysis (Value & Volume) 2025 & 2033
- Figure 34: Europe Deployable Military Shelters Market Revenue (billion), by Price Trend Analysis 2025 & 2033
- Figure 35: Europe Deployable Military Shelters Market Revenue Share (%), by Price Trend Analysis 2025 & 2033
- Figure 36: Europe Deployable Military Shelters Market Revenue (billion), by Country 2025 & 2033
- Figure 37: Europe Deployable Military Shelters Market Revenue Share (%), by Country 2025 & 2033
- Figure 38: Middle East & Africa Deployable Military Shelters Market Revenue (billion), by Production Analysis 2025 & 2033
- Figure 39: Middle East & Africa Deployable Military Shelters Market Revenue Share (%), by Production Analysis 2025 & 2033
- Figure 40: Middle East & Africa Deployable Military Shelters Market Revenue (billion), by Consumption Analysis 2025 & 2033
- Figure 41: Middle East & Africa Deployable Military Shelters Market Revenue Share (%), by Consumption Analysis 2025 & 2033
- Figure 42: Middle East & Africa Deployable Military Shelters Market Revenue (billion), by Import Market Analysis (Value & Volume) 2025 & 2033
- Figure 43: Middle East & Africa Deployable Military Shelters Market Revenue Share (%), by Import Market Analysis (Value & Volume) 2025 & 2033
- Figure 44: Middle East & Africa Deployable Military Shelters Market Revenue (billion), by Export Market Analysis (Value & Volume) 2025 & 2033
- Figure 45: Middle East & Africa Deployable Military Shelters Market Revenue Share (%), by Export Market Analysis (Value & Volume) 2025 & 2033
- Figure 46: Middle East & Africa Deployable Military Shelters Market Revenue (billion), by Price Trend Analysis 2025 & 2033
- Figure 47: Middle East & Africa Deployable Military Shelters Market Revenue Share (%), by Price Trend Analysis 2025 & 2033
- Figure 48: Middle East & Africa Deployable Military Shelters Market Revenue (billion), by Country 2025 & 2033
- Figure 49: Middle East & Africa Deployable Military Shelters Market Revenue Share (%), by Country 2025 & 2033
- Figure 50: Asia Pacific Deployable Military Shelters Market Revenue (billion), by Production Analysis 2025 & 2033
- Figure 51: Asia Pacific Deployable Military Shelters Market Revenue Share (%), by Production Analysis 2025 & 2033
- Figure 52: Asia Pacific Deployable Military Shelters Market Revenue (billion), by Consumption Analysis 2025 & 2033
- Figure 53: Asia Pacific Deployable Military Shelters Market Revenue Share (%), by Consumption Analysis 2025 & 2033
- Figure 54: Asia Pacific Deployable Military Shelters Market Revenue (billion), by Import Market Analysis (Value & Volume) 2025 & 2033
- Figure 55: Asia Pacific Deployable Military Shelters Market Revenue Share (%), by Import Market Analysis (Value & Volume) 2025 & 2033
- Figure 56: Asia Pacific Deployable Military Shelters Market Revenue (billion), by Export Market Analysis (Value & Volume) 2025 & 2033
- Figure 57: Asia Pacific Deployable Military Shelters Market Revenue Share (%), by Export Market Analysis (Value & Volume) 2025 & 2033
- Figure 58: Asia Pacific Deployable Military Shelters Market Revenue (billion), by Price Trend Analysis 2025 & 2033
- Figure 59: Asia Pacific Deployable Military Shelters Market Revenue Share (%), by Price Trend Analysis 2025 & 2033
- Figure 60: Asia Pacific Deployable Military Shelters Market Revenue (billion), by Country 2025 & 2033
- Figure 61: Asia Pacific Deployable Military Shelters Market Revenue Share (%), by Country 2025 & 2033
List of Tables
- Table 1: Global Deployable Military Shelters Market Revenue billion Forecast, by Production Analysis 2020 & 2033
- Table 2: Global Deployable Military Shelters Market Revenue billion Forecast, by Consumption Analysis 2020 & 2033
- Table 3: Global Deployable Military Shelters Market Revenue billion Forecast, by Import Market Analysis (Value & Volume) 2020 & 2033
- Table 4: Global Deployable Military Shelters Market Revenue billion Forecast, by Export Market Analysis (Value & Volume) 2020 & 2033
- Table 5: Global Deployable Military Shelters Market Revenue billion Forecast, by Price Trend Analysis 2020 & 2033
- Table 6: Global Deployable Military Shelters Market Revenue billion Forecast, by Region 2020 & 2033
- Table 7: Global Deployable Military Shelters Market Revenue billion Forecast, by Production Analysis 2020 & 2033
- Table 8: Global Deployable Military Shelters Market Revenue billion Forecast, by Consumption Analysis 2020 & 2033
- Table 9: Global Deployable Military Shelters Market Revenue billion Forecast, by Import Market Analysis (Value & Volume) 2020 & 2033
- Table 10: Global Deployable Military Shelters Market Revenue billion Forecast, by Export Market Analysis (Value & Volume) 2020 & 2033
- Table 11: Global Deployable Military Shelters Market Revenue billion Forecast, by Price Trend Analysis 2020 & 2033
- Table 12: Global Deployable Military Shelters Market Revenue billion Forecast, by Country 2020 & 2033
- Table 13: United States Deployable Military Shelters Market Revenue (billion) Forecast, by Application 2020 & 2033
- Table 14: Canada Deployable Military Shelters Market Revenue (billion) Forecast, by Application 2020 & 2033
- Table 15: Mexico Deployable Military Shelters Market Revenue (billion) Forecast, by Application 2020 & 2033
- Table 16: Global Deployable Military Shelters Market Revenue billion Forecast, by Production Analysis 2020 & 2033
- Table 17: Global Deployable Military Shelters Market Revenue billion Forecast, by Consumption Analysis 2020 & 2033
- Table 18: Global Deployable Military Shelters Market Revenue billion Forecast, by Import Market Analysis (Value & Volume) 2020 & 2033
- Table 19: Global Deployable Military Shelters Market Revenue billion Forecast, by Export Market Analysis (Value & Volume) 2020 & 2033
- Table 20: Global Deployable Military Shelters Market Revenue billion Forecast, by Price Trend Analysis 2020 & 2033
- Table 21: Global Deployable Military Shelters Market Revenue billion Forecast, by Country 2020 & 2033
- Table 22: Brazil Deployable Military Shelters Market Revenue (billion) Forecast, by Application 2020 & 2033
- Table 23: Argentina Deployable Military Shelters Market Revenue (billion) Forecast, by Application 2020 & 2033
- Table 24: Rest of South America Deployable Military Shelters Market Revenue (billion) Forecast, by Application 2020 & 2033
- Table 25: Global Deployable Military Shelters Market Revenue billion Forecast, by Production Analysis 2020 & 2033
- Table 26: Global Deployable Military Shelters Market Revenue billion Forecast, by Consumption Analysis 2020 & 2033
- Table 27: Global Deployable Military Shelters Market Revenue billion Forecast, by Import Market Analysis (Value & Volume) 2020 & 2033
- Table 28: Global Deployable Military Shelters Market Revenue billion Forecast, by Export Market Analysis (Value & Volume) 2020 & 2033
- Table 29: Global Deployable Military Shelters Market Revenue billion Forecast, by Price Trend Analysis 2020 & 2033
- Table 30: Global Deployable Military Shelters Market Revenue billion Forecast, by Country 2020 & 2033
- Table 31: United Kingdom Deployable Military Shelters Market Revenue (billion) Forecast, by Application 2020 & 2033
- Table 32: Germany Deployable Military Shelters Market Revenue (billion) Forecast, by Application 2020 & 2033
- Table 33: France Deployable Military Shelters Market Revenue (billion) Forecast, by Application 2020 & 2033
- Table 34: Italy Deployable Military Shelters Market Revenue (billion) Forecast, by Application 2020 & 2033
- Table 35: Spain Deployable Military Shelters Market Revenue (billion) Forecast, by Application 2020 & 2033
- Table 36: Russia Deployable Military Shelters Market Revenue (billion) Forecast, by Application 2020 & 2033
- Table 37: Benelux Deployable Military Shelters Market Revenue (billion) Forecast, by Application 2020 & 2033
- Table 38: Nordics Deployable Military Shelters Market Revenue (billion) Forecast, by Application 2020 & 2033
- Table 39: Rest of Europe Deployable Military Shelters Market Revenue (billion) Forecast, by Application 2020 & 2033
- Table 40: Global Deployable Military Shelters Market Revenue billion Forecast, by Production Analysis 2020 & 2033
- Table 41: Global Deployable Military Shelters Market Revenue billion Forecast, by Consumption Analysis 2020 & 2033
- Table 42: Global Deployable Military Shelters Market Revenue billion Forecast, by Import Market Analysis (Value & Volume) 2020 & 2033
- Table 43: Global Deployable Military Shelters Market Revenue billion Forecast, by Export Market Analysis (Value & Volume) 2020 & 2033
- Table 44: Global Deployable Military Shelters Market Revenue billion Forecast, by Price Trend Analysis 2020 & 2033
- Table 45: Global Deployable Military Shelters Market Revenue billion Forecast, by Country 2020 & 2033
- Table 46: Turkey Deployable Military Shelters Market Revenue (billion) Forecast, by Application 2020 & 2033
- Table 47: Israel Deployable Military Shelters Market Revenue (billion) Forecast, by Application 2020 & 2033
- Table 48: GCC Deployable Military Shelters Market Revenue (billion) Forecast, by Application 2020 & 2033
- Table 49: North Africa Deployable Military Shelters Market Revenue (billion) Forecast, by Application 2020 & 2033
- Table 50: South Africa Deployable Military Shelters Market Revenue (billion) Forecast, by Application 2020 & 2033
- Table 51: Rest of Middle East & Africa Deployable Military Shelters Market Revenue (billion) Forecast, by Application 2020 & 2033
- Table 52: Global Deployable Military Shelters Market Revenue billion Forecast, by Production Analysis 2020 & 2033
- Table 53: Global Deployable Military Shelters Market Revenue billion Forecast, by Consumption Analysis 2020 & 2033
- Table 54: Global Deployable Military Shelters Market Revenue billion Forecast, by Import Market Analysis (Value & Volume) 2020 & 2033
- Table 55: Global Deployable Military Shelters Market Revenue billion Forecast, by Export Market Analysis (Value & Volume) 2020 & 2033
- Table 56: Global Deployable Military Shelters Market Revenue billion Forecast, by Price Trend Analysis 2020 & 2033
- Table 57: Global Deployable Military Shelters Market Revenue billion Forecast, by Country 2020 & 2033
- Table 58: China Deployable Military Shelters Market Revenue (billion) Forecast, by Application 2020 & 2033
- Table 59: India Deployable Military Shelters Market Revenue (billion) Forecast, by Application 2020 & 2033
- Table 60: Japan Deployable Military Shelters Market Revenue (billion) Forecast, by Application 2020 & 2033
- Table 61: South Korea Deployable Military Shelters Market Revenue (billion) Forecast, by Application 2020 & 2033
- Table 62: ASEAN Deployable Military Shelters Market Revenue (billion) Forecast, by Application 2020 & 2033
- Table 63: Oceania Deployable Military Shelters Market Revenue (billion) Forecast, by Application 2020 & 2033
- Table 64: Rest of Asia Pacific Deployable Military Shelters Market Revenue (billion) Forecast, by Application 2020 & 2033
Frequently Asked Questions
1. What is the projected Compound Annual Growth Rate (CAGR) of the Deployable Military Shelters Market?
The projected CAGR is approximately 1.14%.
2. Which companies are prominent players in the Deployable Military Shelters Market?
Key companies in the market include Camel Manufacturing6 3 Other Players, General Dynamics Corporation, HTS TENTIQ GmbH, RDD USA, Litefighter Systems LLC, Rubb Buildings Ltd, Weatherhaven Global Resources Ltd, UTS Systems, Alaska Structures Inc, Losberger GmbH, Federal-Fabrics-Fibers Inc, Eureka! Expeditionary Systems, ROF, NorLense AS, AAR Corp, Saab AB, HDT Global.
3. What are the main segments of the Deployable Military Shelters Market?
The market segments include Production Analysis, Consumption Analysis, Import Market Analysis (Value & Volume), Export Market Analysis (Value & Volume), Price Trend Analysis.
4. Can you provide details about the market size?
The market size is estimated to be USD 0.98 billion as of 2022.
5. What are some drivers contributing to market growth?
Increase in Internet of Things (IoT) and Autonomous Systems; Rise in Demand for Military and Defense Satellite Communication Solutions.
6. What are the notable trends driving market growth?
Other Types Segment Accounted for a Major Market Share in 2021.
7. Are there any restraints impacting market growth?
Cybersecurity Threats to Satellite Communication; Interference in Transmission of Data.
8. Can you provide examples of recent developments in the market?
N/A
9. What pricing options are available for accessing the report?
Pricing options include single-user, multi-user, and enterprise licenses priced at USD 4750, USD 5250, and USD 8750 respectively.
10. Is the market size provided in terms of value or volume?
The market size is provided in terms of value, measured in billion.
11. Are there any specific market keywords associated with the report?
Yes, the market keyword associated with the report is "Deployable Military Shelters Market," which aids in identifying and referencing the specific market segment covered.
12. How do I determine which pricing option suits my needs best?
The pricing options vary based on user requirements and access needs. Individual users may opt for single-user licenses, while businesses requiring broader access may choose multi-user or enterprise licenses for cost-effective access to the report.
13. Are there any additional resources or data provided in the Deployable Military Shelters Market report?
While the report offers comprehensive insights, it's advisable to review the specific contents or supplementary materials provided to ascertain if additional resources or data are available.
14. How can I stay updated on further developments or reports in the Deployable Military Shelters Market?
To stay informed about further developments, trends, and reports in the Deployable Military Shelters Market, consider subscribing to industry newsletters, following relevant companies and organizations, or regularly checking reputable industry news sources and publications.
Methodology
Step 1 - Identification of Relevant Samples Size from Population Database


Step 2 - Approaches for Defining Global Market Size (Value, Volume* & Price*)

Note*: In applicable scenarios
Step 3 - Data Sources
Primary Research
- Web Analytics
- Survey Reports
- Research Institute
- Latest Research Reports
- Opinion Leaders
Secondary Research
- Annual Reports
- White Paper
- Latest Press Release
- Industry Association
- Paid Database
- Investor Presentations

Step 4 - Data Triangulation
Involves using different sources of information in order to increase the validity of a study
These sources are likely to be stakeholders in a program - participants, other researchers, program staff, other community members, and so on.
Then we put all data in single framework & apply various statistical tools to find out the dynamic on the market.
During the analysis stage, feedback from the stakeholder groups would be compared to determine areas of agreement as well as areas of divergence