

Key Insights
The Digital Oil Fields market is poised for significant expansion, driven by the imperative for enhanced oil and gas recovery, optimized operational efficiency, and a reduced environmental impact. This sector is projected to achieve a Compound Annual Growth Rate (CAGR) of 5.69%, reaching a market size of 31.18 billion by the base year of 2025. The adoption of advanced technologies, including IoT sensors, cloud computing, big data analytics, and artificial intelligence (AI), is central to this growth, enabling real-time monitoring, predictive maintenance, improved reservoir management, and optimized production processes. These digital solutions translate directly to substantial cost savings and increased profitability. Furthermore, evolving environmental regulations are accelerating the demand for digitalization to ensure better resource management and a minimized ecological footprint. The market segments into reservoir optimization, production optimization, and drilling optimization, with reservoir optimization currently leading due to its critical role in maximizing resource extraction and the significant benefits offered by digital solutions. Key industry players such as Rockwell Automation, Honeywell, Accenture, IBM, and Schlumberger are actively investing in research and development and forging strategic alliances to leverage this market opportunity. Geographically, North America and the Asia-Pacific region are expected to lead market dominance, owing to their extensive oil and gas production activities and high rates of technological integration.
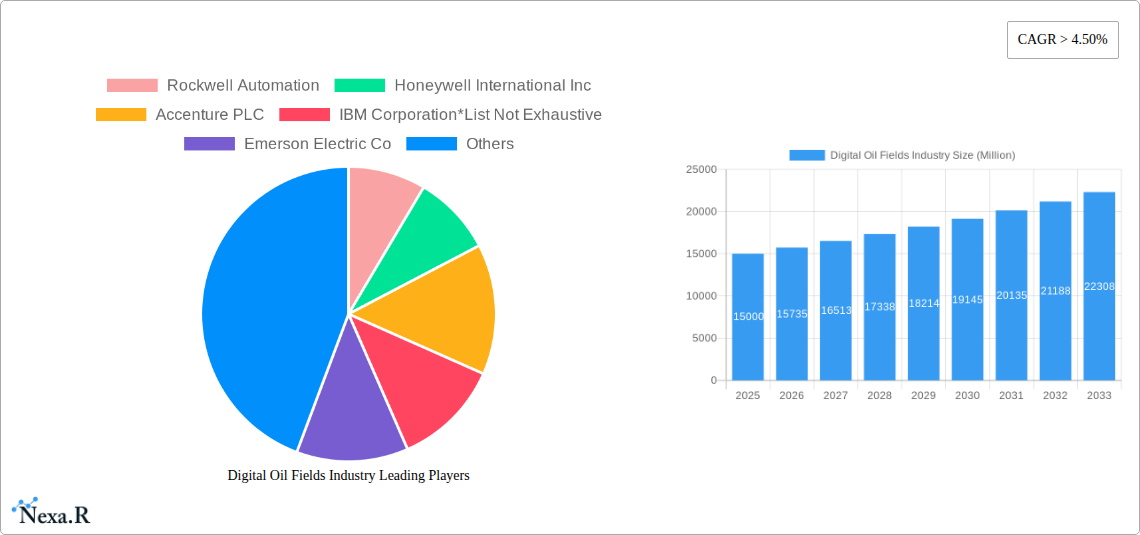
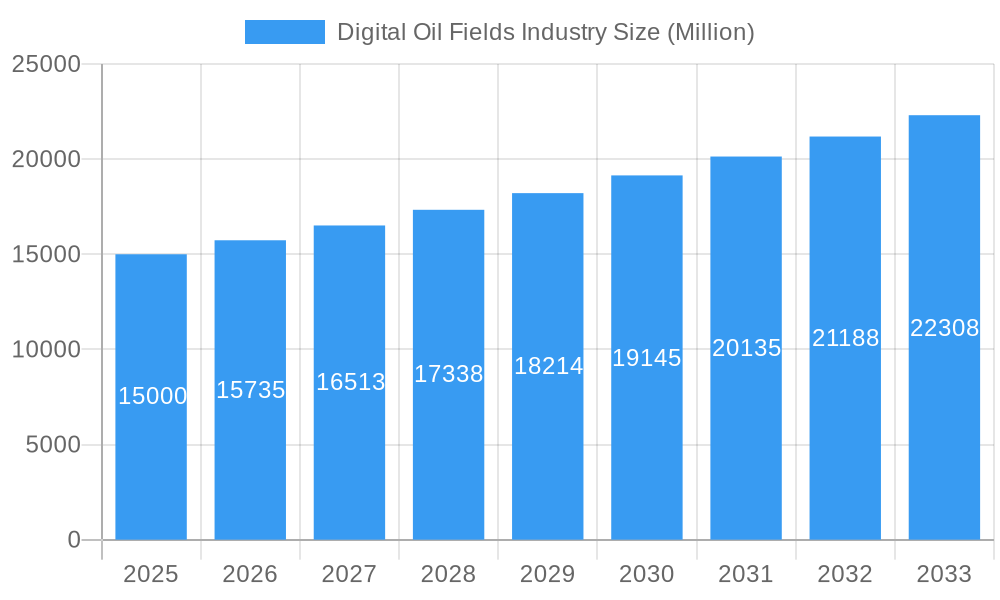
Digital Oil Fields Industry Market Size (In Billion)
While considerable growth opportunities exist, the Digital Oil Fields market faces challenges such as high initial investment costs, which can impede adoption by smaller enterprises. Cybersecurity vulnerabilities and the demand for a skilled workforce capable of managing and analyzing large data volumes are also critical concerns. The integration of existing legacy systems with new digital technologies presents an ongoing hurdle. Nevertheless, these challenges are being proactively addressed through the development of more accessible and user-friendly solutions, enhanced industry collaboration, and the expansion of specialized training initiatives. The long-term forecast for the Digital Oil Fields market is exceptionally positive, with continuous technological advancements and increasing industry-wide adoption expected to sustain robust growth throughout the forecast period. The market is anticipated to experience substantial expansion across all segments and regions, propelled by the industry's unwavering commitment to enhancing efficiency, sustainability, and profitability.
Digital Oil Fields Industry Company Market Share
Digital Oil Fields Industry Market Report: 2019-2033
This comprehensive report provides an in-depth analysis of the Digital Oil Fields industry, encompassing market dynamics, growth trends, regional segmentation, product landscape, key players, and future outlook. The study period covers 2019-2033, with 2025 serving as the base and estimated year. The forecast period is 2025-2033, and the historical period is 2019-2024. The report leverages extensive primary and secondary research to deliver actionable insights for industry professionals, investors, and strategic decision-makers. The market is segmented by Type of Process: Reservoir Optimization, Production Optimization, Drilling Optimization, and Other Process Types. Key players include Rockwell Automation, Honeywell International Inc, Accenture PLC, IBM Corporation, Emerson Electric Co, Weatherford International PLC, Siemens Energy AG, Baker Hughes Company, Kongsberg Gruppen AS, Halliburton Company, Schlumberger Limited, and Pason Systems Inc. (List not exhaustive). The total market size in 2025 is estimated at xx Million.
Digital Oil Fields Industry Market Dynamics & Structure
The Digital Oil Fields market is characterized by moderate concentration, with a few major players holding significant market share. However, technological advancements and the entry of new players are gradually increasing competition. The market is driven by increasing demand for enhanced oil and gas recovery, operational efficiency improvements, and reduced environmental impact. Stringent regulatory frameworks regarding emissions and safety standards are also shaping market dynamics. Mergers and acquisitions (M&A) activity is relatively high, reflecting the consolidation trend within the industry. Innovation is a key driver, but high initial investment costs and the complexity of integrating new technologies present significant barriers.
- Market Concentration: Moderately concentrated, with top 5 players holding approximately xx% of the market share in 2025.
- Technological Innovation Drivers: AI, Machine Learning, IoT, Cloud Computing, Big Data Analytics.
- Regulatory Frameworks: Emphasis on safety, environmental compliance, and data security.
- Competitive Product Substitutes: Traditional methods of oil and gas extraction.
- End-User Demographics: Major oil and gas companies, independent producers, and service providers.
- M&A Trends: Significant M&A activity observed in the past 5 years, with an estimated xx deals valued at xx Million in the historical period.
Digital Oil Fields Industry Growth Trends & Insights
The Digital Oil Fields market is experiencing robust growth, driven by increasing adoption of digital technologies across the oil and gas value chain. The market size witnessed significant expansion from xx Million in 2019 to an estimated xx Million in 2025. This growth is primarily attributed to the rising need for improved operational efficiency, enhanced production optimization, and cost reduction. The adoption of digital solutions is accelerating, with a projected Compound Annual Growth Rate (CAGR) of xx% from 2025 to 2033. Technological disruptions, such as the increasing use of AI and machine learning, are further driving market growth and influencing consumer behavior towards more data-driven decision-making. Market penetration is projected to reach xx% by 2033, signifying significant growth potential.
Dominant Regions, Countries, or Segments in Digital Oil Fields Industry
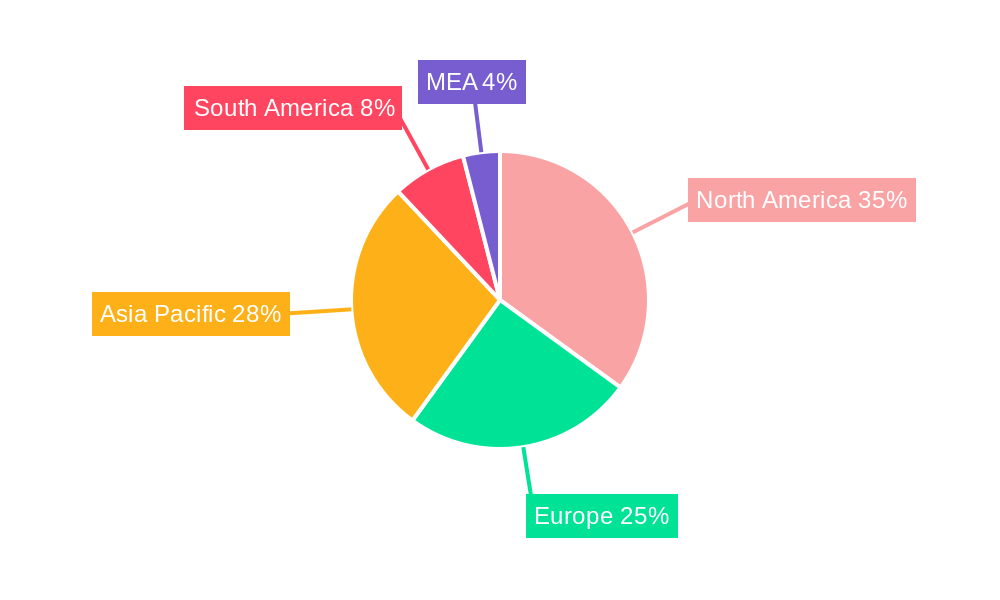
North America currently holds the largest market share in the Digital Oil Fields industry, driven by significant investments in digital technologies and a large number of operating oil and gas fields. However, the Asia-Pacific region is expected to witness the fastest growth rate over the forecast period, fueled by increasing exploration and production activities in developing economies.
Within segment types, Production Optimization is the dominant segment, accounting for xx% of the market in 2025, followed by Reservoir Optimization (xx%) and Drilling Optimization (xx%). The robust growth is driven by:
- North America: High adoption rate, established infrastructure, government support, and presence of major players.
- Asia-Pacific: Rapid economic growth, increasing investments in upstream & downstream activities, high potential for market expansion.
- Europe: Growing awareness of sustainable practices, stringent environmental regulations, focus on improved efficiency.
- Production Optimization: Focus on maximizing production yield and reducing operational costs.
- Reservoir Optimization: Improving reservoir management through advanced analytics & modeling.
Digital Oil Fields Industry Product Landscape
The Digital Oil Fields product landscape is characterized by a diverse range of solutions, including advanced sensors, data analytics platforms, cloud-based software, and automation systems. These solutions offer enhanced real-time monitoring, predictive maintenance capabilities, and improved decision-making through data-driven insights. Product innovations focus on improved data integration, enhanced user interfaces, and the incorporation of cutting-edge technologies like AI and machine learning. The focus is shifting towards comprehensive, integrated solutions that cater to the entire oil and gas production value chain.
Key Drivers, Barriers & Challenges in Digital Oil Fields Industry
Key Drivers:
- Increasing demand for improved operational efficiency and cost reduction.
- Advancements in digital technologies such as AI, ML, IoT, and cloud computing.
- Government initiatives promoting the adoption of digital technologies in the oil and gas sector.
Challenges & Restraints:
- High initial investment costs associated with implementing digital technologies.
- Cybersecurity risks and data privacy concerns.
- Lack of skilled workforce and expertise to manage and maintain complex digital systems.
- Integration challenges with legacy systems.
Emerging Opportunities in Digital Oil Fields Industry
- Expansion into untapped markets in developing economies.
- Development of integrated solutions that cater to the entire oil and gas value chain.
- Growing demand for predictive maintenance and anomaly detection solutions.
- Application of digital technologies in unconventional oil and gas resources.
Growth Accelerators in the Digital Oil Fields Industry
Strategic partnerships between oil and gas companies, technology providers, and service companies are driving significant innovation and market growth. Technological breakthroughs, particularly in AI and machine learning, are enabling more sophisticated data analysis and predictive capabilities, further enhancing operational efficiency. Market expansion into emerging economies, coupled with a growing focus on sustainability and reduced environmental impact, is also significantly bolstering market growth.
Key Players Shaping the Digital Oil Fields Industry Market
- Rockwell Automation
- Honeywell International Inc
- Accenture PLC
- IBM Corporation
- Emerson Electric Co
- Weatherford International PLC
- Siemens Energy AG
- Baker Hughes Company
- Kongsberg Gruppen AS
- Halliburton Company
- Schlumberger Limited
- Pason Systems Inc
Notable Milestones in Digital Oil Fields Industry Sector
- 2020-Q3: Schlumberger launches a new AI-powered drilling optimization platform.
- 2021-Q1: Baker Hughes and Microsoft announce a partnership to develop cloud-based digital solutions for the oil and gas industry.
- 2022-Q4: Several major oil companies invest heavily in digital transformation projects.
In-Depth Digital Oil Fields Industry Market Outlook
The Digital Oil Fields market is poised for continued robust growth, driven by technological advancements, strategic partnerships, and increasing demand for operational efficiency. The market’s future potential is significant, with substantial opportunities for both established players and emerging companies. Strategic investments in R&D, coupled with a focus on data-driven decision-making, are crucial for success in this rapidly evolving market. The potential for new applications and innovations in AI, machine learning, and other advanced technologies promises to further transform the oil and gas industry over the next decade.
Digital Oil Fields Industry Segmentation
-
1. Type of Process
- 1.1. Reservoir Optimization
- 1.2. Production Optimization
- 1.3. Drilling Optimization
- 1.4. Other Process Types
Digital Oil Fields Industry Segmentation By Geography
- 1. North America
- 2. Europe
- 3. Asia Pacific
- 4. South America
- 5. Middle East and Africa
Digital Oil Fields Industry Regional Market Share
Geographic Coverage of Digital Oil Fields Industry
Digital Oil Fields Industry REPORT HIGHLIGHTS
| Aspects | Details |
|---|---|
| Study Period | 2020-2034 |
| Base Year | 2025 |
| Estimated Year | 2026 |
| Forecast Period | 2026-2034 |
| Historical Period | 2020-2025 |
| Growth Rate | CAGR of 5.69% from 2020-2034 |
| Segmentation |
|
Table of Contents
- 1. Introduction
- 1.1. Research Scope
- 1.2. Market Segmentation
- 1.3. Research Objective
- 1.4. Definitions and Assumptions
- 2. Executive Summary
- 2.1. Market Snapshot
- 3. Market Dynamics
- 3.1. Market Drivers
- 3.2. Market Restrains
- 3.3. Market Trends
- 3.4. Market Opportunities
- 4. Market Factor Analysis
- 4.1. Porters Five Forces
- 4.1.1. Bargaining Power of Suppliers
- 4.1.2. Bargaining Power of Buyers
- 4.1.3. Threat of New Entrants
- 4.1.4. Threat of Substitutes
- 4.1.5. Competitive Rivalry
- 4.2. PESTEL analysis
- 4.3. BCG Analysis
- 4.3.1. Stars (High Growth, High Market Share)
- 4.3.2. Cash Cows (Low Growth, High Market Share)
- 4.3.3. Question Mark (High Growth, Low Market Share)
- 4.3.4. Dogs (Low Growth, Low Market Share)
- 4.4. Ansoff Matrix Analysis
- 4.5. Supply Chain Analysis
- 4.6. Regulatory Landscape
- 4.7. Current Market Potential and Opportunity Assessment (TAM–SAM–SOM Framework)
- 4.8. NRP Analyst Note
- 4.1. Porters Five Forces
- 5. Market Analysis, Insights and Forecast 2021-2033
- 5.1. Market Analysis, Insights and Forecast - by Type of Process
- 5.1.1. Reservoir Optimization
- 5.1.2. Production Optimization
- 5.1.3. Drilling Optimization
- 5.1.4. Other Process Types
- 5.2. Market Analysis, Insights and Forecast - by Region
- 5.2.1. North America
- 5.2.2. Europe
- 5.2.3. Asia Pacific
- 5.2.4. South America
- 5.2.5. Middle East and Africa
- 5.1. Market Analysis, Insights and Forecast - by Type of Process
- 6. Global Digital Oil Fields Industry Analysis, Insights and Forecast, 2021-2033
- 6.1. Market Analysis, Insights and Forecast - by Type of Process
- 6.1.1. Reservoir Optimization
- 6.1.2. Production Optimization
- 6.1.3. Drilling Optimization
- 6.1.4. Other Process Types
- 6.1. Market Analysis, Insights and Forecast - by Type of Process
- 7. North America Digital Oil Fields Industry Analysis, Insights and Forecast, 2020-2032
- 7.1. Market Analysis, Insights and Forecast - by Type of Process
- 7.1.1. Reservoir Optimization
- 7.1.2. Production Optimization
- 7.1.3. Drilling Optimization
- 7.1.4. Other Process Types
- 7.1. Market Analysis, Insights and Forecast - by Type of Process
- 8. Europe Digital Oil Fields Industry Analysis, Insights and Forecast, 2020-2032
- 8.1. Market Analysis, Insights and Forecast - by Type of Process
- 8.1.1. Reservoir Optimization
- 8.1.2. Production Optimization
- 8.1.3. Drilling Optimization
- 8.1.4. Other Process Types
- 8.1. Market Analysis, Insights and Forecast - by Type of Process
- 9. Asia Pacific Digital Oil Fields Industry Analysis, Insights and Forecast, 2020-2032
- 9.1. Market Analysis, Insights and Forecast - by Type of Process
- 9.1.1. Reservoir Optimization
- 9.1.2. Production Optimization
- 9.1.3. Drilling Optimization
- 9.1.4. Other Process Types
- 9.1. Market Analysis, Insights and Forecast - by Type of Process
- 10. South America Digital Oil Fields Industry Analysis, Insights and Forecast, 2020-2032
- 10.1. Market Analysis, Insights and Forecast - by Type of Process
- 10.1.1. Reservoir Optimization
- 10.1.2. Production Optimization
- 10.1.3. Drilling Optimization
- 10.1.4. Other Process Types
- 10.1. Market Analysis, Insights and Forecast - by Type of Process
- 11. Middle East and Africa Digital Oil Fields Industry Analysis, Insights and Forecast, 2020-2032
- 11.1. Market Analysis, Insights and Forecast - by Type of Process
- 11.1.1. Reservoir Optimization
- 11.1.2. Production Optimization
- 11.1.3. Drilling Optimization
- 11.1.4. Other Process Types
- 11.1. Market Analysis, Insights and Forecast - by Type of Process
- 12. Competitive Analysis
- 12.1. Company Profiles
- 12.1.1 Rockwell Automation
- 12.1.1.1. Company Overview
- 12.1.1.2. Products
- 12.1.1.3. Company Financials
- 12.1.1.4. SWOT Analysis
- 12.1.2 Honeywell International Inc
- 12.1.2.1. Company Overview
- 12.1.2.2. Products
- 12.1.2.3. Company Financials
- 12.1.2.4. SWOT Analysis
- 12.1.3 Accenture PLC
- 12.1.3.1. Company Overview
- 12.1.3.2. Products
- 12.1.3.3. Company Financials
- 12.1.3.4. SWOT Analysis
- 12.1.4 IBM Corporation*List Not Exhaustive
- 12.1.4.1. Company Overview
- 12.1.4.2. Products
- 12.1.4.3. Company Financials
- 12.1.4.4. SWOT Analysis
- 12.1.5 Emerson Electric Co
- 12.1.5.1. Company Overview
- 12.1.5.2. Products
- 12.1.5.3. Company Financials
- 12.1.5.4. SWOT Analysis
- 12.1.6 Weatherford International PLC
- 12.1.6.1. Company Overview
- 12.1.6.2. Products
- 12.1.6.3. Company Financials
- 12.1.6.4. SWOT Analysis
- 12.1.7 Siemens Energy AG
- 12.1.7.1. Company Overview
- 12.1.7.2. Products
- 12.1.7.3. Company Financials
- 12.1.7.4. SWOT Analysis
- 12.1.8 Baker Hughes Company
- 12.1.8.1. Company Overview
- 12.1.8.2. Products
- 12.1.8.3. Company Financials
- 12.1.8.4. SWOT Analysis
- 12.1.9 Kongsberg Gruppen AS
- 12.1.9.1. Company Overview
- 12.1.9.2. Products
- 12.1.9.3. Company Financials
- 12.1.9.4. SWOT Analysis
- 12.1.10 Halliburton Company
- 12.1.10.1. Company Overview
- 12.1.10.2. Products
- 12.1.10.3. Company Financials
- 12.1.10.4. SWOT Analysis
- 12.1.11 Schlumberger Limited
- 12.1.11.1. Company Overview
- 12.1.11.2. Products
- 12.1.11.3. Company Financials
- 12.1.11.4. SWOT Analysis
- 12.1.12 Pason Systems Inc
- 12.1.12.1. Company Overview
- 12.1.12.2. Products
- 12.1.12.3. Company Financials
- 12.1.12.4. SWOT Analysis
- 12.1.1 Rockwell Automation
- 12.2. Market Entropy
- 12.2.1 Company's Key Areas Served
- 12.2.2 Recent Developments
- 12.3. Company Market Share Analysis 2025
- 12.3.1 Top 5 Companies Market Share Analysis
- 12.3.2 Top 3 Companies Market Share Analysis
- 12.4. List of Potential Customers
- 13. Research Methodology
List of Figures
- Figure 1: Global Digital Oil Fields Industry Revenue Breakdown (billion, %) by Region 2025 & 2033
- Figure 2: North America Digital Oil Fields Industry Revenue (billion), by Type of Process 2025 & 2033
- Figure 3: North America Digital Oil Fields Industry Revenue Share (%), by Type of Process 2025 & 2033
- Figure 4: North America Digital Oil Fields Industry Revenue (billion), by Country 2025 & 2033
- Figure 5: North America Digital Oil Fields Industry Revenue Share (%), by Country 2025 & 2033
- Figure 6: Europe Digital Oil Fields Industry Revenue (billion), by Type of Process 2025 & 2033
- Figure 7: Europe Digital Oil Fields Industry Revenue Share (%), by Type of Process 2025 & 2033
- Figure 8: Europe Digital Oil Fields Industry Revenue (billion), by Country 2025 & 2033
- Figure 9: Europe Digital Oil Fields Industry Revenue Share (%), by Country 2025 & 2033
- Figure 10: Asia Pacific Digital Oil Fields Industry Revenue (billion), by Type of Process 2025 & 2033
- Figure 11: Asia Pacific Digital Oil Fields Industry Revenue Share (%), by Type of Process 2025 & 2033
- Figure 12: Asia Pacific Digital Oil Fields Industry Revenue (billion), by Country 2025 & 2033
- Figure 13: Asia Pacific Digital Oil Fields Industry Revenue Share (%), by Country 2025 & 2033
- Figure 14: South America Digital Oil Fields Industry Revenue (billion), by Type of Process 2025 & 2033
- Figure 15: South America Digital Oil Fields Industry Revenue Share (%), by Type of Process 2025 & 2033
- Figure 16: South America Digital Oil Fields Industry Revenue (billion), by Country 2025 & 2033
- Figure 17: South America Digital Oil Fields Industry Revenue Share (%), by Country 2025 & 2033
- Figure 18: Middle East and Africa Digital Oil Fields Industry Revenue (billion), by Type of Process 2025 & 2033
- Figure 19: Middle East and Africa Digital Oil Fields Industry Revenue Share (%), by Type of Process 2025 & 2033
- Figure 20: Middle East and Africa Digital Oil Fields Industry Revenue (billion), by Country 2025 & 2033
- Figure 21: Middle East and Africa Digital Oil Fields Industry Revenue Share (%), by Country 2025 & 2033
List of Tables
- Table 1: Global Digital Oil Fields Industry Revenue billion Forecast, by Type of Process 2020 & 2033
- Table 2: Global Digital Oil Fields Industry Revenue billion Forecast, by Region 2020 & 2033
- Table 3: Global Digital Oil Fields Industry Revenue billion Forecast, by Type of Process 2020 & 2033
- Table 4: Global Digital Oil Fields Industry Revenue billion Forecast, by Country 2020 & 2033
- Table 5: Global Digital Oil Fields Industry Revenue billion Forecast, by Type of Process 2020 & 2033
- Table 6: Global Digital Oil Fields Industry Revenue billion Forecast, by Country 2020 & 2033
- Table 7: Global Digital Oil Fields Industry Revenue billion Forecast, by Type of Process 2020 & 2033
- Table 8: Global Digital Oil Fields Industry Revenue billion Forecast, by Country 2020 & 2033
- Table 9: Global Digital Oil Fields Industry Revenue billion Forecast, by Type of Process 2020 & 2033
- Table 10: Global Digital Oil Fields Industry Revenue billion Forecast, by Country 2020 & 2033
- Table 11: Global Digital Oil Fields Industry Revenue billion Forecast, by Type of Process 2020 & 2033
- Table 12: Global Digital Oil Fields Industry Revenue billion Forecast, by Country 2020 & 2033
Frequently Asked Questions
1. What is the projected Compound Annual Growth Rate (CAGR) of the Digital Oil Fields Industry?
The projected CAGR is approximately 5.69%.
2. Which companies are prominent players in the Digital Oil Fields Industry?
Key companies in the market include Rockwell Automation, Honeywell International Inc, Accenture PLC, IBM Corporation*List Not Exhaustive, Emerson Electric Co, Weatherford International PLC, Siemens Energy AG, Baker Hughes Company, Kongsberg Gruppen AS, Halliburton Company, Schlumberger Limited, Pason Systems Inc.
3. What are the main segments of the Digital Oil Fields Industry?
The market segments include Type of Process.
4. Can you provide details about the market size?
The market size is estimated to be USD 31.18 billion as of 2022.
5. What are some drivers contributing to market growth?
4.; Growing demand for natural gas and developing gas infrastructure4.; Increasing offshore oil and Gas Exploration Activities.
6. What are the notable trends driving market growth?
Reservoir Optimization Segment to Dominate the Market.
7. Are there any restraints impacting market growth?
4.; Adoption of Cleaner Alternatives.
8. Can you provide examples of recent developments in the market?
N/A
9. What pricing options are available for accessing the report?
Pricing options include single-user, multi-user, and enterprise licenses priced at USD 4750, USD 5250, and USD 8750 respectively.
10. Is the market size provided in terms of value or volume?
The market size is provided in terms of value, measured in billion.
11. Are there any specific market keywords associated with the report?
Yes, the market keyword associated with the report is "Digital Oil Fields Industry," which aids in identifying and referencing the specific market segment covered.
12. How do I determine which pricing option suits my needs best?
The pricing options vary based on user requirements and access needs. Individual users may opt for single-user licenses, while businesses requiring broader access may choose multi-user or enterprise licenses for cost-effective access to the report.
13. Are there any additional resources or data provided in the Digital Oil Fields Industry report?
While the report offers comprehensive insights, it's advisable to review the specific contents or supplementary materials provided to ascertain if additional resources or data are available.
14. How can I stay updated on further developments or reports in the Digital Oil Fields Industry?
To stay informed about further developments, trends, and reports in the Digital Oil Fields Industry, consider subscribing to industry newsletters, following relevant companies and organizations, or regularly checking reputable industry news sources and publications.
Methodology
Step 1 - Identification of Relevant Samples Size from Population Database


Step 2 - Approaches for Defining Global Market Size (Value, Volume* & Price*)

Note*: In applicable scenarios
Step 3 - Data Sources
Primary Research
- Web Analytics
- Survey Reports
- Research Institute
- Latest Research Reports
- Opinion Leaders
Secondary Research
- Annual Reports
- White Paper
- Latest Press Release
- Industry Association
- Paid Database
- Investor Presentations

Step 4 - Data Triangulation
Involves using different sources of information in order to increase the validity of a study
These sources are likely to be stakeholders in a program - participants, other researchers, program staff, other community members, and so on.
Then we put all data in single framework & apply various statistical tools to find out the dynamic on the market.
During the analysis stage, feedback from the stakeholder groups would be compared to determine areas of agreement as well as areas of divergence