

Key Insights
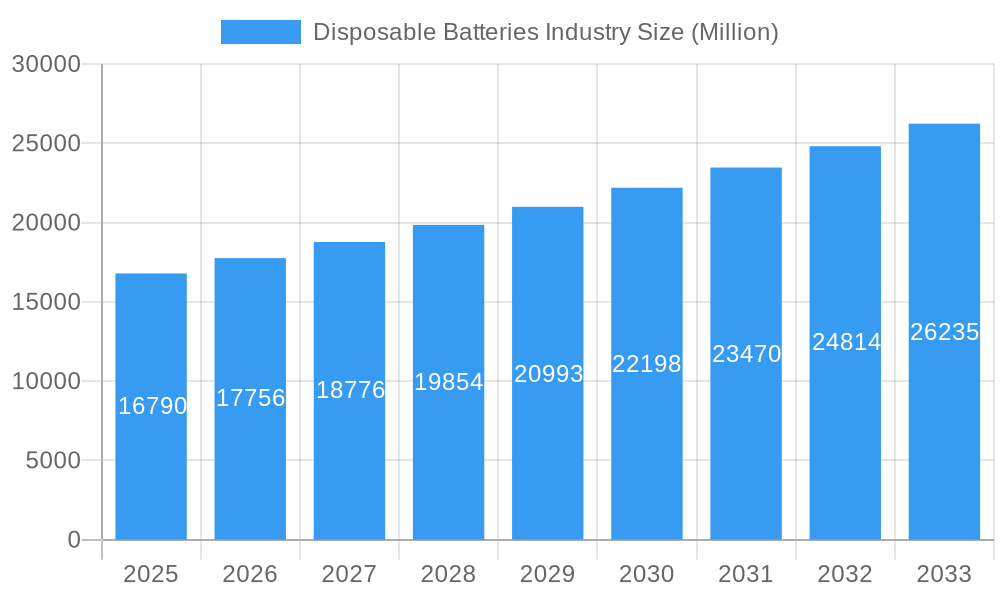
The disposable battery market, valued at $16.79 billion in 2025, is projected to experience robust growth, driven by increasing demand across diverse sectors. A Compound Annual Growth Rate (CAGR) of 5.62% from 2025 to 2033 indicates a significant expansion. This growth is fueled by the continued reliance on portable electronic devices in both consumer and industrial applications, despite the rise of rechargeable alternatives. Key drivers include the affordability and convenience of disposable batteries, particularly in low-power applications, and their suitability for situations requiring infrequent battery replacements. However, growing environmental concerns regarding battery waste and stricter regulations on hazardous materials are acting as restraints. Market segmentation reveals a dominance of primary alkaline and lithium batteries, reflecting their widespread use in various applications. Major players like Duracell, Energizer, and Panasonic are vying for market share through technological advancements, focusing on improved performance and longer lifespans. Geographical analysis suggests North America and Asia Pacific are currently the leading regional markets, driven by high consumption rates in countries like the United States and China, respectively. The market is expected to witness increased competition and innovation in the coming years, with a focus on developing more sustainable and environmentally friendly disposable battery alternatives. The long-term outlook remains positive, though the market's trajectory will be heavily influenced by evolving environmental regulations and the continued advancement of rechargeable battery technologies.
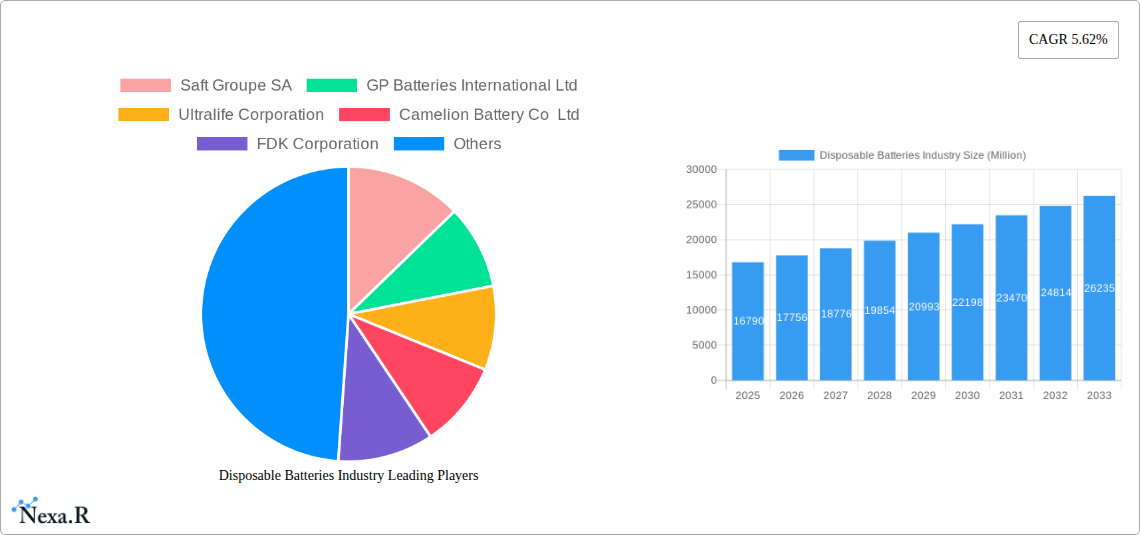
Disposable Batteries Industry Market Size (In Billion)
The competitive landscape is characterized by both established multinational corporations and regional players. Success in this market requires a balance of cost-effectiveness in manufacturing, technological innovation to improve battery performance and lifespan, and a commitment to sustainability to mitigate environmental concerns. Strategic partnerships and acquisitions will likely become increasingly important for companies to gain access to new technologies and expand their market reach. The growing demand for disposable batteries in emerging economies, coupled with increasing urbanization and rising disposable incomes, presents significant growth opportunities. However, companies must navigate the challenges posed by fluctuating raw material prices, evolving consumer preferences, and increasing pressure to adopt more sustainable manufacturing processes. Therefore, a comprehensive strategy encompassing product diversification, efficient supply chain management, and a commitment to environmentally responsible practices is crucial for long-term success in this dynamic market.
Disposable Batteries Industry Company Market Share
Disposable Batteries Industry Market Report: 2019-2033
This comprehensive report provides an in-depth analysis of the global disposable batteries market, encompassing market dynamics, growth trends, regional segmentation, product landscape, key players, and future outlook. The study period covers 2019-2033, with 2025 as the base and estimated year. The report caters to industry professionals, investors, and researchers seeking a comprehensive understanding of this crucial sector. Market values are presented in million units.
Disposable Batteries Industry Market Dynamics & Structure
The disposable battery market, encompassing primary alkaline, primary lithium, and other types, is characterized by moderate concentration, with key players like Duracell, Energizer, and Panasonic holding significant market share. Technological innovation, particularly in energy density and material science, is a primary growth driver. Stringent environmental regulations regarding battery waste management and increasing demand for eco-friendly alternatives are reshaping the industry landscape. The market also faces competition from rechargeable battery technologies. Mergers and acquisitions (M&A) activity has been relatively low in recent years (xx deals in the past 5 years), reflecting a period of consolidation rather than significant expansion. Key dynamics include:
- Market Concentration: Moderately concentrated, with top 5 players holding approximately xx% market share in 2024.
- Technological Innovation: Focus on enhanced energy density, improved safety features, and environmentally friendly materials.
- Regulatory Framework: Increasingly stringent regulations on battery waste disposal and environmental impact are driving innovation in sustainable battery technologies.
- Competitive Substitutes: Rechargeable batteries and alternative power sources pose a significant competitive challenge.
- End-User Demographics: Driven by diverse applications across consumer electronics, industrial devices, and medical equipment.
- M&A Trends: Relatively low M&A activity in recent years (xx deals), indicating consolidation and focus on organic growth.
Disposable Batteries Industry Growth Trends & Insights
The disposable battery market experienced steady growth from 2019 to 2024, reaching xx million units in 2024. The compound annual growth rate (CAGR) during this period was xx%. Market penetration is high in developed economies, with growth primarily driven by emerging markets. Technological advancements, such as improved energy density and extended shelf life, have contributed significantly to growth. However, increasing consumer awareness of environmental concerns and the rise of rechargeable battery alternatives are influencing adoption rates. Consumer behavior is shifting towards more sustainable and eco-friendly options. Market projections for 2025-2033 indicate continued growth, albeit at a moderated pace, reaching an estimated xx million units by 2033, with a projected CAGR of xx%. Factors like fluctuating raw material prices and supply chain disruptions will influence growth trajectories.
Dominant Regions, Countries, or Segments in Disposable Batteries Industry
The Asia-Pacific region currently dominates the disposable battery market, accounting for approximately xx% of global market share in 2024, driven by strong demand from populous countries like China and India. Within the product segments, Primary Alkaline Batteries hold the largest market share (xx%), followed by Primary Lithium Batteries (xx%) and Other Types (xx%).
- Key Drivers in Asia-Pacific: Rapid economic growth, rising disposable incomes, and increasing demand for consumer electronics.
- Primary Alkaline Battery Dominance: Cost-effectiveness and wide availability make them the dominant type.
- Primary Lithium Battery Growth: Driven by demand from specialized applications such as medical devices and industrial tools.
- Other Types: Niche applications such as specialized industrial devices contribute to this segment's growth.
Disposable Batteries Industry Product Landscape
The disposable battery market offers a diverse range of products, categorized by chemistry (alkaline, lithium, etc.) and size/form factor. Recent innovations focus on enhanced energy density, improved safety features, and extended shelf life. Unique selling propositions often highlight specific applications (e.g., high-performance lithium batteries for medical implants) or environmental considerations (e.g., reduced environmental impact). Technological advancements include the incorporation of novel electrode materials and improved manufacturing processes.
Key Drivers, Barriers & Challenges in Disposable Batteries Industry
Key Drivers:
- Growing demand for portable electronic devices.
- Increasing use of disposable batteries in various industrial and medical applications.
- Technological advancements in battery chemistry leading to enhanced performance.
Key Challenges:
- Environmental concerns associated with battery waste disposal.
- Competition from rechargeable batteries and alternative power sources.
- Fluctuations in raw material prices.
- Stringent regulatory requirements on battery safety and environmental impact.
Emerging Opportunities in Disposable Batteries Industry
- Growing demand for high-energy-density batteries in emerging applications, such as electric vehicles and energy storage systems.
- Development of eco-friendly and biodegradable battery technologies to address environmental concerns.
- Expansion into untapped markets in developing economies with increasing demand for portable electronic devices.
Growth Accelerators in the Disposable Batteries Industry Industry
Technological breakthroughs in battery materials and manufacturing processes are driving long-term growth. Strategic partnerships between battery manufacturers and original equipment manufacturers (OEMs) are accelerating market expansion. Focus on sustainability and the development of eco-friendly battery technologies are creating new growth opportunities.
Key Players Shaping the Disposable Batteries Industry Market
- Saft Groupe SA
- GP Batteries International Ltd
- Ultralife Corporation
- Camelion Battery Co Ltd
- FDK Corporation
- Toshiba Corporation
- Duracell Inc
- Energizer Holdings Inc
- Panasonic Corporation
Notable Milestones in Disposable Batteries Industry Sector
- September 2023: Technology Development Board (TDB) partners with Aloe Ecell Pvt Ltd to promote sustainable battery technologies under 'Mission LiFE'.
- November 2022: MIT researchers invent new materials for primary batteries, potentially increasing energy density by up to 50%.
- March 2022: FDK Corporation consolidates its high-capacity cylindrical-type primary lithium battery production.
In-Depth Disposable Batteries Industry Market Outlook
The disposable battery market is poised for continued growth, albeit at a moderate pace, driven by persistent demand from consumer electronics and specialized applications. Strategic investments in research and development, focusing on enhanced performance, improved safety, and environmental sustainability, will shape the future of this market. Opportunities lie in developing eco-friendly battery technologies and expanding into new, high-growth markets.
Disposable Batteries Industry Segmentation
-
1. Type
- 1.1. Primary Alkaline Battery
- 1.2. Primary Lithium Battery
- 1.3. Other Types
Disposable Batteries Industry Segmentation By Geography
-
1. North America
- 1.1. United States
- 1.2. Canada
- 1.3. Rest of North America
-
2. Europe
- 2.1. Germany
- 2.2. France
- 2.3. United Kingdom
- 2.4. Russia
- 2.5. Rest of Europe
-
3. Asia Pacific
- 3.1. China
- 3.2. Japan
- 3.3. Thailand
- 3.4. Indonesia
- 3.5. Malaysia
- 3.6. India
- 3.7. Rest of Asia Pacific
-
4. South America
- 4.1. Brazil
- 4.2. Argentina
- 4.3. Rest of South America
-
5. Middle East and Africa
- 5.1. Saudi Arabia
- 5.2. United Arab Emirates
- 5.3. South Africa
- 5.4. Rest of Middle East and Africa
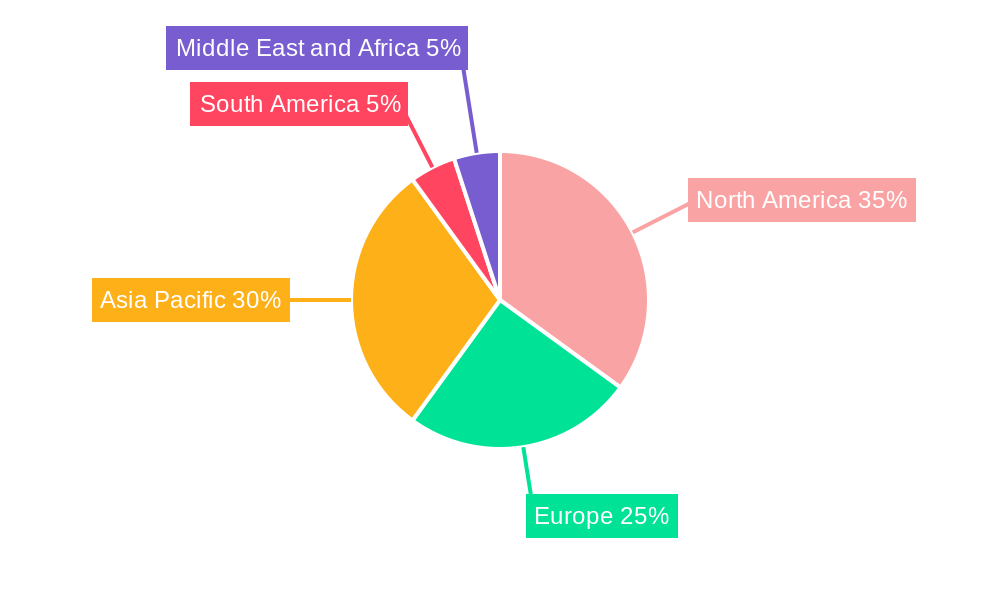
Disposable Batteries Industry Regional Market Share
Geographic Coverage of Disposable Batteries Industry
Disposable Batteries Industry REPORT HIGHLIGHTS
| Aspects | Details |
|---|---|
| Study Period | 2020-2034 |
| Base Year | 2025 |
| Estimated Year | 2026 |
| Forecast Period | 2026-2034 |
| Historical Period | 2020-2025 |
| Growth Rate | CAGR of 5.62% from 2020-2034 |
| Segmentation |
|
Table of Contents
- 1. Introduction
- 1.1. Research Scope
- 1.2. Market Segmentation
- 1.3. Research Objective
- 1.4. Definitions and Assumptions
- 2. Executive Summary
- 2.1. Market Snapshot
- 3. Market Dynamics
- 3.1. Market Drivers
- 3.2. Market Restrains
- 3.3. Market Trends
- 3.4. Market Opportunities
- 4. Market Factor Analysis
- 4.1. Porters Five Forces
- 4.1.1. Bargaining Power of Suppliers
- 4.1.2. Bargaining Power of Buyers
- 4.1.3. Threat of New Entrants
- 4.1.4. Threat of Substitutes
- 4.1.5. Competitive Rivalry
- 4.2. PESTEL analysis
- 4.3. BCG Analysis
- 4.3.1. Stars (High Growth, High Market Share)
- 4.3.2. Cash Cows (Low Growth, High Market Share)
- 4.3.3. Question Mark (High Growth, Low Market Share)
- 4.3.4. Dogs (Low Growth, Low Market Share)
- 4.4. Ansoff Matrix Analysis
- 4.5. Supply Chain Analysis
- 4.6. Regulatory Landscape
- 4.7. Current Market Potential and Opportunity Assessment (TAM–SAM–SOM Framework)
- 4.8. NRP Analyst Note
- 4.1. Porters Five Forces
- 5. Market Analysis, Insights and Forecast 2021-2033
- 5.1. Market Analysis, Insights and Forecast - by Type
- 5.1.1. Primary Alkaline Battery
- 5.1.2. Primary Lithium Battery
- 5.1.3. Other Types
- 5.2. Market Analysis, Insights and Forecast - by Region
- 5.2.1. North America
- 5.2.2. Europe
- 5.2.3. Asia Pacific
- 5.2.4. South America
- 5.2.5. Middle East and Africa
- 5.1. Market Analysis, Insights and Forecast - by Type
- 6. Global Disposable Batteries Industry Analysis, Insights and Forecast, 2021-2033
- 6.1. Market Analysis, Insights and Forecast - by Type
- 6.1.1. Primary Alkaline Battery
- 6.1.2. Primary Lithium Battery
- 6.1.3. Other Types
- 6.1. Market Analysis, Insights and Forecast - by Type
- 7. North America Disposable Batteries Industry Analysis, Insights and Forecast, 2020-2032
- 7.1. Market Analysis, Insights and Forecast - by Type
- 7.1.1. Primary Alkaline Battery
- 7.1.2. Primary Lithium Battery
- 7.1.3. Other Types
- 7.1. Market Analysis, Insights and Forecast - by Type
- 8. Europe Disposable Batteries Industry Analysis, Insights and Forecast, 2020-2032
- 8.1. Market Analysis, Insights and Forecast - by Type
- 8.1.1. Primary Alkaline Battery
- 8.1.2. Primary Lithium Battery
- 8.1.3. Other Types
- 8.1. Market Analysis, Insights and Forecast - by Type
- 9. Asia Pacific Disposable Batteries Industry Analysis, Insights and Forecast, 2020-2032
- 9.1. Market Analysis, Insights and Forecast - by Type
- 9.1.1. Primary Alkaline Battery
- 9.1.2. Primary Lithium Battery
- 9.1.3. Other Types
- 9.1. Market Analysis, Insights and Forecast - by Type
- 10. South America Disposable Batteries Industry Analysis, Insights and Forecast, 2020-2032
- 10.1. Market Analysis, Insights and Forecast - by Type
- 10.1.1. Primary Alkaline Battery
- 10.1.2. Primary Lithium Battery
- 10.1.3. Other Types
- 10.1. Market Analysis, Insights and Forecast - by Type
- 11. Middle East and Africa Disposable Batteries Industry Analysis, Insights and Forecast, 2020-2032
- 11.1. Market Analysis, Insights and Forecast - by Type
- 11.1.1. Primary Alkaline Battery
- 11.1.2. Primary Lithium Battery
- 11.1.3. Other Types
- 11.1. Market Analysis, Insights and Forecast - by Type
- 12. Competitive Analysis
- 12.1. Company Profiles
- 12.1.1 Saft Groupe SA
- 12.1.1.1. Company Overview
- 12.1.1.2. Products
- 12.1.1.3. Company Financials
- 12.1.1.4. SWOT Analysis
- 12.1.2 GP Batteries International Ltd
- 12.1.2.1. Company Overview
- 12.1.2.2. Products
- 12.1.2.3. Company Financials
- 12.1.2.4. SWOT Analysis
- 12.1.3 Ultralife Corporation
- 12.1.3.1. Company Overview
- 12.1.3.2. Products
- 12.1.3.3. Company Financials
- 12.1.3.4. SWOT Analysis
- 12.1.4 Camelion Battery Co Ltd
- 12.1.4.1. Company Overview
- 12.1.4.2. Products
- 12.1.4.3. Company Financials
- 12.1.4.4. SWOT Analysis
- 12.1.5 FDK Corporation
- 12.1.5.1. Company Overview
- 12.1.5.2. Products
- 12.1.5.3. Company Financials
- 12.1.5.4. SWOT Analysis
- 12.1.6 Toshiba Corporation*List Not Exhaustive
- 12.1.6.1. Company Overview
- 12.1.6.2. Products
- 12.1.6.3. Company Financials
- 12.1.6.4. SWOT Analysis
- 12.1.7 Duracell Inc
- 12.1.7.1. Company Overview
- 12.1.7.2. Products
- 12.1.7.3. Company Financials
- 12.1.7.4. SWOT Analysis
- 12.1.8 Energizer Holdings Inc
- 12.1.8.1. Company Overview
- 12.1.8.2. Products
- 12.1.8.3. Company Financials
- 12.1.8.4. SWOT Analysis
- 12.1.9 Panasonic Corporation
- 12.1.9.1. Company Overview
- 12.1.9.2. Products
- 12.1.9.3. Company Financials
- 12.1.9.4. SWOT Analysis
- 12.1.1 Saft Groupe SA
- 12.2. Market Entropy
- 12.2.1 Company's Key Areas Served
- 12.2.2 Recent Developments
- 12.3. Company Market Share Analysis 2025
- 12.3.1 Top 5 Companies Market Share Analysis
- 12.3.2 Top 3 Companies Market Share Analysis
- 12.4. List of Potential Customers
- 13. Research Methodology
List of Figures
- Figure 1: Global Disposable Batteries Industry Revenue Breakdown (Million, %) by Region 2025 & 2033
- Figure 2: Global Disposable Batteries Industry Volume Breakdown (Kiloton, %) by Region 2025 & 2033
- Figure 3: North America Disposable Batteries Industry Revenue (Million), by Type 2025 & 2033
- Figure 4: North America Disposable Batteries Industry Volume (Kiloton), by Type 2025 & 2033
- Figure 5: North America Disposable Batteries Industry Revenue Share (%), by Type 2025 & 2033
- Figure 6: North America Disposable Batteries Industry Volume Share (%), by Type 2025 & 2033
- Figure 7: North America Disposable Batteries Industry Revenue (Million), by Country 2025 & 2033
- Figure 8: North America Disposable Batteries Industry Volume (Kiloton), by Country 2025 & 2033
- Figure 9: North America Disposable Batteries Industry Revenue Share (%), by Country 2025 & 2033
- Figure 10: North America Disposable Batteries Industry Volume Share (%), by Country 2025 & 2033
- Figure 11: Europe Disposable Batteries Industry Revenue (Million), by Type 2025 & 2033
- Figure 12: Europe Disposable Batteries Industry Volume (Kiloton), by Type 2025 & 2033
- Figure 13: Europe Disposable Batteries Industry Revenue Share (%), by Type 2025 & 2033
- Figure 14: Europe Disposable Batteries Industry Volume Share (%), by Type 2025 & 2033
- Figure 15: Europe Disposable Batteries Industry Revenue (Million), by Country 2025 & 2033
- Figure 16: Europe Disposable Batteries Industry Volume (Kiloton), by Country 2025 & 2033
- Figure 17: Europe Disposable Batteries Industry Revenue Share (%), by Country 2025 & 2033
- Figure 18: Europe Disposable Batteries Industry Volume Share (%), by Country 2025 & 2033
- Figure 19: Asia Pacific Disposable Batteries Industry Revenue (Million), by Type 2025 & 2033
- Figure 20: Asia Pacific Disposable Batteries Industry Volume (Kiloton), by Type 2025 & 2033
- Figure 21: Asia Pacific Disposable Batteries Industry Revenue Share (%), by Type 2025 & 2033
- Figure 22: Asia Pacific Disposable Batteries Industry Volume Share (%), by Type 2025 & 2033
- Figure 23: Asia Pacific Disposable Batteries Industry Revenue (Million), by Country 2025 & 2033
- Figure 24: Asia Pacific Disposable Batteries Industry Volume (Kiloton), by Country 2025 & 2033
- Figure 25: Asia Pacific Disposable Batteries Industry Revenue Share (%), by Country 2025 & 2033
- Figure 26: Asia Pacific Disposable Batteries Industry Volume Share (%), by Country 2025 & 2033
- Figure 27: South America Disposable Batteries Industry Revenue (Million), by Type 2025 & 2033
- Figure 28: South America Disposable Batteries Industry Volume (Kiloton), by Type 2025 & 2033
- Figure 29: South America Disposable Batteries Industry Revenue Share (%), by Type 2025 & 2033
- Figure 30: South America Disposable Batteries Industry Volume Share (%), by Type 2025 & 2033
- Figure 31: South America Disposable Batteries Industry Revenue (Million), by Country 2025 & 2033
- Figure 32: South America Disposable Batteries Industry Volume (Kiloton), by Country 2025 & 2033
- Figure 33: South America Disposable Batteries Industry Revenue Share (%), by Country 2025 & 2033
- Figure 34: South America Disposable Batteries Industry Volume Share (%), by Country 2025 & 2033
- Figure 35: Middle East and Africa Disposable Batteries Industry Revenue (Million), by Type 2025 & 2033
- Figure 36: Middle East and Africa Disposable Batteries Industry Volume (Kiloton), by Type 2025 & 2033
- Figure 37: Middle East and Africa Disposable Batteries Industry Revenue Share (%), by Type 2025 & 2033
- Figure 38: Middle East and Africa Disposable Batteries Industry Volume Share (%), by Type 2025 & 2033
- Figure 39: Middle East and Africa Disposable Batteries Industry Revenue (Million), by Country 2025 & 2033
- Figure 40: Middle East and Africa Disposable Batteries Industry Volume (Kiloton), by Country 2025 & 2033
- Figure 41: Middle East and Africa Disposable Batteries Industry Revenue Share (%), by Country 2025 & 2033
- Figure 42: Middle East and Africa Disposable Batteries Industry Volume Share (%), by Country 2025 & 2033
List of Tables
- Table 1: Global Disposable Batteries Industry Revenue Million Forecast, by Type 2020 & 2033
- Table 2: Global Disposable Batteries Industry Volume Kiloton Forecast, by Type 2020 & 2033
- Table 3: Global Disposable Batteries Industry Revenue Million Forecast, by Region 2020 & 2033
- Table 4: Global Disposable Batteries Industry Volume Kiloton Forecast, by Region 2020 & 2033
- Table 5: Global Disposable Batteries Industry Revenue Million Forecast, by Type 2020 & 2033
- Table 6: Global Disposable Batteries Industry Volume Kiloton Forecast, by Type 2020 & 2033
- Table 7: Global Disposable Batteries Industry Revenue Million Forecast, by Country 2020 & 2033
- Table 8: Global Disposable Batteries Industry Volume Kiloton Forecast, by Country 2020 & 2033
- Table 9: United States Disposable Batteries Industry Revenue (Million) Forecast, by Application 2020 & 2033
- Table 10: United States Disposable Batteries Industry Volume (Kiloton) Forecast, by Application 2020 & 2033
- Table 11: Canada Disposable Batteries Industry Revenue (Million) Forecast, by Application 2020 & 2033
- Table 12: Canada Disposable Batteries Industry Volume (Kiloton) Forecast, by Application 2020 & 2033
- Table 13: Rest of North America Disposable Batteries Industry Revenue (Million) Forecast, by Application 2020 & 2033
- Table 14: Rest of North America Disposable Batteries Industry Volume (Kiloton) Forecast, by Application 2020 & 2033
- Table 15: Global Disposable Batteries Industry Revenue Million Forecast, by Type 2020 & 2033
- Table 16: Global Disposable Batteries Industry Volume Kiloton Forecast, by Type 2020 & 2033
- Table 17: Global Disposable Batteries Industry Revenue Million Forecast, by Country 2020 & 2033
- Table 18: Global Disposable Batteries Industry Volume Kiloton Forecast, by Country 2020 & 2033
- Table 19: Germany Disposable Batteries Industry Revenue (Million) Forecast, by Application 2020 & 2033
- Table 20: Germany Disposable Batteries Industry Volume (Kiloton) Forecast, by Application 2020 & 2033
- Table 21: France Disposable Batteries Industry Revenue (Million) Forecast, by Application 2020 & 2033
- Table 22: France Disposable Batteries Industry Volume (Kiloton) Forecast, by Application 2020 & 2033
- Table 23: United Kingdom Disposable Batteries Industry Revenue (Million) Forecast, by Application 2020 & 2033
- Table 24: United Kingdom Disposable Batteries Industry Volume (Kiloton) Forecast, by Application 2020 & 2033
- Table 25: Russia Disposable Batteries Industry Revenue (Million) Forecast, by Application 2020 & 2033
- Table 26: Russia Disposable Batteries Industry Volume (Kiloton) Forecast, by Application 2020 & 2033
- Table 27: Rest of Europe Disposable Batteries Industry Revenue (Million) Forecast, by Application 2020 & 2033
- Table 28: Rest of Europe Disposable Batteries Industry Volume (Kiloton) Forecast, by Application 2020 & 2033
- Table 29: Global Disposable Batteries Industry Revenue Million Forecast, by Type 2020 & 2033
- Table 30: Global Disposable Batteries Industry Volume Kiloton Forecast, by Type 2020 & 2033
- Table 31: Global Disposable Batteries Industry Revenue Million Forecast, by Country 2020 & 2033
- Table 32: Global Disposable Batteries Industry Volume Kiloton Forecast, by Country 2020 & 2033
- Table 33: China Disposable Batteries Industry Revenue (Million) Forecast, by Application 2020 & 2033
- Table 34: China Disposable Batteries Industry Volume (Kiloton) Forecast, by Application 2020 & 2033
- Table 35: Japan Disposable Batteries Industry Revenue (Million) Forecast, by Application 2020 & 2033
- Table 36: Japan Disposable Batteries Industry Volume (Kiloton) Forecast, by Application 2020 & 2033
- Table 37: Thailand Disposable Batteries Industry Revenue (Million) Forecast, by Application 2020 & 2033
- Table 38: Thailand Disposable Batteries Industry Volume (Kiloton) Forecast, by Application 2020 & 2033
- Table 39: Indonesia Disposable Batteries Industry Revenue (Million) Forecast, by Application 2020 & 2033
- Table 40: Indonesia Disposable Batteries Industry Volume (Kiloton) Forecast, by Application 2020 & 2033
- Table 41: Malaysia Disposable Batteries Industry Revenue (Million) Forecast, by Application 2020 & 2033
- Table 42: Malaysia Disposable Batteries Industry Volume (Kiloton) Forecast, by Application 2020 & 2033
- Table 43: India Disposable Batteries Industry Revenue (Million) Forecast, by Application 2020 & 2033
- Table 44: India Disposable Batteries Industry Volume (Kiloton) Forecast, by Application 2020 & 2033
- Table 45: Rest of Asia Pacific Disposable Batteries Industry Revenue (Million) Forecast, by Application 2020 & 2033
- Table 46: Rest of Asia Pacific Disposable Batteries Industry Volume (Kiloton) Forecast, by Application 2020 & 2033
- Table 47: Global Disposable Batteries Industry Revenue Million Forecast, by Type 2020 & 2033
- Table 48: Global Disposable Batteries Industry Volume Kiloton Forecast, by Type 2020 & 2033
- Table 49: Global Disposable Batteries Industry Revenue Million Forecast, by Country 2020 & 2033
- Table 50: Global Disposable Batteries Industry Volume Kiloton Forecast, by Country 2020 & 2033
- Table 51: Brazil Disposable Batteries Industry Revenue (Million) Forecast, by Application 2020 & 2033
- Table 52: Brazil Disposable Batteries Industry Volume (Kiloton) Forecast, by Application 2020 & 2033
- Table 53: Argentina Disposable Batteries Industry Revenue (Million) Forecast, by Application 2020 & 2033
- Table 54: Argentina Disposable Batteries Industry Volume (Kiloton) Forecast, by Application 2020 & 2033
- Table 55: Rest of South America Disposable Batteries Industry Revenue (Million) Forecast, by Application 2020 & 2033
- Table 56: Rest of South America Disposable Batteries Industry Volume (Kiloton) Forecast, by Application 2020 & 2033
- Table 57: Global Disposable Batteries Industry Revenue Million Forecast, by Type 2020 & 2033
- Table 58: Global Disposable Batteries Industry Volume Kiloton Forecast, by Type 2020 & 2033
- Table 59: Global Disposable Batteries Industry Revenue Million Forecast, by Country 2020 & 2033
- Table 60: Global Disposable Batteries Industry Volume Kiloton Forecast, by Country 2020 & 2033
- Table 61: Saudi Arabia Disposable Batteries Industry Revenue (Million) Forecast, by Application 2020 & 2033
- Table 62: Saudi Arabia Disposable Batteries Industry Volume (Kiloton) Forecast, by Application 2020 & 2033
- Table 63: United Arab Emirates Disposable Batteries Industry Revenue (Million) Forecast, by Application 2020 & 2033
- Table 64: United Arab Emirates Disposable Batteries Industry Volume (Kiloton) Forecast, by Application 2020 & 2033
- Table 65: South Africa Disposable Batteries Industry Revenue (Million) Forecast, by Application 2020 & 2033
- Table 66: South Africa Disposable Batteries Industry Volume (Kiloton) Forecast, by Application 2020 & 2033
- Table 67: Rest of Middle East and Africa Disposable Batteries Industry Revenue (Million) Forecast, by Application 2020 & 2033
- Table 68: Rest of Middle East and Africa Disposable Batteries Industry Volume (Kiloton) Forecast, by Application 2020 & 2033
Frequently Asked Questions
1. What is the projected Compound Annual Growth Rate (CAGR) of the Disposable Batteries Industry?
The projected CAGR is approximately 5.62%.
2. Which companies are prominent players in the Disposable Batteries Industry?
Key companies in the market include Saft Groupe SA, GP Batteries International Ltd, Ultralife Corporation, Camelion Battery Co Ltd, FDK Corporation, Toshiba Corporation*List Not Exhaustive, Duracell Inc, Energizer Holdings Inc, Panasonic Corporation.
3. What are the main segments of the Disposable Batteries Industry?
The market segments include Type.
4. Can you provide details about the market size?
The market size is estimated to be USD 16.79 Million as of 2022.
5. What are some drivers contributing to market growth?
4.; Growing Consumer Electronics Market4.; Increasing Adoption of Primary Batteries in the Healthcare Sector.
6. What are the notable trends driving market growth?
Primary Alkaline Battery Expected to Dominate the Market.
7. Are there any restraints impacting market growth?
4.; Limited Investments to Support Medium-voltage Transmission Network.
8. Can you provide examples of recent developments in the market?
September 2023, in accordance with Prime Minister Narendra Modi's ambitious initiative 'Mission LiFE' (Lifestyle for Environment), the Technology Development Board (TDB) revealed its partnership with Aloe Ecell Pvt Ltd, an innovative startup based in Lucknow, Uttar Pradesh.
9. What pricing options are available for accessing the report?
Pricing options include single-user, multi-user, and enterprise licenses priced at USD 4750, USD 5250, and USD 8750 respectively.
10. Is the market size provided in terms of value or volume?
The market size is provided in terms of value, measured in Million and volume, measured in Kiloton.
11. Are there any specific market keywords associated with the report?
Yes, the market keyword associated with the report is "Disposable Batteries Industry," which aids in identifying and referencing the specific market segment covered.
12. How do I determine which pricing option suits my needs best?
The pricing options vary based on user requirements and access needs. Individual users may opt for single-user licenses, while businesses requiring broader access may choose multi-user or enterprise licenses for cost-effective access to the report.
13. Are there any additional resources or data provided in the Disposable Batteries Industry report?
While the report offers comprehensive insights, it's advisable to review the specific contents or supplementary materials provided to ascertain if additional resources or data are available.
14. How can I stay updated on further developments or reports in the Disposable Batteries Industry?
To stay informed about further developments, trends, and reports in the Disposable Batteries Industry, consider subscribing to industry newsletters, following relevant companies and organizations, or regularly checking reputable industry news sources and publications.
Methodology
Step 1 - Identification of Relevant Samples Size from Population Database


Step 2 - Approaches for Defining Global Market Size (Value, Volume* & Price*)

Note*: In applicable scenarios
Step 3 - Data Sources
Primary Research
- Web Analytics
- Survey Reports
- Research Institute
- Latest Research Reports
- Opinion Leaders
Secondary Research
- Annual Reports
- White Paper
- Latest Press Release
- Industry Association
- Paid Database
- Investor Presentations

Step 4 - Data Triangulation
Involves using different sources of information in order to increase the validity of a study
These sources are likely to be stakeholders in a program - participants, other researchers, program staff, other community members, and so on.
Then we put all data in single framework & apply various statistical tools to find out the dynamic on the market.
During the analysis stage, feedback from the stakeholder groups would be compared to determine areas of agreement as well as areas of divergence