

Key Insights
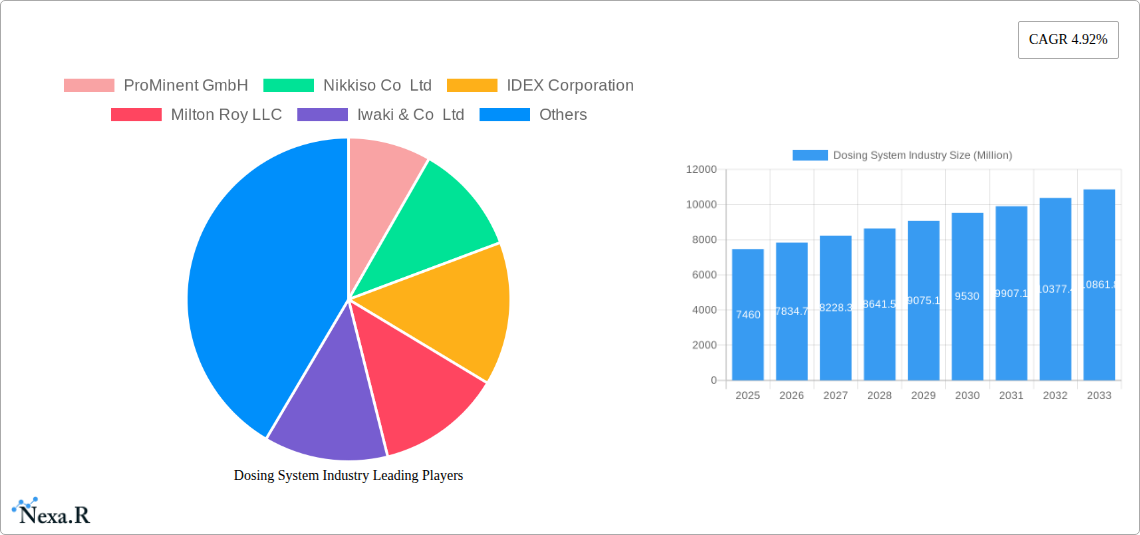
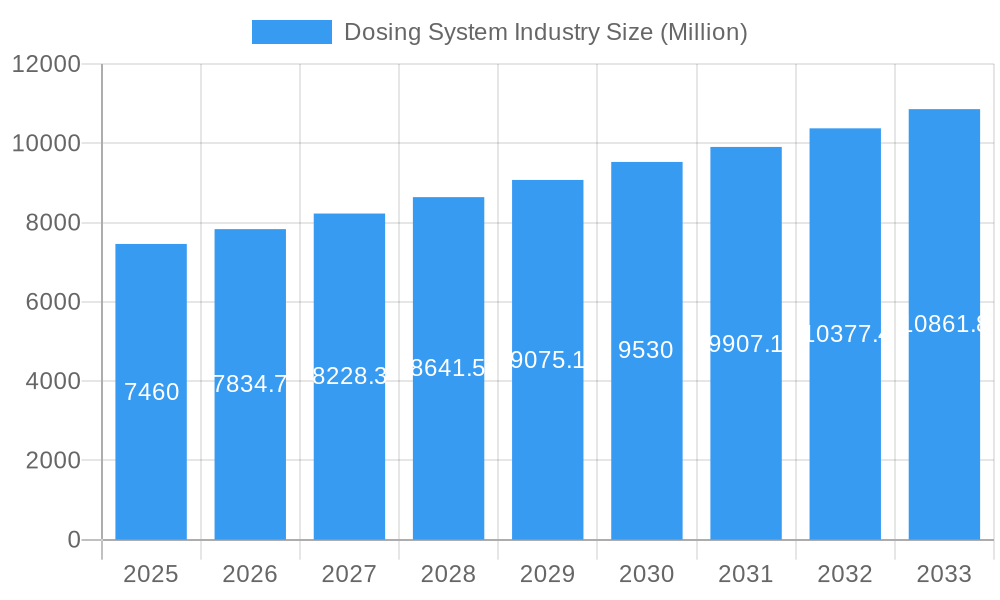
The global dosing system market, valued at $7.46 billion in 2025, is projected to experience robust growth, driven by increasing demand across diverse industries. The compound annual growth rate (CAGR) of 4.92% from 2025 to 2033 indicates a significant expansion, largely fueled by the rising adoption of advanced automation and process control technologies in sectors like oil and gas, water and wastewater treatment, and chemical processing. These industries are increasingly prioritizing precise chemical dosing for efficiency, safety, and environmental compliance. Furthermore, stringent environmental regulations globally are compelling businesses to adopt sophisticated dosing systems to reduce waste and minimize their ecological footprint. The market is segmented by pump type (diaphragm, piston, and others) and application (oil and gas, water and wastewater treatment, chemicals, and others). Diaphragm pumps are expected to maintain a dominant market share due to their versatility and suitability for handling a wide range of fluids. The geographically diverse market sees strong growth across North America and Europe, driven by established industrial infrastructure and regulatory frameworks. However, the Asia-Pacific region is poised for significant expansion, fueled by rapid industrialization and infrastructure development, particularly in countries like China and India.
Dosing System Industry Market Size (In Billion)
Growth within the dosing system market is not without its challenges. High initial investment costs for advanced systems and the need for skilled personnel for operation and maintenance could pose restraints on market penetration, particularly in smaller enterprises. However, technological advancements leading to more energy-efficient and user-friendly systems are mitigating these challenges. Major players in the market, including ProMinent GmbH, Nikkiso Co Ltd, IDEX Corporation, and others, are continuously innovating to meet evolving industry demands and enhance the overall value proposition of dosing systems. Competition is intensifying as companies invest in research and development to offer advanced features and customized solutions. This competitive landscape is expected to further drive market growth and innovation in the coming years, leading to more sophisticated and efficient dosing solutions.
Dosing System Industry Company Market Share
Dosing System Industry Market Report: 2019-2033
This comprehensive report provides a detailed analysis of the global dosing system market, encompassing market dynamics, growth trends, regional insights, product landscape, and key player strategies. With a study period spanning 2019-2033, a base year of 2025, and a forecast period of 2025-2033, this report offers invaluable insights for industry professionals, investors, and strategic decision-makers. The report utilizes data from the historical period of 2019-2024 and incorporates expert estimations where data is unavailable. The market is segmented by type (Diaphragm Pump, Piston Pump, Other Types) and application (Oil and Gas, Water and Sewage Treatment, Chemicals, Other Applications). The total market size is estimated to reach xx Million units by 2033.
Dosing System Industry Market Dynamics & Structure
The global dosing system market is characterized by moderate concentration, with several major players holding significant market share. Technological innovation, particularly in areas like smart connectivity and improved efficiency, is a key driver of growth. Stringent environmental regulations, especially concerning water and wastewater treatment, are also shaping market demand. The market faces competition from alternative solutions, but the overall need for precise and reliable chemical dosing across diverse industries ensures continued demand. Mergers and acquisitions (M&A) activity has been relatively stable in recent years, with approximately xx M&A deals recorded between 2019 and 2024, contributing to market consolidation.
- Market Concentration: Moderately concentrated, with top 5 players holding approximately xx% market share in 2024.
- Technological Innovation: Focus on smart dosing systems, improved energy efficiency, and remote monitoring capabilities.
- Regulatory Framework: Stringent environmental regulations driving demand for advanced dosing systems in water and wastewater treatment.
- Competitive Substitutes: Limited, primarily involving alternative chemical delivery methods with lower precision.
- End-User Demographics: Diverse, spanning oil & gas, water treatment, chemical processing, and pharmaceuticals.
- M&A Trends: Steady M&A activity, with an average of xx deals per year between 2019 and 2024, focused on expanding product portfolios and geographical reach.
Dosing System Industry Growth Trends & Insights
The global dosing system market has experienced steady growth over the past five years, driven by increasing industrialization, rising environmental awareness, and the growing adoption of advanced automation technologies. The market size is projected to expand at a Compound Annual Growth Rate (CAGR) of xx% from 2025 to 2033. This growth is particularly notable in regions with rapid economic development and expanding infrastructure projects. The adoption rate of advanced dosing systems, particularly those with smart features, is steadily increasing, driven by the need for improved efficiency, reduced operational costs, and enhanced monitoring capabilities. Consumer behavior is shifting towards a preference for sustainable and technologically advanced solutions, impacting demand for energy-efficient and environmentally friendly dosing systems.
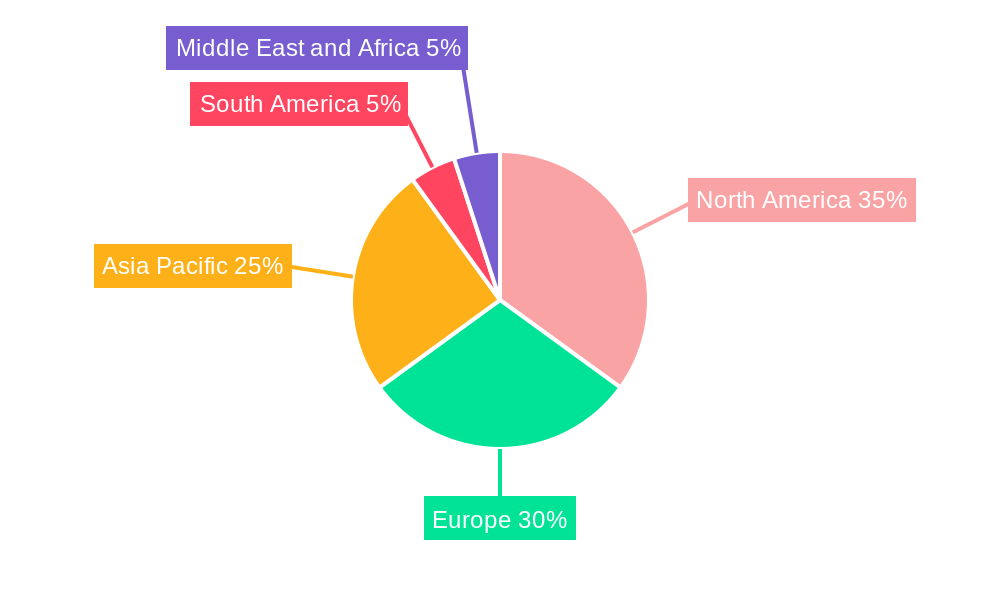
Dominant Regions, Countries, or Segments in Dosing System Industry
North America and Europe currently dominate the global dosing system market, driven by established industrial sectors and stringent environmental regulations. However, the Asia-Pacific region is experiencing rapid growth, fueled by increasing industrialization and infrastructure development. Within the market segments, the Diaphragm Pump segment holds the largest market share due to its versatility and cost-effectiveness. The Water and Sewage Treatment application segment is the largest end-use sector, propelled by the necessity for precise chemical dosing in wastewater treatment plants.
- Leading Region: North America (xx% market share in 2024).
- High-Growth Region: Asia-Pacific (projected CAGR of xx% from 2025 to 2033).
- Dominant Segment (Type): Diaphragm Pumps (xx% market share in 2024).
- Dominant Segment (Application): Water and Sewage Treatment (xx% market share in 2024).
- Key Drivers: Stringent environmental regulations, industrial growth, and infrastructure development.
Dosing System Industry Product Landscape
The dosing system market offers a range of products, from basic diaphragm pumps to sophisticated, digitally controlled systems with remote monitoring capabilities. Recent innovations focus on improving accuracy, reducing energy consumption, and enhancing ease of use. Key features include advanced materials for chemical compatibility, integrated sensors for real-time monitoring, and smart interfaces for seamless integration into industrial control systems. Unique selling propositions frequently include superior precision, extended lifespan, and reduced maintenance requirements.
Key Drivers, Barriers & Challenges in Dosing System Industry
Key Drivers:
- Increasing demand for precise chemical dosing across various industries.
- Stringent environmental regulations driving adoption of advanced systems.
- Growing automation and digitalization in industrial processes.
- Expansion of water and wastewater treatment infrastructure.
Key Challenges & Restraints:
- High initial investment costs for advanced systems can act as a barrier to entry for some end-users.
- Supply chain disruptions due to global events can impact production and availability.
- Intense competition among established players can lead to price pressure.
- Complexity of regulatory compliance across different geographical regions.
Emerging Opportunities in Dosing System Industry
- Growing demand for sustainable and energy-efficient dosing systems.
- Expansion into untapped markets in developing economies.
- Increasing applications in emerging industries such as pharmaceuticals and biotechnology.
- Development of innovative dosing solutions for specific chemical handling needs.
Growth Accelerators in the Dosing System Industry
Technological advancements, strategic collaborations between manufacturers and technology providers, and expansion into new markets are driving long-term growth. The integration of artificial intelligence and machine learning in dosing systems offers significant potential for improved efficiency and predictive maintenance. The development of more sustainable and eco-friendly materials and processes is also key to unlocking further market expansion.
Key Players Shaping the Dosing System Industry Market
- ProMinent GmbH
- Nikkiso Co Ltd
- IDEX Corporation
- Milton Roy LLC
- Iwaki & Co Ltd
- Grundfos Holding AS
- Dover Corporation
- SPX Flow Inc
- Verder Ltd
- Watson-Marlow Fluid Technology Group
Notable Milestones in Dosing System Industry Sector
- April 2022: SEKO upgraded its WareDose warewash dosing pump systems with integrated Wi-Fi hubs, enabling 24/7 remote monitoring.
- September 2022: Verder Liquids launched the Verderflex Ds500 metering and dosing pump, designed to challenge traditional chemical dosing solutions.
In-Depth Dosing System Industry Market Outlook
The future of the dosing system market looks promising, driven by technological innovation, increasing environmental awareness, and expanding industrial applications. The continued focus on developing energy-efficient, smart, and sustainable dosing systems, coupled with strategic partnerships and market expansion initiatives, will significantly propel market growth over the forecast period. Opportunities exist in emerging markets and in specialized applications requiring high precision and reliability. Companies that can effectively adapt to evolving regulatory landscapes and consumer preferences will be best positioned for success.
Dosing System Industry Segmentation
-
1. Type
- 1.1. Diaphragm Pump
- 1.2. Piston Pump
- 1.3. Other Types
-
2. Application
- 2.1. Oil and Gas
- 2.2. Water and Sewage Treatment
- 2.3. Chemicals
- 2.4. Other Applications
Dosing System Industry Segmentation By Geography
-
1. North America
- 1.1. United States
- 1.2. Canada
- 1.3. Rest of North America
-
2. Europe
- 2.1. Germany
- 2.2. United Kingdom
- 2.3. France
- 2.4. Spain
- 2.5. Italy
- 2.6. Rest of Europe
-
3. Asia Pacific
- 3.1. China
- 3.2. India
- 3.3. Japan
- 3.4. South Korea
- 3.5. Rest of Asia Pacific
-
4. South America
- 4.1. Brazil
- 4.2. Argentina
- 4.3. Rest of South America
-
5. Middle East and Africa
- 5.1. Saudi Arabia
- 5.2. United Arab Emirates
- 5.3. South Africa
- 5.4. Rest of Middle East and Africa
Dosing System Industry Regional Market Share
Geographic Coverage of Dosing System Industry
Dosing System Industry REPORT HIGHLIGHTS
| Aspects | Details |
|---|---|
| Study Period | 2020-2034 |
| Base Year | 2025 |
| Estimated Year | 2026 |
| Forecast Period | 2026-2034 |
| Historical Period | 2020-2025 |
| Growth Rate | CAGR of 4.92% from 2020-2034 |
| Segmentation |
|
Table of Contents
- 1. Introduction
- 1.1. Research Scope
- 1.2. Market Segmentation
- 1.3. Research Objective
- 1.4. Definitions and Assumptions
- 2. Executive Summary
- 2.1. Market Snapshot
- 3. Market Dynamics
- 3.1. Market Drivers
- 3.2. Market Restrains
- 3.3. Market Trends
- 3.4. Market Opportunities
- 4. Market Factor Analysis
- 4.1. Porters Five Forces
- 4.1.1. Bargaining Power of Suppliers
- 4.1.2. Bargaining Power of Buyers
- 4.1.3. Threat of New Entrants
- 4.1.4. Threat of Substitutes
- 4.1.5. Competitive Rivalry
- 4.2. PESTEL analysis
- 4.3. BCG Analysis
- 4.3.1. Stars (High Growth, High Market Share)
- 4.3.2. Cash Cows (Low Growth, High Market Share)
- 4.3.3. Question Mark (High Growth, Low Market Share)
- 4.3.4. Dogs (Low Growth, Low Market Share)
- 4.4. Ansoff Matrix Analysis
- 4.5. Supply Chain Analysis
- 4.6. Regulatory Landscape
- 4.7. Current Market Potential and Opportunity Assessment (TAM–SAM–SOM Framework)
- 4.8. NRP Analyst Note
- 4.1. Porters Five Forces
- 5. Market Analysis, Insights and Forecast 2021-2033
- 5.1. Market Analysis, Insights and Forecast - by Type
- 5.1.1. Diaphragm Pump
- 5.1.2. Piston Pump
- 5.1.3. Other Types
- 5.2. Market Analysis, Insights and Forecast - by Application
- 5.2.1. Oil and Gas
- 5.2.2. Water and Sewage Treatment
- 5.2.3. Chemicals
- 5.2.4. Other Applications
- 5.3. Market Analysis, Insights and Forecast - by Region
- 5.3.1. North America
- 5.3.2. Europe
- 5.3.3. Asia Pacific
- 5.3.4. South America
- 5.3.5. Middle East and Africa
- 5.1. Market Analysis, Insights and Forecast - by Type
- 6. Global Dosing System Industry Analysis, Insights and Forecast, 2021-2033
- 6.1. Market Analysis, Insights and Forecast - by Type
- 6.1.1. Diaphragm Pump
- 6.1.2. Piston Pump
- 6.1.3. Other Types
- 6.2. Market Analysis, Insights and Forecast - by Application
- 6.2.1. Oil and Gas
- 6.2.2. Water and Sewage Treatment
- 6.2.3. Chemicals
- 6.2.4. Other Applications
- 6.1. Market Analysis, Insights and Forecast - by Type
- 7. North America Dosing System Industry Analysis, Insights and Forecast, 2020-2032
- 7.1. Market Analysis, Insights and Forecast - by Type
- 7.1.1. Diaphragm Pump
- 7.1.2. Piston Pump
- 7.1.3. Other Types
- 7.2. Market Analysis, Insights and Forecast - by Application
- 7.2.1. Oil and Gas
- 7.2.2. Water and Sewage Treatment
- 7.2.3. Chemicals
- 7.2.4. Other Applications
- 7.1. Market Analysis, Insights and Forecast - by Type
- 8. Europe Dosing System Industry Analysis, Insights and Forecast, 2020-2032
- 8.1. Market Analysis, Insights and Forecast - by Type
- 8.1.1. Diaphragm Pump
- 8.1.2. Piston Pump
- 8.1.3. Other Types
- 8.2. Market Analysis, Insights and Forecast - by Application
- 8.2.1. Oil and Gas
- 8.2.2. Water and Sewage Treatment
- 8.2.3. Chemicals
- 8.2.4. Other Applications
- 8.1. Market Analysis, Insights and Forecast - by Type
- 9. Asia Pacific Dosing System Industry Analysis, Insights and Forecast, 2020-2032
- 9.1. Market Analysis, Insights and Forecast - by Type
- 9.1.1. Diaphragm Pump
- 9.1.2. Piston Pump
- 9.1.3. Other Types
- 9.2. Market Analysis, Insights and Forecast - by Application
- 9.2.1. Oil and Gas
- 9.2.2. Water and Sewage Treatment
- 9.2.3. Chemicals
- 9.2.4. Other Applications
- 9.1. Market Analysis, Insights and Forecast - by Type
- 10. South America Dosing System Industry Analysis, Insights and Forecast, 2020-2032
- 10.1. Market Analysis, Insights and Forecast - by Type
- 10.1.1. Diaphragm Pump
- 10.1.2. Piston Pump
- 10.1.3. Other Types
- 10.2. Market Analysis, Insights and Forecast - by Application
- 10.2.1. Oil and Gas
- 10.2.2. Water and Sewage Treatment
- 10.2.3. Chemicals
- 10.2.4. Other Applications
- 10.1. Market Analysis, Insights and Forecast - by Type
- 11. Middle East and Africa Dosing System Industry Analysis, Insights and Forecast, 2020-2032
- 11.1. Market Analysis, Insights and Forecast - by Type
- 11.1.1. Diaphragm Pump
- 11.1.2. Piston Pump
- 11.1.3. Other Types
- 11.2. Market Analysis, Insights and Forecast - by Application
- 11.2.1. Oil and Gas
- 11.2.2. Water and Sewage Treatment
- 11.2.3. Chemicals
- 11.2.4. Other Applications
- 11.1. Market Analysis, Insights and Forecast - by Type
- 12. Competitive Analysis
- 12.1. Company Profiles
- 12.1.1 ProMinent GmbH
- 12.1.1.1. Company Overview
- 12.1.1.2. Products
- 12.1.1.3. Company Financials
- 12.1.1.4. SWOT Analysis
- 12.1.2 Nikkiso Co Ltd
- 12.1.2.1. Company Overview
- 12.1.2.2. Products
- 12.1.2.3. Company Financials
- 12.1.2.4. SWOT Analysis
- 12.1.3 IDEX Corporation
- 12.1.3.1. Company Overview
- 12.1.3.2. Products
- 12.1.3.3. Company Financials
- 12.1.3.4. SWOT Analysis
- 12.1.4 Milton Roy LLC
- 12.1.4.1. Company Overview
- 12.1.4.2. Products
- 12.1.4.3. Company Financials
- 12.1.4.4. SWOT Analysis
- 12.1.5 Iwaki & Co Ltd
- 12.1.5.1. Company Overview
- 12.1.5.2. Products
- 12.1.5.3. Company Financials
- 12.1.5.4. SWOT Analysis
- 12.1.6 Grundfos Holding AS
- 12.1.6.1. Company Overview
- 12.1.6.2. Products
- 12.1.6.3. Company Financials
- 12.1.6.4. SWOT Analysis
- 12.1.7 Dover Corporation
- 12.1.7.1. Company Overview
- 12.1.7.2. Products
- 12.1.7.3. Company Financials
- 12.1.7.4. SWOT Analysis
- 12.1.8 SPX Flow Inc
- 12.1.8.1. Company Overview
- 12.1.8.2. Products
- 12.1.8.3. Company Financials
- 12.1.8.4. SWOT Analysis
- 12.1.9 Verder Ltd*List Not Exhaustive
- 12.1.9.1. Company Overview
- 12.1.9.2. Products
- 12.1.9.3. Company Financials
- 12.1.9.4. SWOT Analysis
- 12.1.10 Watson-Marlow Fluid Technology Group
- 12.1.10.1. Company Overview
- 12.1.10.2. Products
- 12.1.10.3. Company Financials
- 12.1.10.4. SWOT Analysis
- 12.1.1 ProMinent GmbH
- 12.2. Market Entropy
- 12.2.1 Company's Key Areas Served
- 12.2.2 Recent Developments
- 12.3. Company Market Share Analysis 2025
- 12.3.1 Top 5 Companies Market Share Analysis
- 12.3.2 Top 3 Companies Market Share Analysis
- 12.4. List of Potential Customers
- 13. Research Methodology
List of Figures
- Figure 1: Global Dosing System Industry Revenue Breakdown (Million, %) by Region 2025 & 2033
- Figure 2: Global Dosing System Industry Volume Breakdown (K Tons, %) by Region 2025 & 2033
- Figure 3: North America Dosing System Industry Revenue (Million), by Type 2025 & 2033
- Figure 4: North America Dosing System Industry Volume (K Tons), by Type 2025 & 2033
- Figure 5: North America Dosing System Industry Revenue Share (%), by Type 2025 & 2033
- Figure 6: North America Dosing System Industry Volume Share (%), by Type 2025 & 2033
- Figure 7: North America Dosing System Industry Revenue (Million), by Application 2025 & 2033
- Figure 8: North America Dosing System Industry Volume (K Tons), by Application 2025 & 2033
- Figure 9: North America Dosing System Industry Revenue Share (%), by Application 2025 & 2033
- Figure 10: North America Dosing System Industry Volume Share (%), by Application 2025 & 2033
- Figure 11: North America Dosing System Industry Revenue (Million), by Country 2025 & 2033
- Figure 12: North America Dosing System Industry Volume (K Tons), by Country 2025 & 2033
- Figure 13: North America Dosing System Industry Revenue Share (%), by Country 2025 & 2033
- Figure 14: North America Dosing System Industry Volume Share (%), by Country 2025 & 2033
- Figure 15: Europe Dosing System Industry Revenue (Million), by Type 2025 & 2033
- Figure 16: Europe Dosing System Industry Volume (K Tons), by Type 2025 & 2033
- Figure 17: Europe Dosing System Industry Revenue Share (%), by Type 2025 & 2033
- Figure 18: Europe Dosing System Industry Volume Share (%), by Type 2025 & 2033
- Figure 19: Europe Dosing System Industry Revenue (Million), by Application 2025 & 2033
- Figure 20: Europe Dosing System Industry Volume (K Tons), by Application 2025 & 2033
- Figure 21: Europe Dosing System Industry Revenue Share (%), by Application 2025 & 2033
- Figure 22: Europe Dosing System Industry Volume Share (%), by Application 2025 & 2033
- Figure 23: Europe Dosing System Industry Revenue (Million), by Country 2025 & 2033
- Figure 24: Europe Dosing System Industry Volume (K Tons), by Country 2025 & 2033
- Figure 25: Europe Dosing System Industry Revenue Share (%), by Country 2025 & 2033
- Figure 26: Europe Dosing System Industry Volume Share (%), by Country 2025 & 2033
- Figure 27: Asia Pacific Dosing System Industry Revenue (Million), by Type 2025 & 2033
- Figure 28: Asia Pacific Dosing System Industry Volume (K Tons), by Type 2025 & 2033
- Figure 29: Asia Pacific Dosing System Industry Revenue Share (%), by Type 2025 & 2033
- Figure 30: Asia Pacific Dosing System Industry Volume Share (%), by Type 2025 & 2033
- Figure 31: Asia Pacific Dosing System Industry Revenue (Million), by Application 2025 & 2033
- Figure 32: Asia Pacific Dosing System Industry Volume (K Tons), by Application 2025 & 2033
- Figure 33: Asia Pacific Dosing System Industry Revenue Share (%), by Application 2025 & 2033
- Figure 34: Asia Pacific Dosing System Industry Volume Share (%), by Application 2025 & 2033
- Figure 35: Asia Pacific Dosing System Industry Revenue (Million), by Country 2025 & 2033
- Figure 36: Asia Pacific Dosing System Industry Volume (K Tons), by Country 2025 & 2033
- Figure 37: Asia Pacific Dosing System Industry Revenue Share (%), by Country 2025 & 2033
- Figure 38: Asia Pacific Dosing System Industry Volume Share (%), by Country 2025 & 2033
- Figure 39: South America Dosing System Industry Revenue (Million), by Type 2025 & 2033
- Figure 40: South America Dosing System Industry Volume (K Tons), by Type 2025 & 2033
- Figure 41: South America Dosing System Industry Revenue Share (%), by Type 2025 & 2033
- Figure 42: South America Dosing System Industry Volume Share (%), by Type 2025 & 2033
- Figure 43: South America Dosing System Industry Revenue (Million), by Application 2025 & 2033
- Figure 44: South America Dosing System Industry Volume (K Tons), by Application 2025 & 2033
- Figure 45: South America Dosing System Industry Revenue Share (%), by Application 2025 & 2033
- Figure 46: South America Dosing System Industry Volume Share (%), by Application 2025 & 2033
- Figure 47: South America Dosing System Industry Revenue (Million), by Country 2025 & 2033
- Figure 48: South America Dosing System Industry Volume (K Tons), by Country 2025 & 2033
- Figure 49: South America Dosing System Industry Revenue Share (%), by Country 2025 & 2033
- Figure 50: South America Dosing System Industry Volume Share (%), by Country 2025 & 2033
- Figure 51: Middle East and Africa Dosing System Industry Revenue (Million), by Type 2025 & 2033
- Figure 52: Middle East and Africa Dosing System Industry Volume (K Tons), by Type 2025 & 2033
- Figure 53: Middle East and Africa Dosing System Industry Revenue Share (%), by Type 2025 & 2033
- Figure 54: Middle East and Africa Dosing System Industry Volume Share (%), by Type 2025 & 2033
- Figure 55: Middle East and Africa Dosing System Industry Revenue (Million), by Application 2025 & 2033
- Figure 56: Middle East and Africa Dosing System Industry Volume (K Tons), by Application 2025 & 2033
- Figure 57: Middle East and Africa Dosing System Industry Revenue Share (%), by Application 2025 & 2033
- Figure 58: Middle East and Africa Dosing System Industry Volume Share (%), by Application 2025 & 2033
- Figure 59: Middle East and Africa Dosing System Industry Revenue (Million), by Country 2025 & 2033
- Figure 60: Middle East and Africa Dosing System Industry Volume (K Tons), by Country 2025 & 2033
- Figure 61: Middle East and Africa Dosing System Industry Revenue Share (%), by Country 2025 & 2033
- Figure 62: Middle East and Africa Dosing System Industry Volume Share (%), by Country 2025 & 2033
List of Tables
- Table 1: Global Dosing System Industry Revenue Million Forecast, by Type 2020 & 2033
- Table 2: Global Dosing System Industry Volume K Tons Forecast, by Type 2020 & 2033
- Table 3: Global Dosing System Industry Revenue Million Forecast, by Application 2020 & 2033
- Table 4: Global Dosing System Industry Volume K Tons Forecast, by Application 2020 & 2033
- Table 5: Global Dosing System Industry Revenue Million Forecast, by Region 2020 & 2033
- Table 6: Global Dosing System Industry Volume K Tons Forecast, by Region 2020 & 2033
- Table 7: Global Dosing System Industry Revenue Million Forecast, by Type 2020 & 2033
- Table 8: Global Dosing System Industry Volume K Tons Forecast, by Type 2020 & 2033
- Table 9: Global Dosing System Industry Revenue Million Forecast, by Application 2020 & 2033
- Table 10: Global Dosing System Industry Volume K Tons Forecast, by Application 2020 & 2033
- Table 11: Global Dosing System Industry Revenue Million Forecast, by Country 2020 & 2033
- Table 12: Global Dosing System Industry Volume K Tons Forecast, by Country 2020 & 2033
- Table 13: United States Dosing System Industry Revenue (Million) Forecast, by Application 2020 & 2033
- Table 14: United States Dosing System Industry Volume (K Tons) Forecast, by Application 2020 & 2033
- Table 15: Canada Dosing System Industry Revenue (Million) Forecast, by Application 2020 & 2033
- Table 16: Canada Dosing System Industry Volume (K Tons) Forecast, by Application 2020 & 2033
- Table 17: Rest of North America Dosing System Industry Revenue (Million) Forecast, by Application 2020 & 2033
- Table 18: Rest of North America Dosing System Industry Volume (K Tons) Forecast, by Application 2020 & 2033
- Table 19: Global Dosing System Industry Revenue Million Forecast, by Type 2020 & 2033
- Table 20: Global Dosing System Industry Volume K Tons Forecast, by Type 2020 & 2033
- Table 21: Global Dosing System Industry Revenue Million Forecast, by Application 2020 & 2033
- Table 22: Global Dosing System Industry Volume K Tons Forecast, by Application 2020 & 2033
- Table 23: Global Dosing System Industry Revenue Million Forecast, by Country 2020 & 2033
- Table 24: Global Dosing System Industry Volume K Tons Forecast, by Country 2020 & 2033
- Table 25: Germany Dosing System Industry Revenue (Million) Forecast, by Application 2020 & 2033
- Table 26: Germany Dosing System Industry Volume (K Tons) Forecast, by Application 2020 & 2033
- Table 27: United Kingdom Dosing System Industry Revenue (Million) Forecast, by Application 2020 & 2033
- Table 28: United Kingdom Dosing System Industry Volume (K Tons) Forecast, by Application 2020 & 2033
- Table 29: France Dosing System Industry Revenue (Million) Forecast, by Application 2020 & 2033
- Table 30: France Dosing System Industry Volume (K Tons) Forecast, by Application 2020 & 2033
- Table 31: Spain Dosing System Industry Revenue (Million) Forecast, by Application 2020 & 2033
- Table 32: Spain Dosing System Industry Volume (K Tons) Forecast, by Application 2020 & 2033
- Table 33: Italy Dosing System Industry Revenue (Million) Forecast, by Application 2020 & 2033
- Table 34: Italy Dosing System Industry Volume (K Tons) Forecast, by Application 2020 & 2033
- Table 35: Rest of Europe Dosing System Industry Revenue (Million) Forecast, by Application 2020 & 2033
- Table 36: Rest of Europe Dosing System Industry Volume (K Tons) Forecast, by Application 2020 & 2033
- Table 37: Global Dosing System Industry Revenue Million Forecast, by Type 2020 & 2033
- Table 38: Global Dosing System Industry Volume K Tons Forecast, by Type 2020 & 2033
- Table 39: Global Dosing System Industry Revenue Million Forecast, by Application 2020 & 2033
- Table 40: Global Dosing System Industry Volume K Tons Forecast, by Application 2020 & 2033
- Table 41: Global Dosing System Industry Revenue Million Forecast, by Country 2020 & 2033
- Table 42: Global Dosing System Industry Volume K Tons Forecast, by Country 2020 & 2033
- Table 43: China Dosing System Industry Revenue (Million) Forecast, by Application 2020 & 2033
- Table 44: China Dosing System Industry Volume (K Tons) Forecast, by Application 2020 & 2033
- Table 45: India Dosing System Industry Revenue (Million) Forecast, by Application 2020 & 2033
- Table 46: India Dosing System Industry Volume (K Tons) Forecast, by Application 2020 & 2033
- Table 47: Japan Dosing System Industry Revenue (Million) Forecast, by Application 2020 & 2033
- Table 48: Japan Dosing System Industry Volume (K Tons) Forecast, by Application 2020 & 2033
- Table 49: South Korea Dosing System Industry Revenue (Million) Forecast, by Application 2020 & 2033
- Table 50: South Korea Dosing System Industry Volume (K Tons) Forecast, by Application 2020 & 2033
- Table 51: Rest of Asia Pacific Dosing System Industry Revenue (Million) Forecast, by Application 2020 & 2033
- Table 52: Rest of Asia Pacific Dosing System Industry Volume (K Tons) Forecast, by Application 2020 & 2033
- Table 53: Global Dosing System Industry Revenue Million Forecast, by Type 2020 & 2033
- Table 54: Global Dosing System Industry Volume K Tons Forecast, by Type 2020 & 2033
- Table 55: Global Dosing System Industry Revenue Million Forecast, by Application 2020 & 2033
- Table 56: Global Dosing System Industry Volume K Tons Forecast, by Application 2020 & 2033
- Table 57: Global Dosing System Industry Revenue Million Forecast, by Country 2020 & 2033
- Table 58: Global Dosing System Industry Volume K Tons Forecast, by Country 2020 & 2033
- Table 59: Brazil Dosing System Industry Revenue (Million) Forecast, by Application 2020 & 2033
- Table 60: Brazil Dosing System Industry Volume (K Tons) Forecast, by Application 2020 & 2033
- Table 61: Argentina Dosing System Industry Revenue (Million) Forecast, by Application 2020 & 2033
- Table 62: Argentina Dosing System Industry Volume (K Tons) Forecast, by Application 2020 & 2033
- Table 63: Rest of South America Dosing System Industry Revenue (Million) Forecast, by Application 2020 & 2033
- Table 64: Rest of South America Dosing System Industry Volume (K Tons) Forecast, by Application 2020 & 2033
- Table 65: Global Dosing System Industry Revenue Million Forecast, by Type 2020 & 2033
- Table 66: Global Dosing System Industry Volume K Tons Forecast, by Type 2020 & 2033
- Table 67: Global Dosing System Industry Revenue Million Forecast, by Application 2020 & 2033
- Table 68: Global Dosing System Industry Volume K Tons Forecast, by Application 2020 & 2033
- Table 69: Global Dosing System Industry Revenue Million Forecast, by Country 2020 & 2033
- Table 70: Global Dosing System Industry Volume K Tons Forecast, by Country 2020 & 2033
- Table 71: Saudi Arabia Dosing System Industry Revenue (Million) Forecast, by Application 2020 & 2033
- Table 72: Saudi Arabia Dosing System Industry Volume (K Tons) Forecast, by Application 2020 & 2033
- Table 73: United Arab Emirates Dosing System Industry Revenue (Million) Forecast, by Application 2020 & 2033
- Table 74: United Arab Emirates Dosing System Industry Volume (K Tons) Forecast, by Application 2020 & 2033
- Table 75: South Africa Dosing System Industry Revenue (Million) Forecast, by Application 2020 & 2033
- Table 76: South Africa Dosing System Industry Volume (K Tons) Forecast, by Application 2020 & 2033
- Table 77: Rest of Middle East and Africa Dosing System Industry Revenue (Million) Forecast, by Application 2020 & 2033
- Table 78: Rest of Middle East and Africa Dosing System Industry Volume (K Tons) Forecast, by Application 2020 & 2033
Frequently Asked Questions
1. What is the projected Compound Annual Growth Rate (CAGR) of the Dosing System Industry?
The projected CAGR is approximately 4.92%.
2. Which companies are prominent players in the Dosing System Industry?
Key companies in the market include ProMinent GmbH, Nikkiso Co Ltd, IDEX Corporation, Milton Roy LLC, Iwaki & Co Ltd, Grundfos Holding AS, Dover Corporation, SPX Flow Inc, Verder Ltd*List Not Exhaustive, Watson-Marlow Fluid Technology Group.
3. What are the main segments of the Dosing System Industry?
The market segments include Type, Application.
4. Can you provide details about the market size?
The market size is estimated to be USD 7460 Million as of 2022.
5. What are some drivers contributing to market growth?
4.; Increasing Investments in Water Treatment by Developing Countries4.; Growing Demand for the Various End-Use Sectors.
6. What are the notable trends driving market growth?
Water and Sewage Treatment Sector to Dominate the Market.
7. Are there any restraints impacting market growth?
4.; Availability of Cheap and Alternative Pumps.
8. Can you provide examples of recent developments in the market?
Apr 2022: SEKO, manufacturer of chemical dosing pumps and metering, announced the upgradation of its WareDose warewash dosing pump systems to include an integrated Wi-Fi hub, enabling operators to connect to their systems 24/7 via smartphone.
9. What pricing options are available for accessing the report?
Pricing options include single-user, multi-user, and enterprise licenses priced at USD 4750, USD 5250, and USD 8750 respectively.
10. Is the market size provided in terms of value or volume?
The market size is provided in terms of value, measured in Million and volume, measured in K Tons.
11. Are there any specific market keywords associated with the report?
Yes, the market keyword associated with the report is "Dosing System Industry," which aids in identifying and referencing the specific market segment covered.
12. How do I determine which pricing option suits my needs best?
The pricing options vary based on user requirements and access needs. Individual users may opt for single-user licenses, while businesses requiring broader access may choose multi-user or enterprise licenses for cost-effective access to the report.
13. Are there any additional resources or data provided in the Dosing System Industry report?
While the report offers comprehensive insights, it's advisable to review the specific contents or supplementary materials provided to ascertain if additional resources or data are available.
14. How can I stay updated on further developments or reports in the Dosing System Industry?
To stay informed about further developments, trends, and reports in the Dosing System Industry, consider subscribing to industry newsletters, following relevant companies and organizations, or regularly checking reputable industry news sources and publications.
Methodology
Step 1 - Identification of Relevant Samples Size from Population Database


Step 2 - Approaches for Defining Global Market Size (Value, Volume* & Price*)

Note*: In applicable scenarios
Step 3 - Data Sources
Primary Research
- Web Analytics
- Survey Reports
- Research Institute
- Latest Research Reports
- Opinion Leaders
Secondary Research
- Annual Reports
- White Paper
- Latest Press Release
- Industry Association
- Paid Database
- Investor Presentations

Step 4 - Data Triangulation
Involves using different sources of information in order to increase the validity of a study
These sources are likely to be stakeholders in a program - participants, other researchers, program staff, other community members, and so on.
Then we put all data in single framework & apply various statistical tools to find out the dynamic on the market.
During the analysis stage, feedback from the stakeholder groups would be compared to determine areas of agreement as well as areas of divergence