

Key Insights
The global Electric Bus Charging Infrastructure Market is poised for exceptional growth, projected to reach a substantial market size by 2033. With a remarkable Compound Annual Growth Rate (CAGR) of 19.00%, the market is set to witness significant expansion, driven by a confluence of factors. The increasing adoption of electric buses by public transportation authorities worldwide, coupled with stringent government regulations aimed at reducing emissions and promoting sustainable mobility, are primary catalysts. Furthermore, advancements in charging technology, including faster charging capabilities and smart grid integration, are enhancing the viability and attractiveness of electric bus fleets. The growing environmental consciousness among consumers and policymakers alike is also fueling demand for cleaner transportation solutions, directly benefiting the electric bus charging infrastructure sector. Significant investments in public transportation electrification projects and the development of dedicated charging hubs are further accelerating market penetration.
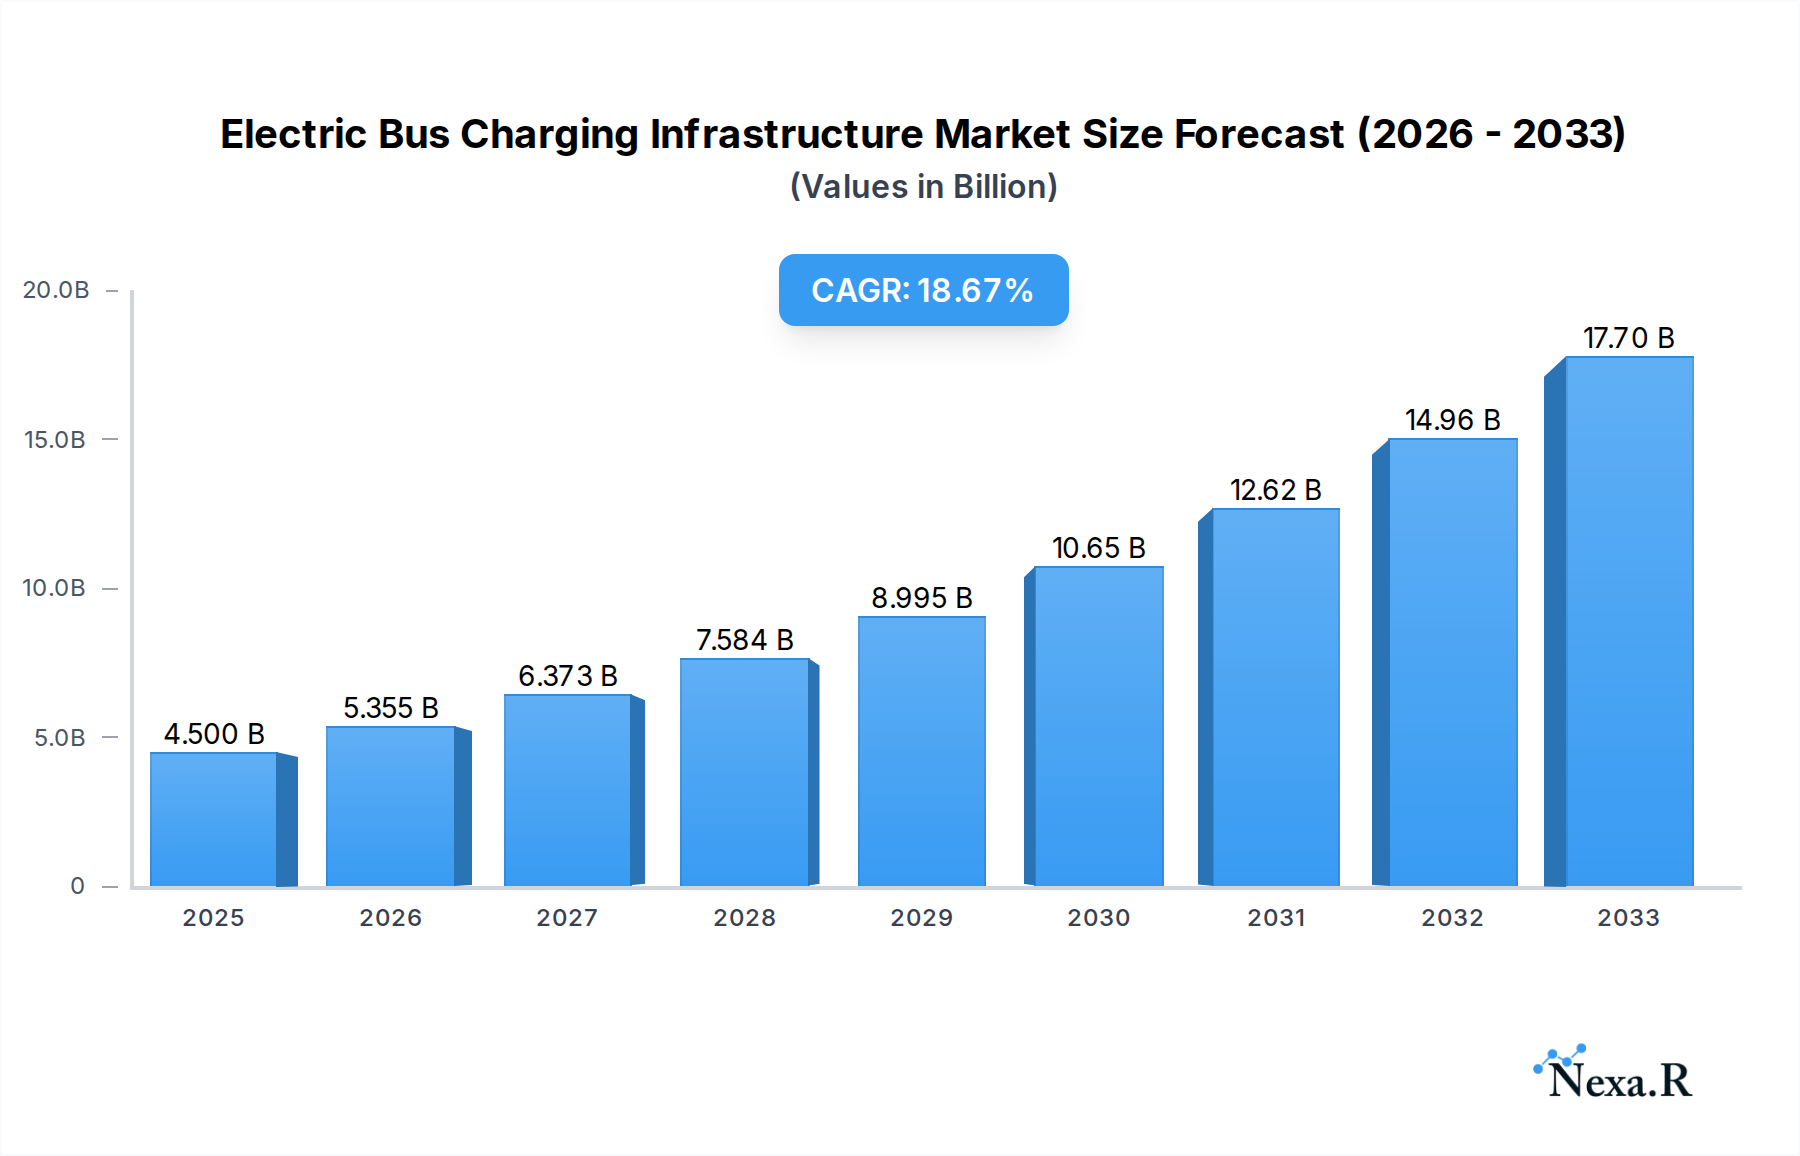
Electric Bus Charging Infrastructure Market Market Size (In Billion)
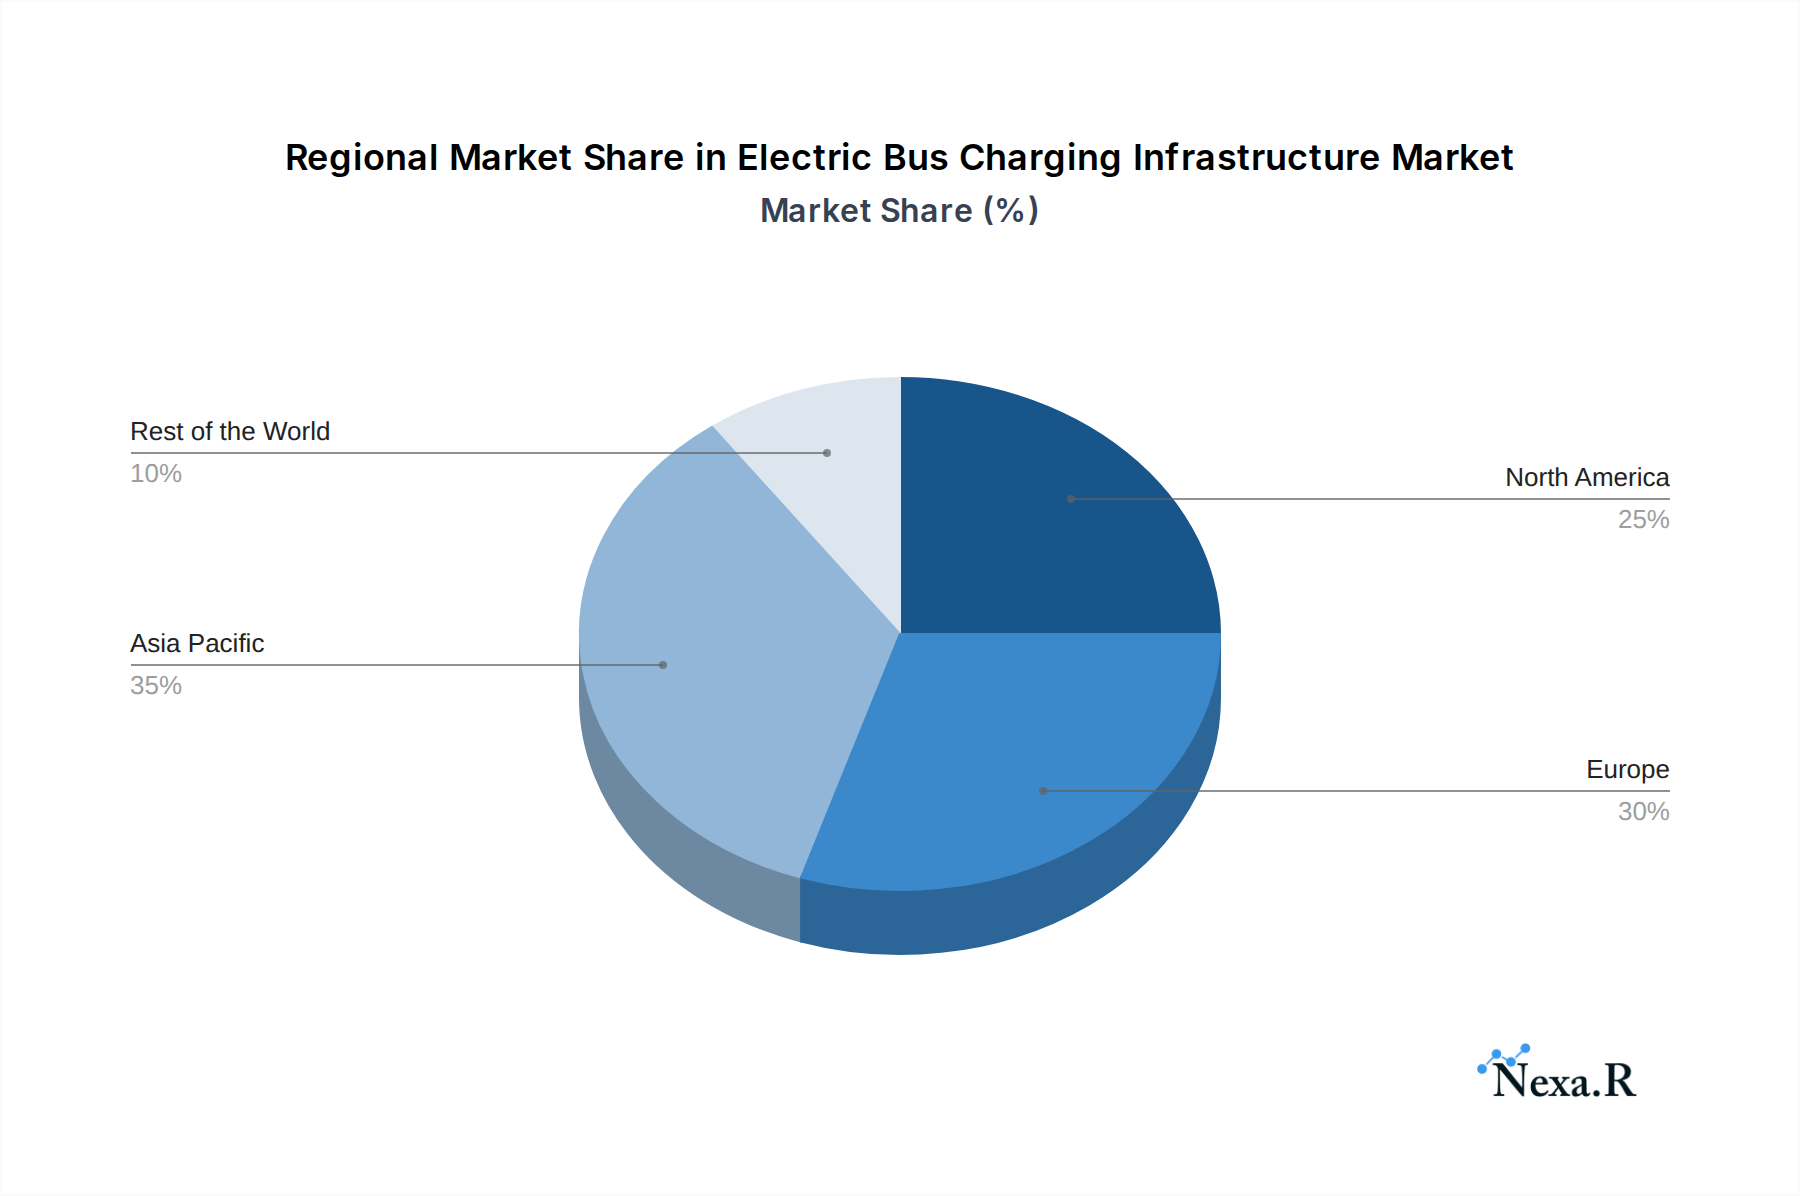
The market is segmented by charging type, with Plug-in Charging and Overhead Charging representing key areas of development. Leading players like BYD Auto Co Ltd, Proterra Inc, and ABB Ltd are at the forefront of innovation, offering comprehensive charging solutions and contributing to the market's robust growth trajectory. Geographically, Asia Pacific, particularly China, is expected to dominate the market due to its proactive stance on EV adoption and substantial government incentives. North America and Europe are also significant contributors, driven by supportive policies and a growing number of fleet operators transitioning to electric buses. While the market benefits from strong growth drivers such as environmental mandates and technological advancements, challenges such as the high upfront cost of charging infrastructure and the need for grid upgrades require strategic planning and investment to ensure continued expansion and widespread adoption of electric bus charging solutions.

Electric Bus Charging Infrastructure Market Company Market Share
Comprehensive Report on the Electric Bus Charging Infrastructure Market: Global Analysis and Future Projections (2019-2033)
This in-depth report provides a thorough analysis of the global Electric Bus Charging Infrastructure Market, encompassing its current landscape, historical trends, and future projections from 2019 to 2033. The study focuses on the burgeoning demand for sustainable public transportation solutions, driven by stringent environmental regulations and a growing commitment to decarbonization. We delve into the intricate dynamics of the market, exploring technological advancements, competitive strategies, and the evolving needs of end-users. This report is an indispensable resource for industry stakeholders, including electric bus manufacturers, charging infrastructure suppliers, fleet operators, government agencies, and investors seeking to understand and capitalize on the immense opportunities within this rapidly expanding sector.
Electric Bus Charging Infrastructure Market Market Dynamics & Structure
The Electric Bus Charging Infrastructure Market is characterized by a dynamic interplay of technological innovation, evolving regulatory frameworks, and intense competition. Market concentration is influenced by the presence of established players and the emergence of new entrants, particularly in the electric charging infrastructure supply segment. Technological innovation is a primary driver, with a continuous push towards faster charging speeds, enhanced interoperability, and smarter grid integration solutions. Regulatory frameworks globally are increasingly mandating the transition to electric fleets, significantly boosting demand for charging infrastructure. Competitive product substitutes, while present in the form of less advanced charging technologies, are steadily being outpaced by the efficiency and sustainability of electric solutions. End-user demographics are shifting towards municipalities and public transport authorities prioritizing environmental sustainability and operational cost savings. Mergers and Acquisitions (M&A) trends are active, with larger companies acquiring innovative startups to expand their technological capabilities and market reach. For instance, the CHF 200 million pre-IPO private placement by ABB E-Mobility in November 2022 highlights significant investor confidence and the pursuit of both organic and inorganic growth.
- Market Concentration: Moderate to high, with key players like ABB Ltd., ChargePoint Inc., and Siemens AG holding significant market shares, yet with room for agile new entrants.
- Technological Innovation Drivers: Advancements in battery technology, grid management, and smart charging protocols.
- Regulatory Frameworks: Government mandates for fleet electrification, emission reduction targets, and public funding initiatives.
- Competitive Product Substitutes: Primarily fossil-fuel-based charging solutions, facing increasing obsolescence.
- End-User Demographics: Municipalities, public transport agencies, and large fleet operators.
- M&A Trends: Strategic acquisitions to gain market share, technological expertise, and expand product portfolios. Deal volumes are expected to increase as the market matures.
Electric Bus Charging Infrastructure Market Growth Trends & Insights
The Electric Bus Charging Infrastructure Market is poised for remarkable growth, projected to expand significantly driven by increasing global adoption rates of electric buses. Market size evolution is characterized by a consistent upward trajectory, fueled by government incentives and the inherent benefits of electric mobility. Adoption rates are accelerating as cities and regions worldwide commit to electrifying their public transport fleets, driven by mandates and the pursuit of cleaner air. Technological disruptions, such as the development of ultra-fast charging and Vehicle-to-Grid (V2G) capabilities, are further enhancing the appeal and practicality of electric bus deployments. Consumer behavior shifts are evident, with a greater public demand for eco-friendly transportation options, influencing policy decisions and investment in green infrastructure. The base year 2025 is projected to be a pivotal year, marking a substantial surge in infrastructure deployment. The forecast period of 2025–2033 anticipates a compound annual growth rate (CAGR) of approximately 25-30%, with market penetration of electric buses expected to reach over 50% in key developed economies by 2033. The historical period 2019–2024 has laid the groundwork, demonstrating steady growth and technological refinement, setting the stage for exponential expansion.
Dominant Regions, Countries, or Segments in Electric Bus Charging Infrastructure Market
Within the Electric Bus Charging Infrastructure Market, Plug-in Charging currently dominates, owing to its established technology, scalability, and diverse application across various fleet sizes and operational needs. This segment benefits from a wide array of charging solutions, from depot charging to on-route charging, catering to the varied operational requirements of electric bus fleets. Key drivers for the dominance of Plug-in Charging include its relatively lower initial investment costs compared to some advanced Overhead Charging systems, and its proven reliability in large-scale deployments. Major economic policies enacted by governments worldwide, such as subsidies for electric vehicle purchases and charging infrastructure development, significantly bolster the growth of this segment. For example, European Union directives and North American federal and state initiatives are actively promoting the electrification of public transportation. Infrastructure development, including the expansion of electrical grids and the establishment of charging hubs, plays a critical role in facilitating plug-in charging solutions.
China has emerged as a dominant country in the Electric Bus Charging Infrastructure Market, driven by aggressive government policies, massive domestic manufacturing capabilities, and a substantial number of electric bus deployments. The sheer scale of its urbanization and commitment to environmental goals has propelled it to the forefront of this sector. Other significant regions include Europe, particularly Norway, Sweden, and Germany, which have ambitious targets for fleet electrification and supportive regulatory environments. North America, with the US and Canada, is also witnessing accelerated growth due to increasing climate change awareness and evolving public transit strategies.
- Dominant Charging Type: Plug-in Charging, accounting for an estimated 70-75% of the market share in 2025.
- Key Drivers for Plug-in Charging Dominance:
- Technological maturity and reliability.
- Cost-effectiveness for diverse fleet sizes.
- Wide range of charging solutions available.
- Supportive government policies and incentives.
- Established grid integration capabilities.
- Dominant Region: Asia Pacific (primarily China), holding an estimated 40-45% market share in 2025.
- Key Countries Driving Growth: China, United States, Germany, United Kingdom, France, Norway, Sweden.
- Growth Potential: Significant for Overhead Charging as technology advances and costs decrease, particularly for high-utilization bus depots.
Electric Bus Charging Infrastructure Market Product Landscape
The product landscape of the Electric Bus Charging Infrastructure Market is rapidly evolving, driven by innovations aimed at enhancing efficiency, reliability, and user experience. Current offerings include a spectrum of AC and DC fast chargers, catering to different charging needs and speeds. Smart charging solutions are gaining prominence, enabling optimized energy management, grid integration, and remote monitoring capabilities. Product innovations are focused on increasing charging speeds, improving power output (e.g., from 50 kW to over 300 kW for DC fast chargers), and developing more robust and weather-resistant hardware. Unique selling propositions often lie in the integration of software platforms for fleet management, seamless payment systems, and predictive maintenance. Technological advancements in areas like inductive (wireless) charging are also emerging, promising greater convenience and reduced wear on connectors.
Key Drivers, Barriers & Challenges in Electric Bus Charging Infrastructure Market
The Electric Bus Charging Infrastructure Market is propelled by several key drivers, including stringent government regulations mandating fleet electrification, the growing imperative for environmental sustainability, and the long-term operational cost savings associated with electric buses. Technological advancements in battery technology and charging efficiency further bolster adoption.
- Key Drivers:
- Government mandates and incentives.
- Environmental sustainability goals.
- Reduced operating and maintenance costs.
- Advancements in battery and charging technology.
- Growing public demand for cleaner transport.
Conversely, the market faces significant barriers and challenges. High upfront capital investment for charging infrastructure remains a concern, alongside grid capacity limitations in certain regions. The availability of suitable charging locations and the complexity of site planning and installation also pose hurdles. Supply chain disruptions and the need for standardization across different charging protocols and connectors can create integration issues.
- Key Barriers & Challenges:
- High initial investment costs.
- Grid infrastructure limitations and upgrades.
- Availability of suitable charging locations.
- Supply chain vulnerabilities for key components.
- Need for industry-wide standardization.
- Regulatory complexities and permitting processes.
Emerging Opportunities in Electric Bus Charging Infrastructure Market
Emerging opportunities in the Electric Bus Charging Infrastructure Market are abundant, particularly in the development of innovative charging solutions and the expansion into underserved regions. The growth of V2G technology presents a significant opportunity to leverage electric buses as mobile energy storage units, supporting grid stability and generating revenue. The development of modular and scalable charging systems catering to smaller transit agencies or niche applications is another area of potential. Furthermore, the increasing focus on digitalization and the Internet of Things (IoT) within fleet management opens avenues for integrated charging and operational data analytics services. Untapped markets in developing economies, with growing urbanization and a desire to leapfrog fossil-fuel-dependent infrastructure, also represent substantial future growth prospects.
Growth Accelerators in the Electric Bus Charging Infrastructure Market Industry
The long-term growth of the Electric Bus Charging Infrastructure Market is being significantly accelerated by several key catalysts. Strategic partnerships between charging infrastructure providers, electric bus manufacturers, and energy utilities are crucial for seamless integration and optimized energy management. Continued technological breakthroughs in battery density, charging speed, and grid integration solutions will further reduce operational barriers and enhance the attractiveness of electric buses. Government-backed initiatives, including long-term funding commitments for charging infrastructure deployment and supportive policy frameworks, are vital for sustained market expansion. The increasing demand for smart city solutions and integrated urban mobility also acts as a growth accelerator, positioning electric buses and their charging infrastructure as integral components of sustainable urban ecosystems.
Key Players Shaping the Electric Bus Charging Infrastructure Market Market
- ABB Ltd.
- ChargePoint Inc.
- Siemens AG
- Schneider Electric SE
- ALSTOM
- Zhengzhou Yutong Bus Co Ltd
- Proterra Inc
- Mercedes-Benz AG
- Traton SE
- IVECO S p A
- NFI Group Inc.
- BYD Auto Co Ltd
- Heliox Energy
- Starline Holdings LLC
- EV Solutions (Webasto)
- SemaConnect Inc
- Vital EV Solutions
Notable Milestones in Electric Bus Charging Infrastructure Market Sector
- November 2022: ABB E-Mobility, the electric vehicle charging solutions subsidiary of ABB Ltd., successfully raised CHF 200 million (USD 214 million) in a pre-IPO private placement. This capital infusion will support the company's growth strategy, including mergers and acquisitions, underscoring significant investor confidence and strategic expansion plans.
- September 2022: ABB E-Mobility commenced manufacturing operations in Columbia, South Carolina. This multimillion-dollar investment is expected to create over 100 new jobs and will enable the production of up to 10,000 electric vehicle chargers annually (20 kW to 180 kW), designed for fleets, school buses, and public charging stations, complying with the Buy America Act.
- August 2022: Siemens and MAHLE Group announced a collaboration to develop and test cutting-edge wireless charging systems for electric vehicles. This partnership aims to establish technological standards for inductive charging and drive progress within relevant standardization bodies.
In-Depth Electric Bus Charging Infrastructure Market Market Outlook
The Electric Bus Charging Infrastructure Market is on an accelerated growth trajectory, driven by a confluence of factors positioning it for substantial expansion. The ongoing global push towards decarbonization, coupled with increasingly stringent emissions regulations and a heightened awareness of climate change, forms the bedrock of this optimistic outlook. Growth accelerators such as advancements in battery technology promising longer ranges and faster charging times, and the development of smart grid integration solutions that optimize energy consumption and cost, are pivotal. Strategic partnerships between charging infrastructure providers, electric bus manufacturers, and energy utilities are fostering a more integrated and efficient ecosystem. The expanding smart city initiatives worldwide further embed electric buses and their charging networks as crucial components of modern, sustainable urban planning, signaling robust long-term market potential and exciting strategic opportunities for all stakeholders.
Electric Bus Charging Infrastructure Market Segmentation
-
1. Charging Type
- 1.1. Plug-in Charging
- 1.2. Overhead Charging
Electric Bus Charging Infrastructure Market Segmentation By Geography
-
1. North America
- 1.1. United States
- 1.2. Canada
- 1.3. Rest of North America
-
2. Europe
- 2.1. Germany
- 2.2. United Kingdom
- 2.3. France
- 2.4. Italy
- 2.5. Spain
- 2.6. Rest of Europe
-
3. Asia Pacific
- 3.1. China
- 3.2. India
- 3.3. Japan
- 3.4. South Korea
- 3.5. Rest of Asia Pacific
-
4. Rest of the World
- 4.1. South America
- 4.2. Middle East and Africa
Electric Bus Charging Infrastructure Market Regional Market Share
Geographic Coverage of Electric Bus Charging Infrastructure Market
Electric Bus Charging Infrastructure Market REPORT HIGHLIGHTS
| Aspects | Details |
|---|---|
| Study Period | 2020-2034 |
| Base Year | 2025 |
| Estimated Year | 2026 |
| Forecast Period | 2026-2034 |
| Historical Period | 2020-2025 |
| Growth Rate | CAGR of 19.00% from 2020-2034 |
| Segmentation |
|
Table of Contents
- 1. Introduction
- 1.1. Research Scope
- 1.2. Market Segmentation
- 1.3. Research Objective
- 1.4. Definitions and Assumptions
- 2. Executive Summary
- 2.1. Market Snapshot
- 3. Market Dynamics
- 3.1. Market Drivers
- 3.2. Market Restrains
- 3.3. Market Trends
- 3.4. Market Opportunities
- 4. Market Factor Analysis
- 4.1. Porters Five Forces
- 4.1.1. Bargaining Power of Suppliers
- 4.1.2. Bargaining Power of Buyers
- 4.1.3. Threat of New Entrants
- 4.1.4. Threat of Substitutes
- 4.1.5. Competitive Rivalry
- 4.2. PESTEL analysis
- 4.3. BCG Analysis
- 4.3.1. Stars (High Growth, High Market Share)
- 4.3.2. Cash Cows (Low Growth, High Market Share)
- 4.3.3. Question Mark (High Growth, Low Market Share)
- 4.3.4. Dogs (Low Growth, Low Market Share)
- 4.4. Ansoff Matrix Analysis
- 4.5. Supply Chain Analysis
- 4.6. Regulatory Landscape
- 4.7. Current Market Potential and Opportunity Assessment (TAM–SAM–SOM Framework)
- 4.8. NRP Analyst Note
- 4.1. Porters Five Forces
- 5. Market Analysis, Insights and Forecast 2021-2033
- 5.1. Market Analysis, Insights and Forecast - by Charging Type
- 5.1.1. Plug-in Charging
- 5.1.2. Overhead Charging
- 5.2. Market Analysis, Insights and Forecast - by Region
- 5.2.1. North America
- 5.2.2. Europe
- 5.2.3. Asia Pacific
- 5.2.4. Rest of the World
- 5.1. Market Analysis, Insights and Forecast - by Charging Type
- 6. Global Electric Bus Charging Infrastructure Market Analysis, Insights and Forecast, 2021-2033
- 6.1. Market Analysis, Insights and Forecast - by Charging Type
- 6.1.1. Plug-in Charging
- 6.1.2. Overhead Charging
- 6.1. Market Analysis, Insights and Forecast - by Charging Type
- 7. North America Electric Bus Charging Infrastructure Market Analysis, Insights and Forecast, 2020-2032
- 7.1. Market Analysis, Insights and Forecast - by Charging Type
- 7.1.1. Plug-in Charging
- 7.1.2. Overhead Charging
- 7.1. Market Analysis, Insights and Forecast - by Charging Type
- 8. Europe Electric Bus Charging Infrastructure Market Analysis, Insights and Forecast, 2020-2032
- 8.1. Market Analysis, Insights and Forecast - by Charging Type
- 8.1.1. Plug-in Charging
- 8.1.2. Overhead Charging
- 8.1. Market Analysis, Insights and Forecast - by Charging Type
- 9. Asia Pacific Electric Bus Charging Infrastructure Market Analysis, Insights and Forecast, 2020-2032
- 9.1. Market Analysis, Insights and Forecast - by Charging Type
- 9.1.1. Plug-in Charging
- 9.1.2. Overhead Charging
- 9.1. Market Analysis, Insights and Forecast - by Charging Type
- 10. Rest of the World Electric Bus Charging Infrastructure Market Analysis, Insights and Forecast, 2020-2032
- 10.1. Market Analysis, Insights and Forecast - by Charging Type
- 10.1.1. Plug-in Charging
- 10.1.2. Overhead Charging
- 10.1. Market Analysis, Insights and Forecast - by Charging Type
- 11. Competitive Analysis
- 11.1. Company Profiles
- 11.1.1 10 Starline Holdings LLC
- 11.1.1.1. Company Overview
- 11.1.1.2. Products
- 11.1.1.3. Company Financials
- 11.1.1.4. SWOT Analysis
- 11.1.2 Electric Bus Manufacturers
- 11.1.2.1. Company Overview
- 11.1.2.2. Products
- 11.1.2.3. Company Financials
- 11.1.2.4. SWOT Analysis
- 11.1.3 2 Proterra Inc (also an electric bus manufacturer)
- 11.1.3.1. Company Overview
- 11.1.3.2. Products
- 11.1.3.3. Company Financials
- 11.1.3.4. SWOT Analysis
- 11.1.4 11 EV Solutions (Webasto)
- 11.1.4.1. Company Overview
- 11.1.4.2. Products
- 11.1.4.3. Company Financials
- 11.1.4.4. SWOT Analysis
- 11.1.5 4 AB Volvo
- 11.1.5.1. Company Overview
- 11.1.5.2. Products
- 11.1.5.3. Company Financials
- 11.1.5.4. SWOT Analysis
- 11.1.6 3 ChargePoint Inc
- 11.1.6.1. Company Overview
- 11.1.6.2. Products
- 11.1.6.3. Company Financials
- 11.1.6.4. SWOT Analysis
- 11.1.7 1 BYD Auto Co Ltd
- 11.1.7.1. Company Overview
- 11.1.7.2. Products
- 11.1.7.3. Company Financials
- 11.1.7.4. SWOT Analysis
- 11.1.8 1 ABB Ltd
- 11.1.8.1. Company Overview
- 11.1.8.2. Products
- 11.1.8.3. Company Financials
- 11.1.8.4. SWOT Analysis
- 11.1.9 8 Heliox Energy
- 11.1.9.1. Company Overview
- 11.1.9.2. Products
- 11.1.9.3. Company Financials
- 11.1.9.4. SWOT Analysis
- 11.1.10 6 ALSTOM
- 11.1.10.1. Company Overview
- 11.1.10.2. Products
- 11.1.10.3. Company Financials
- 11.1.10.4. SWOT Analysis
- 11.1.11 5 Zhengzhou Yutong Bus Co Ltd
- 11.1.11.1. Company Overview
- 11.1.11.2. Products
- 11.1.11.3. Company Financials
- 11.1.11.4. SWOT Analysis
- 11.1.12 7 SemaConnect Inc
- 11.1.12.1. Company Overview
- 11.1.12.2. Products
- 11.1.12.3. Company Financials
- 11.1.12.4. SWOT Analysis
- 11.1.13 2 Mercedes-Benz AG
- 11.1.13.1. Company Overview
- 11.1.13.2. Products
- 11.1.13.3. Company Financials
- 11.1.13.4. SWOT Analysis
- 11.1.14 3 Traton SE
- 11.1.14.1. Company Overview
- 11.1.14.2. Products
- 11.1.14.3. Company Financials
- 11.1.14.4. SWOT Analysis
- 11.1.15 4 Siemens AG
- 11.1.15.1. Company Overview
- 11.1.15.2. Products
- 11.1.15.3. Company Financials
- 11.1.15.4. SWOT Analysis
- 11.1.16 7 NFI Group Inc
- 11.1.16.1. Company Overview
- 11.1.16.2. Products
- 11.1.16.3. Company Financials
- 11.1.16.4. SWOT Analysis
- 11.1.17 5 Schneider Electric SE
- 11.1.17.1. Company Overview
- 11.1.17.2. Products
- 11.1.17.3. Company Financials
- 11.1.17.4. SWOT Analysis
- 11.1.18 6 IVECO S p A
- 11.1.18.1. Company Overview
- 11.1.18.2. Products
- 11.1.18.3. Company Financials
- 11.1.18.4. SWOT Analysis
- 11.1.19 9 Vital EV Solutions
- 11.1.19.1. Company Overview
- 11.1.19.2. Products
- 11.1.19.3. Company Financials
- 11.1.19.4. SWOT Analysis
- 11.1.20 Electric Charging Infrastructure Suppliers
- 11.1.20.1. Company Overview
- 11.1.20.2. Products
- 11.1.20.3. Company Financials
- 11.1.20.4. SWOT Analysis
- 11.1.1 10 Starline Holdings LLC
- 11.2. Market Entropy
- 11.2.1 Company's Key Areas Served
- 11.2.2 Recent Developments
- 11.3. Company Market Share Analysis 2025
- 11.3.1 Top 5 Companies Market Share Analysis
- 11.3.2 Top 3 Companies Market Share Analysis
- 11.4. List of Potential Customers
- 12. Research Methodology
List of Figures
- Figure 1: Global Electric Bus Charging Infrastructure Market Revenue Breakdown (Million, %) by Region 2025 & 2033
- Figure 2: North America Electric Bus Charging Infrastructure Market Revenue (Million), by Charging Type 2025 & 2033
- Figure 3: North America Electric Bus Charging Infrastructure Market Revenue Share (%), by Charging Type 2025 & 2033
- Figure 4: North America Electric Bus Charging Infrastructure Market Revenue (Million), by Country 2025 & 2033
- Figure 5: North America Electric Bus Charging Infrastructure Market Revenue Share (%), by Country 2025 & 2033
- Figure 6: Europe Electric Bus Charging Infrastructure Market Revenue (Million), by Charging Type 2025 & 2033
- Figure 7: Europe Electric Bus Charging Infrastructure Market Revenue Share (%), by Charging Type 2025 & 2033
- Figure 8: Europe Electric Bus Charging Infrastructure Market Revenue (Million), by Country 2025 & 2033
- Figure 9: Europe Electric Bus Charging Infrastructure Market Revenue Share (%), by Country 2025 & 2033
- Figure 10: Asia Pacific Electric Bus Charging Infrastructure Market Revenue (Million), by Charging Type 2025 & 2033
- Figure 11: Asia Pacific Electric Bus Charging Infrastructure Market Revenue Share (%), by Charging Type 2025 & 2033
- Figure 12: Asia Pacific Electric Bus Charging Infrastructure Market Revenue (Million), by Country 2025 & 2033
- Figure 13: Asia Pacific Electric Bus Charging Infrastructure Market Revenue Share (%), by Country 2025 & 2033
- Figure 14: Rest of the World Electric Bus Charging Infrastructure Market Revenue (Million), by Charging Type 2025 & 2033
- Figure 15: Rest of the World Electric Bus Charging Infrastructure Market Revenue Share (%), by Charging Type 2025 & 2033
- Figure 16: Rest of the World Electric Bus Charging Infrastructure Market Revenue (Million), by Country 2025 & 2033
- Figure 17: Rest of the World Electric Bus Charging Infrastructure Market Revenue Share (%), by Country 2025 & 2033
List of Tables
- Table 1: Global Electric Bus Charging Infrastructure Market Revenue Million Forecast, by Charging Type 2020 & 2033
- Table 2: Global Electric Bus Charging Infrastructure Market Revenue Million Forecast, by Region 2020 & 2033
- Table 3: Global Electric Bus Charging Infrastructure Market Revenue Million Forecast, by Charging Type 2020 & 2033
- Table 4: Global Electric Bus Charging Infrastructure Market Revenue Million Forecast, by Country 2020 & 2033
- Table 5: United States Electric Bus Charging Infrastructure Market Revenue (Million) Forecast, by Application 2020 & 2033
- Table 6: Canada Electric Bus Charging Infrastructure Market Revenue (Million) Forecast, by Application 2020 & 2033
- Table 7: Rest of North America Electric Bus Charging Infrastructure Market Revenue (Million) Forecast, by Application 2020 & 2033
- Table 8: Global Electric Bus Charging Infrastructure Market Revenue Million Forecast, by Charging Type 2020 & 2033
- Table 9: Global Electric Bus Charging Infrastructure Market Revenue Million Forecast, by Country 2020 & 2033
- Table 10: Germany Electric Bus Charging Infrastructure Market Revenue (Million) Forecast, by Application 2020 & 2033
- Table 11: United Kingdom Electric Bus Charging Infrastructure Market Revenue (Million) Forecast, by Application 2020 & 2033
- Table 12: France Electric Bus Charging Infrastructure Market Revenue (Million) Forecast, by Application 2020 & 2033
- Table 13: Italy Electric Bus Charging Infrastructure Market Revenue (Million) Forecast, by Application 2020 & 2033
- Table 14: Spain Electric Bus Charging Infrastructure Market Revenue (Million) Forecast, by Application 2020 & 2033
- Table 15: Rest of Europe Electric Bus Charging Infrastructure Market Revenue (Million) Forecast, by Application 2020 & 2033
- Table 16: Global Electric Bus Charging Infrastructure Market Revenue Million Forecast, by Charging Type 2020 & 2033
- Table 17: Global Electric Bus Charging Infrastructure Market Revenue Million Forecast, by Country 2020 & 2033
- Table 18: China Electric Bus Charging Infrastructure Market Revenue (Million) Forecast, by Application 2020 & 2033
- Table 19: India Electric Bus Charging Infrastructure Market Revenue (Million) Forecast, by Application 2020 & 2033
- Table 20: Japan Electric Bus Charging Infrastructure Market Revenue (Million) Forecast, by Application 2020 & 2033
- Table 21: South Korea Electric Bus Charging Infrastructure Market Revenue (Million) Forecast, by Application 2020 & 2033
- Table 22: Rest of Asia Pacific Electric Bus Charging Infrastructure Market Revenue (Million) Forecast, by Application 2020 & 2033
- Table 23: Global Electric Bus Charging Infrastructure Market Revenue Million Forecast, by Charging Type 2020 & 2033
- Table 24: Global Electric Bus Charging Infrastructure Market Revenue Million Forecast, by Country 2020 & 2033
- Table 25: South America Electric Bus Charging Infrastructure Market Revenue (Million) Forecast, by Application 2020 & 2033
- Table 26: Middle East and Africa Electric Bus Charging Infrastructure Market Revenue (Million) Forecast, by Application 2020 & 2033
Frequently Asked Questions
1. What is the projected Compound Annual Growth Rate (CAGR) of the Electric Bus Charging Infrastructure Market?
The projected CAGR is approximately 19.00%.
2. Which companies are prominent players in the Electric Bus Charging Infrastructure Market?
Key companies in the market include 10 Starline Holdings LLC, Electric Bus Manufacturers, 2 Proterra Inc (also an electric bus manufacturer), 11 EV Solutions (Webasto), 4 AB Volvo, 3 ChargePoint Inc, 1 BYD Auto Co Ltd, 1 ABB Ltd, 8 Heliox Energy, 6 ALSTOM, 5 Zhengzhou Yutong Bus Co Ltd, 7 SemaConnect Inc, 2 Mercedes-Benz AG, 3 Traton SE, 4 Siemens AG, 7 NFI Group Inc, 5 Schneider Electric SE, 6 IVECO S p A, 9 Vital EV Solutions, Electric Charging Infrastructure Suppliers.
3. What are the main segments of the Electric Bus Charging Infrastructure Market?
The market segments include Charging Type.
4. Can you provide details about the market size?
The market size is estimated to be USD 2 Million as of 2022.
5. What are some drivers contributing to market growth?
Rising Adoption of Electric Buses.
6. What are the notable trends driving market growth?
Governmental Efforts to Increase in the Number of Electric Buses Will Boost Overhead Charging Type.
7. Are there any restraints impacting market growth?
High Upfront Investment.
8. Can you provide examples of recent developments in the market?
November 2022: ABB E-Mobility, the electric vehicle charging solutions subsidiary of ABB Ltd., successfully raised CHF 200 million (USD 214 million) in a pre-IPO private placement led by a group of minority investors. The capital infusion will play a crucial role in supporting the company's growth strategy, which includes pursuing both organic and inorganic opportunities, such as potential mergers and acquisitions. The transaction is expected to be finalized in the fourth quarter of 2022.
9. What pricing options are available for accessing the report?
Pricing options include single-user, multi-user, and enterprise licenses priced at USD 4750, USD 5250, and USD 8750 respectively.
10. Is the market size provided in terms of value or volume?
The market size is provided in terms of value, measured in Million.
11. Are there any specific market keywords associated with the report?
Yes, the market keyword associated with the report is "Electric Bus Charging Infrastructure Market," which aids in identifying and referencing the specific market segment covered.
12. How do I determine which pricing option suits my needs best?
The pricing options vary based on user requirements and access needs. Individual users may opt for single-user licenses, while businesses requiring broader access may choose multi-user or enterprise licenses for cost-effective access to the report.
13. Are there any additional resources or data provided in the Electric Bus Charging Infrastructure Market report?
While the report offers comprehensive insights, it's advisable to review the specific contents or supplementary materials provided to ascertain if additional resources or data are available.
14. How can I stay updated on further developments or reports in the Electric Bus Charging Infrastructure Market?
To stay informed about further developments, trends, and reports in the Electric Bus Charging Infrastructure Market, consider subscribing to industry newsletters, following relevant companies and organizations, or regularly checking reputable industry news sources and publications.
Methodology
Step 1 - Identification of Relevant Samples Size from Population Database


Step 2 - Approaches for Defining Global Market Size (Value, Volume* & Price*)

Note*: In applicable scenarios
Step 3 - Data Sources
Primary Research
- Web Analytics
- Survey Reports
- Research Institute
- Latest Research Reports
- Opinion Leaders
Secondary Research
- Annual Reports
- White Paper
- Latest Press Release
- Industry Association
- Paid Database
- Investor Presentations

Step 4 - Data Triangulation
Involves using different sources of information in order to increase the validity of a study
These sources are likely to be stakeholders in a program - participants, other researchers, program staff, other community members, and so on.
Then we put all data in single framework & apply various statistical tools to find out the dynamic on the market.
During the analysis stage, feedback from the stakeholder groups would be compared to determine areas of agreement as well as areas of divergence