

Key Insights
The Australian taxi industry is poised for significant expansion, projected to reach a market size of AUD 3.73 billion by 2025. This growth is driven by a robust compound annual growth rate (CAGR) of 9.60% during the forecast period of 2025-2033. Key factors fueling this upward trajectory include the increasing adoption of ride-hailing services, a growing demand for convenient and on-demand transportation solutions, and the continuous technological advancements within the sector. The shift towards online booking platforms, facilitated by smartphone penetration and user-friendly applications, is a dominant trend, simplifying the process for both passengers and service providers. Furthermore, the expansion of ride-sharing options is catering to a broader demographic, offering cost-effective and flexible mobility choices.
Taxi Industry Australia Market Size (In Billion)
While the industry benefits from strong growth drivers, potential restraints such as evolving regulatory landscapes and increasing competition from alternative transport models need to be closely monitored. The market is segmented across various service types like ride-hailing and ridesharing, with online booking dominating over offline methods. Vehicle types such as hatchbacks, sedans, and SUVs/MPVs are all integral to meeting diverse consumer needs. Major players like Uber Technologies Inc., ANI Technologies Pvt Ltd (Ola), and Bolt Technology OÜ are at the forefront, alongside established local operators such as Taxi Apps Pty Ltd (GoCatch) and Rydo Taxi, continually innovating to capture market share. Geographically, while North America and Europe represent mature markets, the Asia Pacific region, particularly China and India, along with Oceania (including Australia), are expected to exhibit substantial growth due to their large populations and rapidly developing economies.
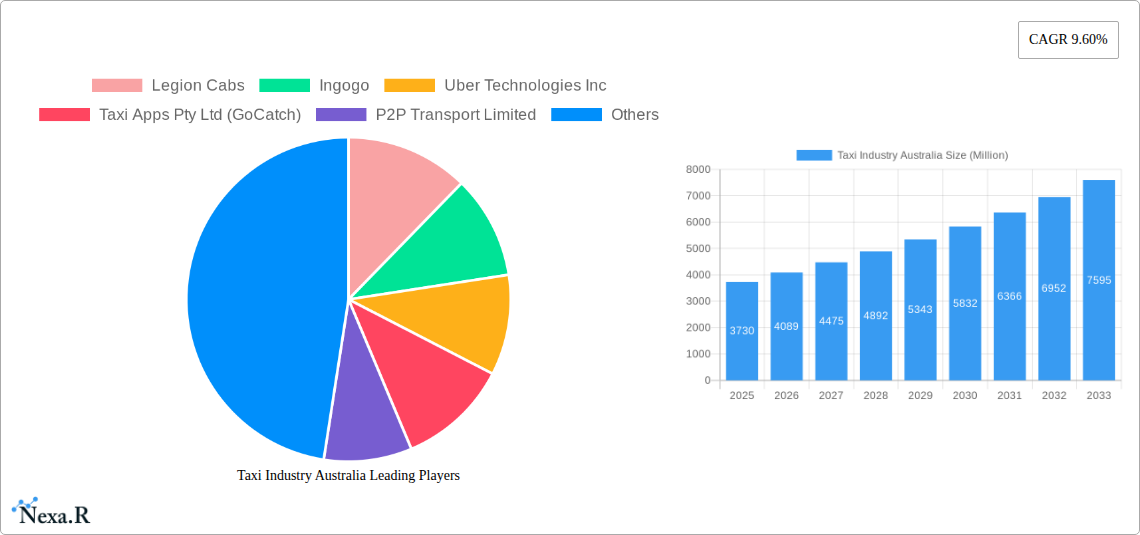
Taxi Industry Australia Company Market Share
Taxi Industry Australia: Market Dynamics, Growth, and Future Outlook (2019-2033)
This comprehensive report delivers an in-depth analysis of the Australian taxi and rideshare market, encompassing the parent taxi industry and its rapidly evolving child market of app-based transportation. With a detailed forecast period from 2025 to 2033, this report leverages historical data from 2019-2024 and a base year of 2025 to provide actionable insights for industry stakeholders. We explore market concentration, technological innovation, regulatory landscapes, competitive dynamics, and consumer trends. This report is crucial for understanding the current state and future trajectory of Australia's taxi and rideshare services, identifying key growth drivers, and navigating emerging opportunities. The analysis incorporates quantitative data in millions of units, offering a clear financial perspective on market evolution.
Taxi Industry Australia Market Dynamics & Structure
The Australian taxi industry is characterized by a dynamic interplay between traditional operators and disruptive app-based services, creating a moderately concentrated market. Technological innovation, particularly in mobile booking platforms and payment solutions, acts as a primary driver, compelling established players to adapt or risk obsolescence. Regulatory frameworks continue to evolve, with ongoing discussions around driver vetting, fare structures, and operational standards impacting both the parent taxi and child rideshare segments. Competitive product substitutes are abundant, ranging from private car ownership to public transport, intensifying the need for service differentiation. End-user demographics are shifting, with younger, tech-savvy populations increasingly favoring app-based solutions for convenience and price transparency. Mergers and acquisitions (M&A) are on the rise as larger entities seek to consolidate market share and expand service offerings. Key M&A trends include platform integrations and the acquisition of smaller taxi companies by larger ride-hailing operators.
- Market Concentration: Moderately concentrated, with a growing dominance of app-based platforms in the child market.
- Technological Innovation Drivers: Mobile booking apps, GPS tracking, dynamic pricing algorithms, and seamless payment integrations.
- Regulatory Frameworks: Evolving legislation on licensing, insurance, safety standards, and driver employment status.
- Competitive Product Substitutes: Public transportation, private vehicle ownership, carpooling services, and micro-mobility solutions.
- End-User Demographics: Growing preference for on-demand services among urban dwellers, millennials, and Gen Z.
- M&A Trends: Consolidation of ride-hailing platforms, acquisitions of traditional taxi fleets, and strategic partnerships for technology integration.
Taxi Industry Australia Growth Trends & Insights
The Australian taxi and rideshare market has witnessed significant expansion, driven by increasing urbanization and evolving consumer preferences for convenient, on-demand transportation. The child market, comprising ride-hailing and ridesharing services, has experienced rapid adoption rates, significantly impacting the traditional taxi sector. This digital transformation has led to a market size evolution that is consistently upward, with projected growth in the tens of billions of Australian dollars. Technological disruptions, such as the integration of artificial intelligence for route optimization and surge pricing, have become commonplace, enhancing operational efficiency and customer experience. Consumer behavior has shifted dramatically, with a growing reliance on mobile applications for booking, payment, and real-time tracking. The market penetration of app-based services is high in major metropolitan areas, while regional penetration is steadily increasing. Key growth metrics include a projected Compound Annual Growth Rate (CAGR) of xx% over the forecast period, reflecting a robust and expanding market. The overall market value is estimated to be in the range of $20,000 - $30,000 Million units in 2025, with substantial growth anticipated.
Dominant Regions, Countries, or Segments in Taxi Industry Australia
Ride Hailing emerges as the dominant segment within the Australian taxi and rideshare landscape, driving significant market growth. This dominance is particularly pronounced in major metropolitan hubs like Sydney, Melbourne, Brisbane, Perth, and Adelaide, where a high population density, coupled with a strong demand for convenient and flexible transportation, fuels its expansion. The online booking type is intrinsically linked to the success of ride-hailing, as the entire user experience revolves around seamless app-based transactions.
Leading Segment: Ride Hailing
- Market Share: Estimated to command over 70% of the total market value by 2025.
- Key Drivers: Urbanization, busy lifestyles, demand for on-demand services, and the proliferation of smartphones.
- Geographical Concentration: Strongest in New South Wales and Victoria, followed by Queensland and Western Australia.
- Technological Integration: Advanced GPS, real-time tracking, dynamic pricing, and integrated payment systems are key enablers.
- Parent/Child Market Interaction: Ride-hailing platforms act as the primary engine of the child market, often incorporating elements of traditional taxi services or directly competing with them.
Dominant Booking Type: Online Booking
- Market Penetration: Exceeding 85% in urban areas.
- Consumer Preference: High demand for convenience, transparency, and immediate booking capabilities.
- Impact on Offline Booking: Traditional offline booking methods are experiencing a decline in relevance, especially for spontaneous travel needs.
- Technology Dependence: Relies heavily on stable internet connectivity and user-friendly mobile interfaces.
Leading Vehicle Type: Sedans
- Market Share: Estimated to represent over 60% of the total vehicle fleet.
- Versatility: Suitable for a wide range of passenger needs, from solo commuters to small groups.
- Cost-Effectiveness: Offers a balance of comfort and operational cost for service providers.
- Growth Potential: While hatchbacks and SUVs/MPVs are gaining traction for specific use cases (e.g., families, group travel), sedans remain the workhorse of the industry.
The underlying economic policies in Australia, focusing on technological adoption and infrastructure development for smart cities, further bolster the growth of these dominant segments. Furthermore, the competitive landscape, with major players like Uber Technologies Inc., Taxi Apps Pty Ltd (GoCatch), and Bolt Technology OÜ actively investing in these areas, reinforces their leading positions. The market potential for ride-hailing and online booking is immense, driven by an ever-increasing digital-native consumer base.
Taxi Industry Australia Product Landscape
The Australian taxi industry is rapidly evolving with innovative product offerings designed to enhance user experience and operational efficiency. Mobile applications now serve as the primary interface, offering features such as real-time vehicle tracking, estimated fare calculation, driver ratings, and in-app payment options. This digital transformation extends to the integration of advanced payment solutions, exemplified by Ingenico and Live Payments' strategic cooperation to equip taxis with seamless payment capabilities. Furthermore, the introduction of electric vehicle fleets, as seen with Uber's Polestar 2 initiative for custom electric rideshares, signifies a commitment to sustainability and future-proofing services. Hybrid models, like GM Cabs' Taxi-Share 2023, are emerging, blending the reliability of traditional taxis with the flexibility of rideshare, demonstrating unique selling propositions in a competitive market.
Key Drivers, Barriers & Challenges in Taxi Industry Australia
Key Drivers:
- Technological Advancements: The widespread adoption of smartphones and GPS technology has revolutionized booking and navigation.
- Urbanization and Population Growth: Increasing density in major cities fuels the demand for convenient transportation.
- Changing Consumer Preferences: A growing preference for on-demand, flexible, and digitally-enabled services.
- Government Initiatives: Support for smart city development and digital infrastructure.
- Growth of the Gig Economy: Providing flexible earning opportunities for drivers.
Barriers & Challenges:
- Regulatory Hurdles: Evolving regulations concerning licensing, safety, and driver status create complexity.
- Intense Competition: Market saturation from numerous ride-hailing platforms and traditional taxi services.
- Driver Shortages and Retention: Maintaining a sufficient and motivated driver pool can be challenging.
- Infrastructure Limitations: Congestion in urban areas can impact service efficiency and delivery times.
- Public Perception and Trust: Ensuring consistent safety and service quality remains crucial for public confidence.
- Economic Downturns: Reduced discretionary spending can impact demand for non-essential travel.
Emerging Opportunities in Taxi Industry Australia
Emerging opportunities in the Australian taxi industry lie in the expansion of specialized services and the adoption of sustainable transportation solutions. The growing demand for last-mile delivery services presents a significant avenue for taxi operators to diversify their revenue streams. Furthermore, the increasing focus on environmental sustainability is creating a strong market for electric vehicle (EV) fleets and integrated charging solutions. Exploring untapped regional markets and developing tailored services for niche demographics, such as seniors or individuals with accessibility needs, also presents promising growth prospects. The integration of AI-powered personalized travel planning and loyalty programs can further enhance customer engagement and retention.
Growth Accelerators in the Taxi Industry Australia Industry
Several catalysts are accelerating the long-term growth of the Australian taxi industry. The continuous innovation in ride-sharing technology, including AI-driven dynamic pricing and route optimization, significantly enhances operational efficiency and profitability. Strategic partnerships between technology providers, vehicle manufacturers, and service operators are crucial for rolling out next-generation mobility solutions. The increasing consumer demand for sustainable transport options, leading to the adoption of electric vehicles, is a major growth accelerator. Moreover, the expansion of ride-hailing services into more regional areas and the development of integrated multimodal transport solutions that combine taxis, public transport, and micro-mobility options will further fuel market growth.
Key Players Shaping the Taxi Industry Australia Market
- Legion Cabs
- Ingogo
- Uber Technologies Inc
- Taxi Apps Pty Ltd (GoCatch)
- P2P Transport Limited
- GM Cabs
- Rydo Taxi
- Bolt Technology OÜ
- A2B Australia Limited
- ANI Technologies Pvt Ltd (Ola)
- (Didi Chuxing) Beijing Xiaoju Technology Co Ltd
Notable Milestones in Taxi Industry Australia Sector
- October 2022: Ingenico and Live Payments announced their cooperation for long-term strategic partnerships to equip retailers and taxis with seamless and convenient payment and commerce solutions.
- October 2022: Uber announced the addition of 500 Polestar 2s from Australia's largest provider of vehicle subscriptions to the rideshare segment, with plans to offer them as the backbone of new electric rideshare from 2023 called Custom Electric for taxi services in Sydney.
- April 2023: GM Cabs announced the official launch of Taxi-Share 2023, a progressive and hybrid taxi service that combines the best of taxis and rideshare under the GM Cabs brand.
In-Depth Taxi Industry Australia Market Outlook
The future of the Australian taxi industry is marked by continued innovation and strategic expansion, promising substantial growth in the coming years. The increasing integration of electric vehicles and the development of sustainable mobility solutions are set to redefine the market's environmental footprint. Further advancements in AI and data analytics will drive greater personalization in customer experiences and optimize operational efficiencies. The growth accelerators identified, including technological breakthroughs and strategic partnerships, will pave the way for a more integrated and user-centric transportation ecosystem. Untapped regional markets and the demand for specialized transportation services present significant opportunities for market players to diversify and capture new revenue streams, solidifying a robust outlook for the sector.
Taxi Industry Australia Segmentation
-
1. Service Type
- 1.1. Ride Hailing
- 1.2. Ridesharing
-
2. Booking Type
- 2.1. Online Booking
- 2.2. Offline Booking
-
3. Vehicle Type
- 3.1. Hatchbacks
- 3.2. Sedans
- 3.3. SUVs/MPVs
Taxi Industry Australia Segmentation By Geography
-
1. North America
- 1.1. United States
- 1.2. Canada
- 1.3. Mexico
-
2. South America
- 2.1. Brazil
- 2.2. Argentina
- 2.3. Rest of South America
-
3. Europe
- 3.1. United Kingdom
- 3.2. Germany
- 3.3. France
- 3.4. Italy
- 3.5. Spain
- 3.6. Russia
- 3.7. Benelux
- 3.8. Nordics
- 3.9. Rest of Europe
-
4. Middle East & Africa
- 4.1. Turkey
- 4.2. Israel
- 4.3. GCC
- 4.4. North Africa
- 4.5. South Africa
- 4.6. Rest of Middle East & Africa
-
5. Asia Pacific
- 5.1. China
- 5.2. India
- 5.3. Japan
- 5.4. South Korea
- 5.5. ASEAN
- 5.6. Oceania
- 5.7. Rest of Asia Pacific
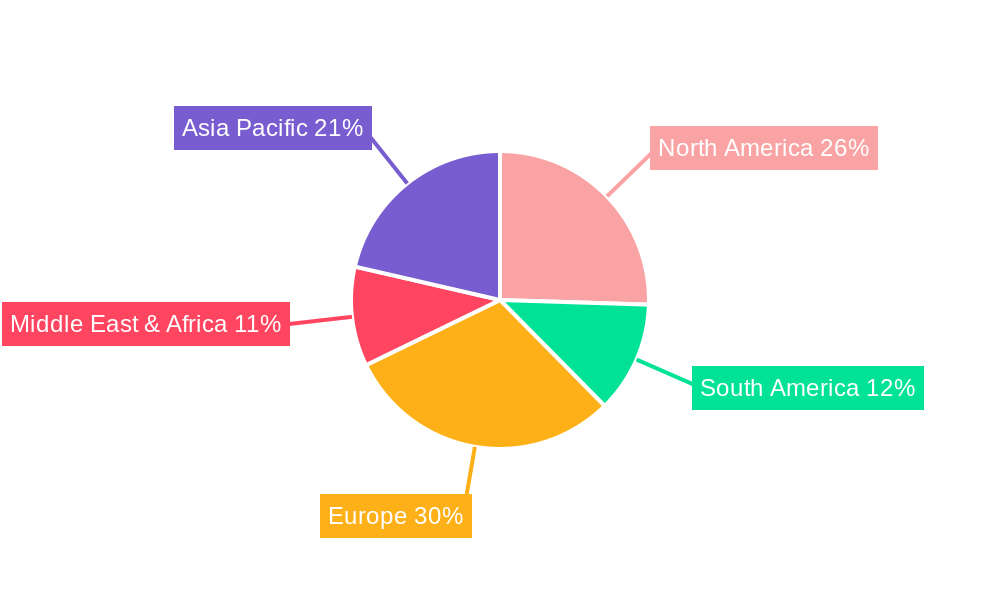
Taxi Industry Australia Regional Market Share
Geographic Coverage of Taxi Industry Australia
Taxi Industry Australia REPORT HIGHLIGHTS
| Aspects | Details |
|---|---|
| Study Period | 2020-2034 |
| Base Year | 2025 |
| Estimated Year | 2026 |
| Forecast Period | 2026-2034 |
| Historical Period | 2020-2025 |
| Growth Rate | CAGR of 9.60% from 2020-2034 |
| Segmentation |
|
Table of Contents
- 1. Introduction
- 1.1. Research Scope
- 1.2. Market Segmentation
- 1.3. Research Objective
- 1.4. Definitions and Assumptions
- 2. Executive Summary
- 2.1. Market Snapshot
- 3. Market Dynamics
- 3.1. Market Drivers
- 3.2. Market Restrains
- 3.3. Market Trends
- 3.4. Market Opportunities
- 4. Market Factor Analysis
- 4.1. Porters Five Forces
- 4.1.1. Bargaining Power of Suppliers
- 4.1.2. Bargaining Power of Buyers
- 4.1.3. Threat of New Entrants
- 4.1.4. Threat of Substitutes
- 4.1.5. Competitive Rivalry
- 4.2. PESTEL analysis
- 4.3. BCG Analysis
- 4.3.1. Stars (High Growth, High Market Share)
- 4.3.2. Cash Cows (Low Growth, High Market Share)
- 4.3.3. Question Mark (High Growth, Low Market Share)
- 4.3.4. Dogs (Low Growth, Low Market Share)
- 4.4. Ansoff Matrix Analysis
- 4.5. Supply Chain Analysis
- 4.6. Regulatory Landscape
- 4.7. Current Market Potential and Opportunity Assessment (TAM–SAM–SOM Framework)
- 4.8. NRP Analyst Note
- 4.1. Porters Five Forces
- 5. Market Analysis, Insights and Forecast 2021-2033
- 5.1. Market Analysis, Insights and Forecast - by Service Type
- 5.1.1. Ride Hailing
- 5.1.2. Ridesharing
- 5.2. Market Analysis, Insights and Forecast - by Booking Type
- 5.2.1. Online Booking
- 5.2.2. Offline Booking
- 5.3. Market Analysis, Insights and Forecast - by Vehicle Type
- 5.3.1. Hatchbacks
- 5.3.2. Sedans
- 5.3.3. SUVs/MPVs
- 5.4. Market Analysis, Insights and Forecast - by Region
- 5.4.1. North America
- 5.4.2. South America
- 5.4.3. Europe
- 5.4.4. Middle East & Africa
- 5.4.5. Asia Pacific
- 5.1. Market Analysis, Insights and Forecast - by Service Type
- 6. Global Taxi Industry Australia Analysis, Insights and Forecast, 2021-2033
- 6.1. Market Analysis, Insights and Forecast - by Service Type
- 6.1.1. Ride Hailing
- 6.1.2. Ridesharing
- 6.2. Market Analysis, Insights and Forecast - by Booking Type
- 6.2.1. Online Booking
- 6.2.2. Offline Booking
- 6.3. Market Analysis, Insights and Forecast - by Vehicle Type
- 6.3.1. Hatchbacks
- 6.3.2. Sedans
- 6.3.3. SUVs/MPVs
- 6.1. Market Analysis, Insights and Forecast - by Service Type
- 7. North America Taxi Industry Australia Analysis, Insights and Forecast, 2020-2032
- 7.1. Market Analysis, Insights and Forecast - by Service Type
- 7.1.1. Ride Hailing
- 7.1.2. Ridesharing
- 7.2. Market Analysis, Insights and Forecast - by Booking Type
- 7.2.1. Online Booking
- 7.2.2. Offline Booking
- 7.3. Market Analysis, Insights and Forecast - by Vehicle Type
- 7.3.1. Hatchbacks
- 7.3.2. Sedans
- 7.3.3. SUVs/MPVs
- 7.1. Market Analysis, Insights and Forecast - by Service Type
- 8. South America Taxi Industry Australia Analysis, Insights and Forecast, 2020-2032
- 8.1. Market Analysis, Insights and Forecast - by Service Type
- 8.1.1. Ride Hailing
- 8.1.2. Ridesharing
- 8.2. Market Analysis, Insights and Forecast - by Booking Type
- 8.2.1. Online Booking
- 8.2.2. Offline Booking
- 8.3. Market Analysis, Insights and Forecast - by Vehicle Type
- 8.3.1. Hatchbacks
- 8.3.2. Sedans
- 8.3.3. SUVs/MPVs
- 8.1. Market Analysis, Insights and Forecast - by Service Type
- 9. Europe Taxi Industry Australia Analysis, Insights and Forecast, 2020-2032
- 9.1. Market Analysis, Insights and Forecast - by Service Type
- 9.1.1. Ride Hailing
- 9.1.2. Ridesharing
- 9.2. Market Analysis, Insights and Forecast - by Booking Type
- 9.2.1. Online Booking
- 9.2.2. Offline Booking
- 9.3. Market Analysis, Insights and Forecast - by Vehicle Type
- 9.3.1. Hatchbacks
- 9.3.2. Sedans
- 9.3.3. SUVs/MPVs
- 9.1. Market Analysis, Insights and Forecast - by Service Type
- 10. Middle East & Africa Taxi Industry Australia Analysis, Insights and Forecast, 2020-2032
- 10.1. Market Analysis, Insights and Forecast - by Service Type
- 10.1.1. Ride Hailing
- 10.1.2. Ridesharing
- 10.2. Market Analysis, Insights and Forecast - by Booking Type
- 10.2.1. Online Booking
- 10.2.2. Offline Booking
- 10.3. Market Analysis, Insights and Forecast - by Vehicle Type
- 10.3.1. Hatchbacks
- 10.3.2. Sedans
- 10.3.3. SUVs/MPVs
- 10.1. Market Analysis, Insights and Forecast - by Service Type
- 11. Asia Pacific Taxi Industry Australia Analysis, Insights and Forecast, 2020-2032
- 11.1. Market Analysis, Insights and Forecast - by Service Type
- 11.1.1. Ride Hailing
- 11.1.2. Ridesharing
- 11.2. Market Analysis, Insights and Forecast - by Booking Type
- 11.2.1. Online Booking
- 11.2.2. Offline Booking
- 11.3. Market Analysis, Insights and Forecast - by Vehicle Type
- 11.3.1. Hatchbacks
- 11.3.2. Sedans
- 11.3.3. SUVs/MPVs
- 11.1. Market Analysis, Insights and Forecast - by Service Type
- 12. Competitive Analysis
- 12.1. Company Profiles
- 12.1.1 Legion Cabs
- 12.1.1.1. Company Overview
- 12.1.1.2. Products
- 12.1.1.3. Company Financials
- 12.1.1.4. SWOT Analysis
- 12.1.2 Ingogo
- 12.1.2.1. Company Overview
- 12.1.2.2. Products
- 12.1.2.3. Company Financials
- 12.1.2.4. SWOT Analysis
- 12.1.3 Uber Technologies Inc
- 12.1.3.1. Company Overview
- 12.1.3.2. Products
- 12.1.3.3. Company Financials
- 12.1.3.4. SWOT Analysis
- 12.1.4 Taxi Apps Pty Ltd (GoCatch)
- 12.1.4.1. Company Overview
- 12.1.4.2. Products
- 12.1.4.3. Company Financials
- 12.1.4.4. SWOT Analysis
- 12.1.5 P2P Transport Limited
- 12.1.5.1. Company Overview
- 12.1.5.2. Products
- 12.1.5.3. Company Financials
- 12.1.5.4. SWOT Analysis
- 12.1.6 GM Cabs
- 12.1.6.1. Company Overview
- 12.1.6.2. Products
- 12.1.6.3. Company Financials
- 12.1.6.4. SWOT Analysis
- 12.1.7 Rydo Taxi
- 12.1.7.1. Company Overview
- 12.1.7.2. Products
- 12.1.7.3. Company Financials
- 12.1.7.4. SWOT Analysis
- 12.1.8 Bolt Technology OÜ
- 12.1.8.1. Company Overview
- 12.1.8.2. Products
- 12.1.8.3. Company Financials
- 12.1.8.4. SWOT Analysis
- 12.1.9 A2B Australia Limited
- 12.1.9.1. Company Overview
- 12.1.9.2. Products
- 12.1.9.3. Company Financials
- 12.1.9.4. SWOT Analysis
- 12.1.10 ANI Technologies Pvt Ltd (Ola)
- 12.1.10.1. Company Overview
- 12.1.10.2. Products
- 12.1.10.3. Company Financials
- 12.1.10.4. SWOT Analysis
- 12.1.11 (Didi Chuxing) Beijing Xiaoju Technology Co Ltd *List Not Exhaustive
- 12.1.11.1. Company Overview
- 12.1.11.2. Products
- 12.1.11.3. Company Financials
- 12.1.11.4. SWOT Analysis
- 12.1.1 Legion Cabs
- 12.2. Market Entropy
- 12.2.1 Company's Key Areas Served
- 12.2.2 Recent Developments
- 12.3. Company Market Share Analysis 2025
- 12.3.1 Top 5 Companies Market Share Analysis
- 12.3.2 Top 3 Companies Market Share Analysis
- 12.4. List of Potential Customers
- 13. Research Methodology
List of Figures
- Figure 1: Global Taxi Industry Australia Revenue Breakdown (Million, %) by Region 2025 & 2033
- Figure 2: North America Taxi Industry Australia Revenue (Million), by Service Type 2025 & 2033
- Figure 3: North America Taxi Industry Australia Revenue Share (%), by Service Type 2025 & 2033
- Figure 4: North America Taxi Industry Australia Revenue (Million), by Booking Type 2025 & 2033
- Figure 5: North America Taxi Industry Australia Revenue Share (%), by Booking Type 2025 & 2033
- Figure 6: North America Taxi Industry Australia Revenue (Million), by Vehicle Type 2025 & 2033
- Figure 7: North America Taxi Industry Australia Revenue Share (%), by Vehicle Type 2025 & 2033
- Figure 8: North America Taxi Industry Australia Revenue (Million), by Country 2025 & 2033
- Figure 9: North America Taxi Industry Australia Revenue Share (%), by Country 2025 & 2033
- Figure 10: South America Taxi Industry Australia Revenue (Million), by Service Type 2025 & 2033
- Figure 11: South America Taxi Industry Australia Revenue Share (%), by Service Type 2025 & 2033
- Figure 12: South America Taxi Industry Australia Revenue (Million), by Booking Type 2025 & 2033
- Figure 13: South America Taxi Industry Australia Revenue Share (%), by Booking Type 2025 & 2033
- Figure 14: South America Taxi Industry Australia Revenue (Million), by Vehicle Type 2025 & 2033
- Figure 15: South America Taxi Industry Australia Revenue Share (%), by Vehicle Type 2025 & 2033
- Figure 16: South America Taxi Industry Australia Revenue (Million), by Country 2025 & 2033
- Figure 17: South America Taxi Industry Australia Revenue Share (%), by Country 2025 & 2033
- Figure 18: Europe Taxi Industry Australia Revenue (Million), by Service Type 2025 & 2033
- Figure 19: Europe Taxi Industry Australia Revenue Share (%), by Service Type 2025 & 2033
- Figure 20: Europe Taxi Industry Australia Revenue (Million), by Booking Type 2025 & 2033
- Figure 21: Europe Taxi Industry Australia Revenue Share (%), by Booking Type 2025 & 2033
- Figure 22: Europe Taxi Industry Australia Revenue (Million), by Vehicle Type 2025 & 2033
- Figure 23: Europe Taxi Industry Australia Revenue Share (%), by Vehicle Type 2025 & 2033
- Figure 24: Europe Taxi Industry Australia Revenue (Million), by Country 2025 & 2033
- Figure 25: Europe Taxi Industry Australia Revenue Share (%), by Country 2025 & 2033
- Figure 26: Middle East & Africa Taxi Industry Australia Revenue (Million), by Service Type 2025 & 2033
- Figure 27: Middle East & Africa Taxi Industry Australia Revenue Share (%), by Service Type 2025 & 2033
- Figure 28: Middle East & Africa Taxi Industry Australia Revenue (Million), by Booking Type 2025 & 2033
- Figure 29: Middle East & Africa Taxi Industry Australia Revenue Share (%), by Booking Type 2025 & 2033
- Figure 30: Middle East & Africa Taxi Industry Australia Revenue (Million), by Vehicle Type 2025 & 2033
- Figure 31: Middle East & Africa Taxi Industry Australia Revenue Share (%), by Vehicle Type 2025 & 2033
- Figure 32: Middle East & Africa Taxi Industry Australia Revenue (Million), by Country 2025 & 2033
- Figure 33: Middle East & Africa Taxi Industry Australia Revenue Share (%), by Country 2025 & 2033
- Figure 34: Asia Pacific Taxi Industry Australia Revenue (Million), by Service Type 2025 & 2033
- Figure 35: Asia Pacific Taxi Industry Australia Revenue Share (%), by Service Type 2025 & 2033
- Figure 36: Asia Pacific Taxi Industry Australia Revenue (Million), by Booking Type 2025 & 2033
- Figure 37: Asia Pacific Taxi Industry Australia Revenue Share (%), by Booking Type 2025 & 2033
- Figure 38: Asia Pacific Taxi Industry Australia Revenue (Million), by Vehicle Type 2025 & 2033
- Figure 39: Asia Pacific Taxi Industry Australia Revenue Share (%), by Vehicle Type 2025 & 2033
- Figure 40: Asia Pacific Taxi Industry Australia Revenue (Million), by Country 2025 & 2033
- Figure 41: Asia Pacific Taxi Industry Australia Revenue Share (%), by Country 2025 & 2033
List of Tables
- Table 1: Global Taxi Industry Australia Revenue Million Forecast, by Service Type 2020 & 2033
- Table 2: Global Taxi Industry Australia Revenue Million Forecast, by Booking Type 2020 & 2033
- Table 3: Global Taxi Industry Australia Revenue Million Forecast, by Vehicle Type 2020 & 2033
- Table 4: Global Taxi Industry Australia Revenue Million Forecast, by Region 2020 & 2033
- Table 5: Global Taxi Industry Australia Revenue Million Forecast, by Service Type 2020 & 2033
- Table 6: Global Taxi Industry Australia Revenue Million Forecast, by Booking Type 2020 & 2033
- Table 7: Global Taxi Industry Australia Revenue Million Forecast, by Vehicle Type 2020 & 2033
- Table 8: Global Taxi Industry Australia Revenue Million Forecast, by Country 2020 & 2033
- Table 9: United States Taxi Industry Australia Revenue (Million) Forecast, by Application 2020 & 2033
- Table 10: Canada Taxi Industry Australia Revenue (Million) Forecast, by Application 2020 & 2033
- Table 11: Mexico Taxi Industry Australia Revenue (Million) Forecast, by Application 2020 & 2033
- Table 12: Global Taxi Industry Australia Revenue Million Forecast, by Service Type 2020 & 2033
- Table 13: Global Taxi Industry Australia Revenue Million Forecast, by Booking Type 2020 & 2033
- Table 14: Global Taxi Industry Australia Revenue Million Forecast, by Vehicle Type 2020 & 2033
- Table 15: Global Taxi Industry Australia Revenue Million Forecast, by Country 2020 & 2033
- Table 16: Brazil Taxi Industry Australia Revenue (Million) Forecast, by Application 2020 & 2033
- Table 17: Argentina Taxi Industry Australia Revenue (Million) Forecast, by Application 2020 & 2033
- Table 18: Rest of South America Taxi Industry Australia Revenue (Million) Forecast, by Application 2020 & 2033
- Table 19: Global Taxi Industry Australia Revenue Million Forecast, by Service Type 2020 & 2033
- Table 20: Global Taxi Industry Australia Revenue Million Forecast, by Booking Type 2020 & 2033
- Table 21: Global Taxi Industry Australia Revenue Million Forecast, by Vehicle Type 2020 & 2033
- Table 22: Global Taxi Industry Australia Revenue Million Forecast, by Country 2020 & 2033
- Table 23: United Kingdom Taxi Industry Australia Revenue (Million) Forecast, by Application 2020 & 2033
- Table 24: Germany Taxi Industry Australia Revenue (Million) Forecast, by Application 2020 & 2033
- Table 25: France Taxi Industry Australia Revenue (Million) Forecast, by Application 2020 & 2033
- Table 26: Italy Taxi Industry Australia Revenue (Million) Forecast, by Application 2020 & 2033
- Table 27: Spain Taxi Industry Australia Revenue (Million) Forecast, by Application 2020 & 2033
- Table 28: Russia Taxi Industry Australia Revenue (Million) Forecast, by Application 2020 & 2033
- Table 29: Benelux Taxi Industry Australia Revenue (Million) Forecast, by Application 2020 & 2033
- Table 30: Nordics Taxi Industry Australia Revenue (Million) Forecast, by Application 2020 & 2033
- Table 31: Rest of Europe Taxi Industry Australia Revenue (Million) Forecast, by Application 2020 & 2033
- Table 32: Global Taxi Industry Australia Revenue Million Forecast, by Service Type 2020 & 2033
- Table 33: Global Taxi Industry Australia Revenue Million Forecast, by Booking Type 2020 & 2033
- Table 34: Global Taxi Industry Australia Revenue Million Forecast, by Vehicle Type 2020 & 2033
- Table 35: Global Taxi Industry Australia Revenue Million Forecast, by Country 2020 & 2033
- Table 36: Turkey Taxi Industry Australia Revenue (Million) Forecast, by Application 2020 & 2033
- Table 37: Israel Taxi Industry Australia Revenue (Million) Forecast, by Application 2020 & 2033
- Table 38: GCC Taxi Industry Australia Revenue (Million) Forecast, by Application 2020 & 2033
- Table 39: North Africa Taxi Industry Australia Revenue (Million) Forecast, by Application 2020 & 2033
- Table 40: South Africa Taxi Industry Australia Revenue (Million) Forecast, by Application 2020 & 2033
- Table 41: Rest of Middle East & Africa Taxi Industry Australia Revenue (Million) Forecast, by Application 2020 & 2033
- Table 42: Global Taxi Industry Australia Revenue Million Forecast, by Service Type 2020 & 2033
- Table 43: Global Taxi Industry Australia Revenue Million Forecast, by Booking Type 2020 & 2033
- Table 44: Global Taxi Industry Australia Revenue Million Forecast, by Vehicle Type 2020 & 2033
- Table 45: Global Taxi Industry Australia Revenue Million Forecast, by Country 2020 & 2033
- Table 46: China Taxi Industry Australia Revenue (Million) Forecast, by Application 2020 & 2033
- Table 47: India Taxi Industry Australia Revenue (Million) Forecast, by Application 2020 & 2033
- Table 48: Japan Taxi Industry Australia Revenue (Million) Forecast, by Application 2020 & 2033
- Table 49: South Korea Taxi Industry Australia Revenue (Million) Forecast, by Application 2020 & 2033
- Table 50: ASEAN Taxi Industry Australia Revenue (Million) Forecast, by Application 2020 & 2033
- Table 51: Oceania Taxi Industry Australia Revenue (Million) Forecast, by Application 2020 & 2033
- Table 52: Rest of Asia Pacific Taxi Industry Australia Revenue (Million) Forecast, by Application 2020 & 2033
Frequently Asked Questions
1. What is the projected Compound Annual Growth Rate (CAGR) of the Taxi Industry Australia?
The projected CAGR is approximately 9.60%.
2. Which companies are prominent players in the Taxi Industry Australia?
Key companies in the market include Legion Cabs, Ingogo, Uber Technologies Inc, Taxi Apps Pty Ltd (GoCatch), P2P Transport Limited, GM Cabs, Rydo Taxi, Bolt Technology OÜ, A2B Australia Limited, ANI Technologies Pvt Ltd (Ola), (Didi Chuxing) Beijing Xiaoju Technology Co Ltd *List Not Exhaustive.
3. What are the main segments of the Taxi Industry Australia?
The market segments include Service Type, Booking Type, Vehicle Type.
4. Can you provide details about the market size?
The market size is estimated to be USD 3.73 Million as of 2022.
5. What are some drivers contributing to market growth?
Growing Tourism Industry in Australia.
6. What are the notable trends driving market growth?
Online Booking Holds the Highest Share.
7. Are there any restraints impacting market growth?
Varying Government Regulations on Taxi Services.
8. Can you provide examples of recent developments in the market?
October 2022: Ingenico, the most trusted technological partner for payment acceptance, and Live Payments, one of Australia's leading payment service providers, announced their cooperation for long-term strategic partnerships to equip retailers and taxis with seamless and convenient payment and commerce solutions.
9. What pricing options are available for accessing the report?
Pricing options include single-user, multi-user, and enterprise licenses priced at USD 3800, USD 4500, and USD 5800 respectively.
10. Is the market size provided in terms of value or volume?
The market size is provided in terms of value, measured in Million.
11. Are there any specific market keywords associated with the report?
Yes, the market keyword associated with the report is "Taxi Industry Australia," which aids in identifying and referencing the specific market segment covered.
12. How do I determine which pricing option suits my needs best?
The pricing options vary based on user requirements and access needs. Individual users may opt for single-user licenses, while businesses requiring broader access may choose multi-user or enterprise licenses for cost-effective access to the report.
13. Are there any additional resources or data provided in the Taxi Industry Australia report?
While the report offers comprehensive insights, it's advisable to review the specific contents or supplementary materials provided to ascertain if additional resources or data are available.
14. How can I stay updated on further developments or reports in the Taxi Industry Australia?
To stay informed about further developments, trends, and reports in the Taxi Industry Australia, consider subscribing to industry newsletters, following relevant companies and organizations, or regularly checking reputable industry news sources and publications.
Methodology
Step 1 - Identification of Relevant Samples Size from Population Database


Step 2 - Approaches for Defining Global Market Size (Value, Volume* & Price*)

Note*: In applicable scenarios
Step 3 - Data Sources
Primary Research
- Web Analytics
- Survey Reports
- Research Institute
- Latest Research Reports
- Opinion Leaders
Secondary Research
- Annual Reports
- White Paper
- Latest Press Release
- Industry Association
- Paid Database
- Investor Presentations

Step 4 - Data Triangulation
Involves using different sources of information in order to increase the validity of a study
These sources are likely to be stakeholders in a program - participants, other researchers, program staff, other community members, and so on.
Then we put all data in single framework & apply various statistical tools to find out the dynamic on the market.
During the analysis stage, feedback from the stakeholder groups would be compared to determine areas of agreement as well as areas of divergence