

Key Insights
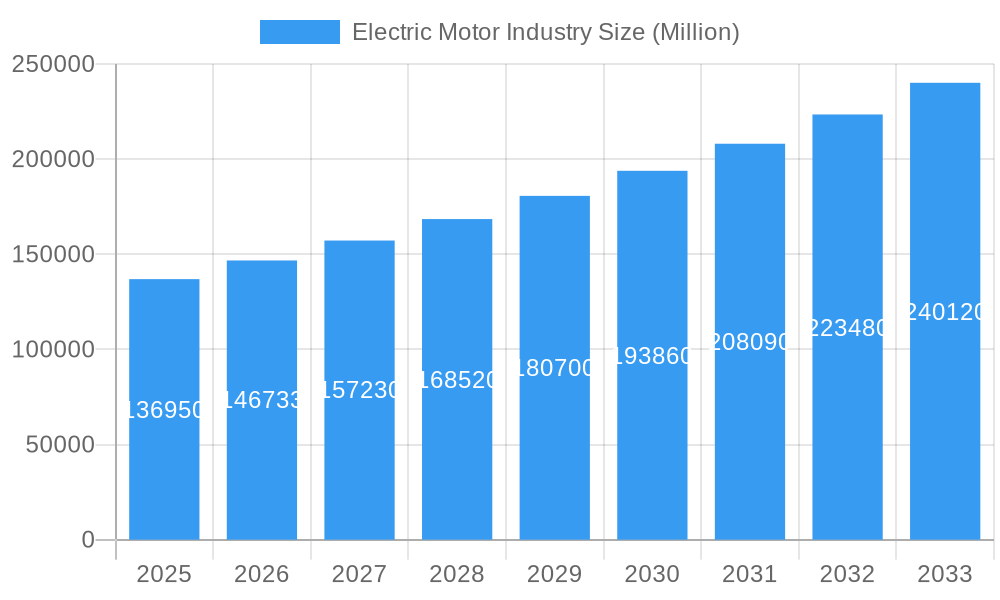
The global electric motor market, valued at $136.95 billion in 2025, is projected to experience robust growth, driven by the increasing demand for energy-efficient solutions across diverse sectors. A Compound Annual Growth Rate (CAGR) of 6.97% from 2025 to 2033 indicates a significant expansion of this market. Key drivers include the escalating adoption of electric vehicles (EVs), the rising industrial automation trend, and the growing focus on renewable energy integration. The shift towards sustainable manufacturing practices and stringent government regulations promoting energy efficiency further bolster market expansion. Segmentation analysis reveals a strong presence across motor types (AC and DC), voltage classifications (below 1kV, 1kV-6kV, and above 6kV), and application areas, including residential, commercial, automotive, and industrial sectors. The automotive segment is expected to witness particularly strong growth fueled by the global transition to electric mobility. Geographical distribution shows significant market shares across North America, Europe, and Asia-Pacific, with China and the United States emerging as dominant players. Competition is fierce, with major players like Rockwell Automation, ABB, and Siemens vying for market leadership through technological advancements and strategic partnerships. The market faces certain restraints, including high initial investment costs associated with electric motor adoption and the potential for supply chain disruptions. However, ongoing technological improvements, decreasing production costs, and increasing government incentives are anticipated to mitigate these challenges.
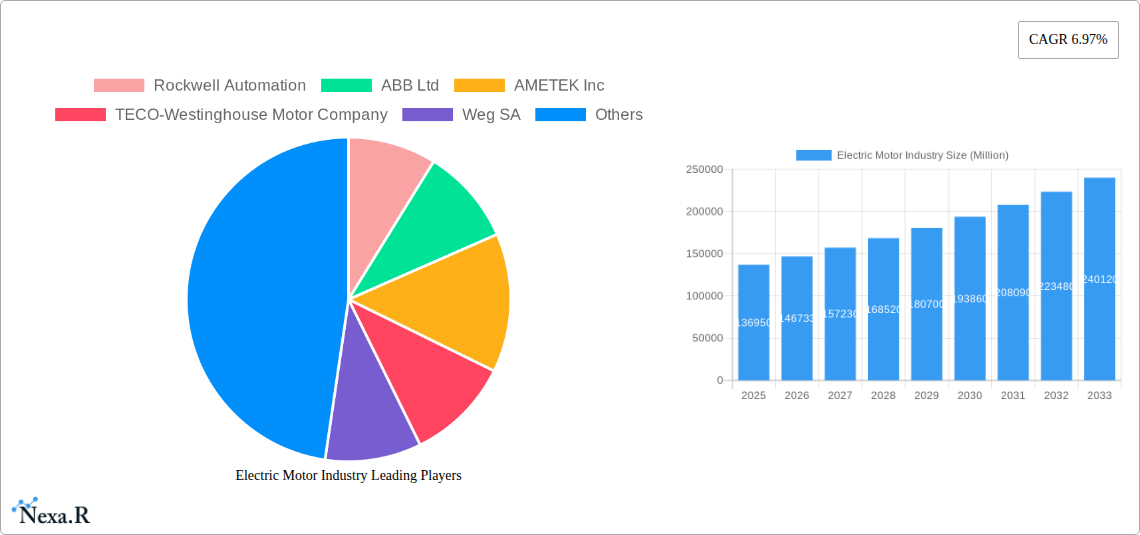
Electric Motor Industry Market Size (In Billion)
The forecast period (2025-2033) presents significant opportunities for market players to capitalize on the burgeoning demand for high-efficiency, reliable, and sustainable electric motors. Continued innovation in motor design, control systems, and materials science will be crucial in maintaining market competitiveness. Furthermore, strategic collaborations and mergers & acquisitions are likely to shape the market landscape in the coming years. Focus on developing smart motors with advanced capabilities for data analytics and predictive maintenance is likely to be a key differentiator. The market's future hinges on successfully navigating the evolving regulatory landscape, addressing supply chain vulnerabilities, and consistently providing innovative solutions to meet the ever-growing demands of various industries.
Electric Motor Industry Company Market Share
This comprehensive report provides a detailed analysis of the electric motor industry, encompassing market dynamics, growth trends, regional segmentation, product landscape, and key players. With a study period spanning 2019-2033, a base year of 2025, and a forecast period of 2025-2033, this report offers invaluable insights for industry professionals, investors, and strategic decision-makers. The report covers both parent markets (Electric Motors) and child markets (AC Motors, DC Motors, Motors by Voltage and Application).
Electric Motor Industry Market Dynamics & Structure
The global electric motor market is characterized by a moderately concentrated landscape, with key players like Rockwell Automation, ABB Ltd, AMETEK Inc, TECO-Westinghouse Motor Company, Weg SA, Toshiba Corp, Nidec Corporation, Johnson Electric Holdings Limited, Siemens AG, Hitachi Ltd, Robert Bosch GmbH, and Regal Rexnord Corporation holding significant market share. Market concentration is estimated at xx%, with the top 5 players accounting for approximately xx%.
- Technological Innovation: Continuous advancements in materials science, power electronics, and control systems drive efficiency improvements and miniaturization. The shift towards energy-efficient motors is a major catalyst.
- Regulatory Frameworks: Stringent environmental regulations promoting energy efficiency and reducing emissions significantly influence market growth. Government incentives for electric vehicle adoption further boost demand.
- Competitive Substitutes: While electric motors dominate, alternative technologies like hydraulic and pneumatic systems continue to compete in niche applications.
- End-User Demographics: The growing industrial automation sector, the burgeoning electric vehicle market, and increasing adoption in residential and commercial applications fuel demand growth.
- M&A Trends: Consolidation activities are prevalent, with approximately xx M&A deals recorded in the historical period (2019-2024), primarily focused on expanding product portfolios and geographic reach. These deals often involve companies specializing in specific motor types or applications.
Electric Motor Industry Growth Trends & Insights
The global electric motor market is experiencing robust growth, driven by several factors. The market size is expected to reach xx Million units by 2025, expanding to xx Million units by 2033 at a CAGR of xx%. This growth is fueled by increasing automation across industries, the global shift towards electric mobility, and the rising demand for energy-efficient solutions. Technological disruptions, such as the adoption of rare-earth-free motors and the increasing integration of smart functionalities, are further accelerating adoption rates. Consumer behavior shifts, such as a preference for energy-efficient appliances and vehicles, contribute to this positive trajectory. Market penetration for energy-efficient motors in industrial applications is estimated at xx% in 2025, projected to reach xx% by 2033.
Dominant Regions, Countries, or Segments in Electric Motor Industry
The Industrial segment represents the largest share of the market, estimated at xx Million units in 2025, followed by the Automotive segment with xx Million units. Within motor types, AC motors maintain market dominance, holding approximately xx% market share in 2025 due to their cost-effectiveness and widespread compatibility. The "Less than 1 kV" voltage segment is the largest, accounting for xx% of the total market, driven by extensive residential and commercial applications.
- Key Drivers for Industrial Segment Dominance: Robust industrial growth, increasing automation initiatives, and government investments in infrastructure development fuel demand.
- Key Drivers for Automotive Segment Growth: The rapid expansion of the electric vehicle market is the primary driver, with stringent emission regulations further accelerating adoption.
- Regional dominance: Asia-Pacific leads in terms of market size and growth, driven by strong industrial production, large-scale EV adoption in countries like China, and substantial investments in renewable energy infrastructure.
Electric Motor Industry Product Landscape
Electric motor innovation is focused on improving efficiency, reducing size, and enhancing durability. Significant advancements include the development of high-efficiency motors with improved power density, the integration of advanced control systems for precise speed and torque regulation, and the adoption of sustainable materials to minimize environmental impact. Unique selling propositions are increasingly centered around energy efficiency certifications, smart features, and customizability for specific applications.
Key Drivers, Barriers & Challenges in Electric Motor Industry
Key Drivers:
- Growing demand from the automotive and industrial sectors.
- Increased government regulations favoring energy-efficient technologies.
- Technological advancements in motor design and control systems.
Challenges and Restraints:
- Fluctuations in raw material prices (e.g., copper, rare earth magnets) impacting production costs.
- Stringent environmental regulations requiring compliance with emission standards.
- Intense competition, particularly from Asian manufacturers, leading to price pressures. This is expected to result in a xx% decrease in average selling prices over the next decade.
Emerging Opportunities in Electric Motor Industry
- Expansion into untapped markets, such as developing economies.
- Increased adoption of electric motors in renewable energy applications (wind turbines, solar power systems).
- Growing demand for specialized motors in sectors like robotics and drones.
- Integration of advanced sensor technologies for predictive maintenance and improved operational efficiency.
Growth Accelerators in the Electric Motor Industry
Technological advancements, particularly in power electronics and materials science, are significantly accelerating growth. Strategic collaborations between motor manufacturers and technology providers are leading to the development of innovative products and solutions. Expanding into emerging markets and diversifying product portfolios are also key growth strategies.
Key Players Shaping the Electric Motor Industry Market
- Rockwell Automation
- ABB Ltd
- AMETEK Inc
- TECO-Westinghouse Motor Company
- Weg SA
- Toshiba Corp
- Nidec Corporation
- Johnson Electric Holdings Limited
- Siemens AG
- Hitachi Ltd
- Robert Bosch GmbH
- Regal Rexnord Corporation
Notable Milestones in Electric Motor Industry Sector
- November 2022: Nidec Corporation announced a USD 715 million investment in Mexico to manufacture electric motors and e-axle drives for EVs, with an anticipated annual production capacity of 1 million units.
- February 2023: Flash and GEM motors announced a technical collaboration to develop hub motors for electric vehicles (1 kW to 15 kW range).
In-Depth Electric Motor Industry Market Outlook
The electric motor market is poised for continued robust growth, driven by ongoing technological innovations, increasing demand from key sectors, and supportive government policies. Strategic partnerships, expansion into new applications, and a focus on sustainability will be crucial for players to capitalize on the significant market opportunities. The market is projected to witness sustained growth throughout the forecast period, with substantial potential for market expansion in emerging economies.
Electric Motor Industry Segmentation
-
1. Motor Type
- 1.1. AC
- 1.2. DC
-
2. Voltage
- 2.1. Less than 1 kV
- 2.2. Between 1kV-6kV
- 2.3. Higher than 6 kV
-
3. Application
- 3.1. Residential
- 3.2. Commercial
- 3.3. Automotive
- 3.4. Industrial
Electric Motor Industry Segmentation By Geography
-
1. North America
- 1.1. United States
- 1.2. Canada
- 1.3. Rest of North America
-
2. Europe
- 2.1. Germany
- 2.2. France
- 2.3. United Kingdom
- 2.4. Rest of Europe
-
3. Asia Pacific
- 3.1. China
- 3.2. India
- 3.3. Japan
- 3.4. South Korea
- 3.5. Rest of Asia Pacific
-
4. South America
- 4.1. Brazil
- 4.2. Argentina
- 4.3. Rest of South America
-
5. Middle East and Africa
- 5.1. Saudi Arabia
- 5.2. United Arab Emirates
- 5.3. South Africa
- 5.4. Rest of Middle East and Africa
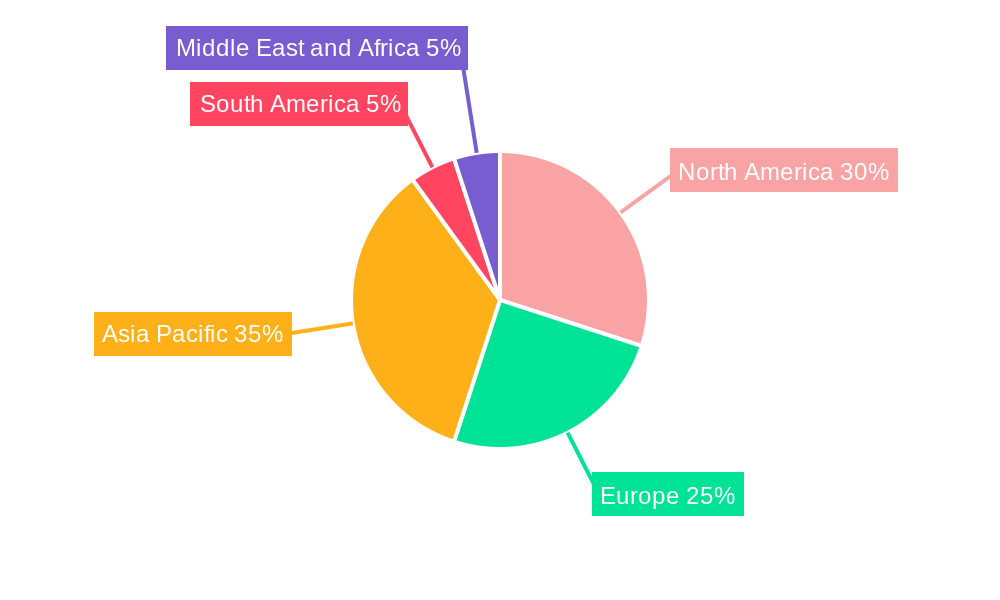
Electric Motor Industry Regional Market Share
Geographic Coverage of Electric Motor Industry
Electric Motor Industry REPORT HIGHLIGHTS
| Aspects | Details |
|---|---|
| Study Period | 2020-2034 |
| Base Year | 2025 |
| Estimated Year | 2026 |
| Forecast Period | 2026-2034 |
| Historical Period | 2020-2025 |
| Growth Rate | CAGR of 6.97% from 2020-2034 |
| Segmentation |
|
Table of Contents
- 1. Introduction
- 1.1. Research Scope
- 1.2. Market Segmentation
- 1.3. Research Methodology
- 1.4. Definitions and Assumptions
- 2. Executive Summary
- 2.1. Introduction
- 3. Market Dynamics
- 3.1. Introduction
- 3.2. Market Drivers
- 3.2.1. 4Increasing Residential Usage of the Electric Motor. Rising Adoption of Electric Vehicles
- 3.3. Market Restrains
- 3.3.1. Fluctuating Prices of Raw Materials
- 3.4. Market Trends
- 3.4.1. Automotive Segment to Witness Growth
- 4. Market Factor Analysis
- 4.1. Porters Five Forces
- 4.2. Supply/Value Chain
- 4.3. PESTEL analysis
- 4.4. Market Entropy
- 4.5. Patent/Trademark Analysis
- 5. Global Electric Motor Industry Analysis, Insights and Forecast, 2020-2032
- 5.1. Market Analysis, Insights and Forecast - by Motor Type
- 5.1.1. AC
- 5.1.2. DC
- 5.2. Market Analysis, Insights and Forecast - by Voltage
- 5.2.1. Less than 1 kV
- 5.2.2. Between 1kV-6kV
- 5.2.3. Higher than 6 kV
- 5.3. Market Analysis, Insights and Forecast - by Application
- 5.3.1. Residential
- 5.3.2. Commercial
- 5.3.3. Automotive
- 5.3.4. Industrial
- 5.4. Market Analysis, Insights and Forecast - by Region
- 5.4.1. North America
- 5.4.2. Europe
- 5.4.3. Asia Pacific
- 5.4.4. South America
- 5.4.5. Middle East and Africa
- 5.1. Market Analysis, Insights and Forecast - by Motor Type
- 6. North America Electric Motor Industry Analysis, Insights and Forecast, 2020-2032
- 6.1. Market Analysis, Insights and Forecast - by Motor Type
- 6.1.1. AC
- 6.1.2. DC
- 6.2. Market Analysis, Insights and Forecast - by Voltage
- 6.2.1. Less than 1 kV
- 6.2.2. Between 1kV-6kV
- 6.2.3. Higher than 6 kV
- 6.3. Market Analysis, Insights and Forecast - by Application
- 6.3.1. Residential
- 6.3.2. Commercial
- 6.3.3. Automotive
- 6.3.4. Industrial
- 6.1. Market Analysis, Insights and Forecast - by Motor Type
- 7. Europe Electric Motor Industry Analysis, Insights and Forecast, 2020-2032
- 7.1. Market Analysis, Insights and Forecast - by Motor Type
- 7.1.1. AC
- 7.1.2. DC
- 7.2. Market Analysis, Insights and Forecast - by Voltage
- 7.2.1. Less than 1 kV
- 7.2.2. Between 1kV-6kV
- 7.2.3. Higher than 6 kV
- 7.3. Market Analysis, Insights and Forecast - by Application
- 7.3.1. Residential
- 7.3.2. Commercial
- 7.3.3. Automotive
- 7.3.4. Industrial
- 7.1. Market Analysis, Insights and Forecast - by Motor Type
- 8. Asia Pacific Electric Motor Industry Analysis, Insights and Forecast, 2020-2032
- 8.1. Market Analysis, Insights and Forecast - by Motor Type
- 8.1.1. AC
- 8.1.2. DC
- 8.2. Market Analysis, Insights and Forecast - by Voltage
- 8.2.1. Less than 1 kV
- 8.2.2. Between 1kV-6kV
- 8.2.3. Higher than 6 kV
- 8.3. Market Analysis, Insights and Forecast - by Application
- 8.3.1. Residential
- 8.3.2. Commercial
- 8.3.3. Automotive
- 8.3.4. Industrial
- 8.1. Market Analysis, Insights and Forecast - by Motor Type
- 9. South America Electric Motor Industry Analysis, Insights and Forecast, 2020-2032
- 9.1. Market Analysis, Insights and Forecast - by Motor Type
- 9.1.1. AC
- 9.1.2. DC
- 9.2. Market Analysis, Insights and Forecast - by Voltage
- 9.2.1. Less than 1 kV
- 9.2.2. Between 1kV-6kV
- 9.2.3. Higher than 6 kV
- 9.3. Market Analysis, Insights and Forecast - by Application
- 9.3.1. Residential
- 9.3.2. Commercial
- 9.3.3. Automotive
- 9.3.4. Industrial
- 9.1. Market Analysis, Insights and Forecast - by Motor Type
- 10. Middle East and Africa Electric Motor Industry Analysis, Insights and Forecast, 2020-2032
- 10.1. Market Analysis, Insights and Forecast - by Motor Type
- 10.1.1. AC
- 10.1.2. DC
- 10.2. Market Analysis, Insights and Forecast - by Voltage
- 10.2.1. Less than 1 kV
- 10.2.2. Between 1kV-6kV
- 10.2.3. Higher than 6 kV
- 10.3. Market Analysis, Insights and Forecast - by Application
- 10.3.1. Residential
- 10.3.2. Commercial
- 10.3.3. Automotive
- 10.3.4. Industrial
- 10.1. Market Analysis, Insights and Forecast - by Motor Type
- 11. Competitive Analysis
- 11.1. Global Market Share Analysis 2025
- 11.2. Company Profiles
- 11.2.1 Rockwell Automation
- 11.2.1.1. Overview
- 11.2.1.2. Products
- 11.2.1.3. SWOT Analysis
- 11.2.1.4. Recent Developments
- 11.2.1.5. Financials (Based on Availability)
- 11.2.2 ABB Ltd
- 11.2.2.1. Overview
- 11.2.2.2. Products
- 11.2.2.3. SWOT Analysis
- 11.2.2.4. Recent Developments
- 11.2.2.5. Financials (Based on Availability)
- 11.2.3 AMETEK Inc
- 11.2.3.1. Overview
- 11.2.3.2. Products
- 11.2.3.3. SWOT Analysis
- 11.2.3.4. Recent Developments
- 11.2.3.5. Financials (Based on Availability)
- 11.2.4 TECO-Westinghouse Motor Company
- 11.2.4.1. Overview
- 11.2.4.2. Products
- 11.2.4.3. SWOT Analysis
- 11.2.4.4. Recent Developments
- 11.2.4.5. Financials (Based on Availability)
- 11.2.5 Weg SA
- 11.2.5.1. Overview
- 11.2.5.2. Products
- 11.2.5.3. SWOT Analysis
- 11.2.5.4. Recent Developments
- 11.2.5.5. Financials (Based on Availability)
- 11.2.6 Toshiba Corp
- 11.2.6.1. Overview
- 11.2.6.2. Products
- 11.2.6.3. SWOT Analysis
- 11.2.6.4. Recent Developments
- 11.2.6.5. Financials (Based on Availability)
- 11.2.7 Nidec Corporation
- 11.2.7.1. Overview
- 11.2.7.2. Products
- 11.2.7.3. SWOT Analysis
- 11.2.7.4. Recent Developments
- 11.2.7.5. Financials (Based on Availability)
- 11.2.8 Johnson Electric Holdings Limited
- 11.2.8.1. Overview
- 11.2.8.2. Products
- 11.2.8.3. SWOT Analysis
- 11.2.8.4. Recent Developments
- 11.2.8.5. Financials (Based on Availability)
- 11.2.9 Siemens AG
- 11.2.9.1. Overview
- 11.2.9.2. Products
- 11.2.9.3. SWOT Analysis
- 11.2.9.4. Recent Developments
- 11.2.9.5. Financials (Based on Availability)
- 11.2.10 Hitachi Ltd
- 11.2.10.1. Overview
- 11.2.10.2. Products
- 11.2.10.3. SWOT Analysis
- 11.2.10.4. Recent Developments
- 11.2.10.5. Financials (Based on Availability)
- 11.2.11 Robert Bosch GmbH
- 11.2.11.1. Overview
- 11.2.11.2. Products
- 11.2.11.3. SWOT Analysis
- 11.2.11.4. Recent Developments
- 11.2.11.5. Financials (Based on Availability)
- 11.2.12 Regal Rexnord Corporation
- 11.2.12.1. Overview
- 11.2.12.2. Products
- 11.2.12.3. SWOT Analysis
- 11.2.12.4. Recent Developments
- 11.2.12.5. Financials (Based on Availability)
- 11.2.1 Rockwell Automation
List of Figures
- Figure 1: Global Electric Motor Industry Revenue Breakdown (Million, %) by Region 2025 & 2033
- Figure 2: North America Electric Motor Industry Revenue (Million), by Motor Type 2025 & 2033
- Figure 3: North America Electric Motor Industry Revenue Share (%), by Motor Type 2025 & 2033
- Figure 4: North America Electric Motor Industry Revenue (Million), by Voltage 2025 & 2033
- Figure 5: North America Electric Motor Industry Revenue Share (%), by Voltage 2025 & 2033
- Figure 6: North America Electric Motor Industry Revenue (Million), by Application 2025 & 2033
- Figure 7: North America Electric Motor Industry Revenue Share (%), by Application 2025 & 2033
- Figure 8: North America Electric Motor Industry Revenue (Million), by Country 2025 & 2033
- Figure 9: North America Electric Motor Industry Revenue Share (%), by Country 2025 & 2033
- Figure 10: Europe Electric Motor Industry Revenue (Million), by Motor Type 2025 & 2033
- Figure 11: Europe Electric Motor Industry Revenue Share (%), by Motor Type 2025 & 2033
- Figure 12: Europe Electric Motor Industry Revenue (Million), by Voltage 2025 & 2033
- Figure 13: Europe Electric Motor Industry Revenue Share (%), by Voltage 2025 & 2033
- Figure 14: Europe Electric Motor Industry Revenue (Million), by Application 2025 & 2033
- Figure 15: Europe Electric Motor Industry Revenue Share (%), by Application 2025 & 2033
- Figure 16: Europe Electric Motor Industry Revenue (Million), by Country 2025 & 2033
- Figure 17: Europe Electric Motor Industry Revenue Share (%), by Country 2025 & 2033
- Figure 18: Asia Pacific Electric Motor Industry Revenue (Million), by Motor Type 2025 & 2033
- Figure 19: Asia Pacific Electric Motor Industry Revenue Share (%), by Motor Type 2025 & 2033
- Figure 20: Asia Pacific Electric Motor Industry Revenue (Million), by Voltage 2025 & 2033
- Figure 21: Asia Pacific Electric Motor Industry Revenue Share (%), by Voltage 2025 & 2033
- Figure 22: Asia Pacific Electric Motor Industry Revenue (Million), by Application 2025 & 2033
- Figure 23: Asia Pacific Electric Motor Industry Revenue Share (%), by Application 2025 & 2033
- Figure 24: Asia Pacific Electric Motor Industry Revenue (Million), by Country 2025 & 2033
- Figure 25: Asia Pacific Electric Motor Industry Revenue Share (%), by Country 2025 & 2033
- Figure 26: South America Electric Motor Industry Revenue (Million), by Motor Type 2025 & 2033
- Figure 27: South America Electric Motor Industry Revenue Share (%), by Motor Type 2025 & 2033
- Figure 28: South America Electric Motor Industry Revenue (Million), by Voltage 2025 & 2033
- Figure 29: South America Electric Motor Industry Revenue Share (%), by Voltage 2025 & 2033
- Figure 30: South America Electric Motor Industry Revenue (Million), by Application 2025 & 2033
- Figure 31: South America Electric Motor Industry Revenue Share (%), by Application 2025 & 2033
- Figure 32: South America Electric Motor Industry Revenue (Million), by Country 2025 & 2033
- Figure 33: South America Electric Motor Industry Revenue Share (%), by Country 2025 & 2033
- Figure 34: Middle East and Africa Electric Motor Industry Revenue (Million), by Motor Type 2025 & 2033
- Figure 35: Middle East and Africa Electric Motor Industry Revenue Share (%), by Motor Type 2025 & 2033
- Figure 36: Middle East and Africa Electric Motor Industry Revenue (Million), by Voltage 2025 & 2033
- Figure 37: Middle East and Africa Electric Motor Industry Revenue Share (%), by Voltage 2025 & 2033
- Figure 38: Middle East and Africa Electric Motor Industry Revenue (Million), by Application 2025 & 2033
- Figure 39: Middle East and Africa Electric Motor Industry Revenue Share (%), by Application 2025 & 2033
- Figure 40: Middle East and Africa Electric Motor Industry Revenue (Million), by Country 2025 & 2033
- Figure 41: Middle East and Africa Electric Motor Industry Revenue Share (%), by Country 2025 & 2033
List of Tables
- Table 1: Global Electric Motor Industry Revenue Million Forecast, by Motor Type 2020 & 2033
- Table 2: Global Electric Motor Industry Revenue Million Forecast, by Voltage 2020 & 2033
- Table 3: Global Electric Motor Industry Revenue Million Forecast, by Application 2020 & 2033
- Table 4: Global Electric Motor Industry Revenue Million Forecast, by Region 2020 & 2033
- Table 5: Global Electric Motor Industry Revenue Million Forecast, by Motor Type 2020 & 2033
- Table 6: Global Electric Motor Industry Revenue Million Forecast, by Voltage 2020 & 2033
- Table 7: Global Electric Motor Industry Revenue Million Forecast, by Application 2020 & 2033
- Table 8: Global Electric Motor Industry Revenue Million Forecast, by Country 2020 & 2033
- Table 9: United States Electric Motor Industry Revenue (Million) Forecast, by Application 2020 & 2033
- Table 10: Canada Electric Motor Industry Revenue (Million) Forecast, by Application 2020 & 2033
- Table 11: Rest of North America Electric Motor Industry Revenue (Million) Forecast, by Application 2020 & 2033
- Table 12: Global Electric Motor Industry Revenue Million Forecast, by Motor Type 2020 & 2033
- Table 13: Global Electric Motor Industry Revenue Million Forecast, by Voltage 2020 & 2033
- Table 14: Global Electric Motor Industry Revenue Million Forecast, by Application 2020 & 2033
- Table 15: Global Electric Motor Industry Revenue Million Forecast, by Country 2020 & 2033
- Table 16: Germany Electric Motor Industry Revenue (Million) Forecast, by Application 2020 & 2033
- Table 17: France Electric Motor Industry Revenue (Million) Forecast, by Application 2020 & 2033
- Table 18: United Kingdom Electric Motor Industry Revenue (Million) Forecast, by Application 2020 & 2033
- Table 19: Rest of Europe Electric Motor Industry Revenue (Million) Forecast, by Application 2020 & 2033
- Table 20: Global Electric Motor Industry Revenue Million Forecast, by Motor Type 2020 & 2033
- Table 21: Global Electric Motor Industry Revenue Million Forecast, by Voltage 2020 & 2033
- Table 22: Global Electric Motor Industry Revenue Million Forecast, by Application 2020 & 2033
- Table 23: Global Electric Motor Industry Revenue Million Forecast, by Country 2020 & 2033
- Table 24: China Electric Motor Industry Revenue (Million) Forecast, by Application 2020 & 2033
- Table 25: India Electric Motor Industry Revenue (Million) Forecast, by Application 2020 & 2033
- Table 26: Japan Electric Motor Industry Revenue (Million) Forecast, by Application 2020 & 2033
- Table 27: South Korea Electric Motor Industry Revenue (Million) Forecast, by Application 2020 & 2033
- Table 28: Rest of Asia Pacific Electric Motor Industry Revenue (Million) Forecast, by Application 2020 & 2033
- Table 29: Global Electric Motor Industry Revenue Million Forecast, by Motor Type 2020 & 2033
- Table 30: Global Electric Motor Industry Revenue Million Forecast, by Voltage 2020 & 2033
- Table 31: Global Electric Motor Industry Revenue Million Forecast, by Application 2020 & 2033
- Table 32: Global Electric Motor Industry Revenue Million Forecast, by Country 2020 & 2033
- Table 33: Brazil Electric Motor Industry Revenue (Million) Forecast, by Application 2020 & 2033
- Table 34: Argentina Electric Motor Industry Revenue (Million) Forecast, by Application 2020 & 2033
- Table 35: Rest of South America Electric Motor Industry Revenue (Million) Forecast, by Application 2020 & 2033
- Table 36: Global Electric Motor Industry Revenue Million Forecast, by Motor Type 2020 & 2033
- Table 37: Global Electric Motor Industry Revenue Million Forecast, by Voltage 2020 & 2033
- Table 38: Global Electric Motor Industry Revenue Million Forecast, by Application 2020 & 2033
- Table 39: Global Electric Motor Industry Revenue Million Forecast, by Country 2020 & 2033
- Table 40: Saudi Arabia Electric Motor Industry Revenue (Million) Forecast, by Application 2020 & 2033
- Table 41: United Arab Emirates Electric Motor Industry Revenue (Million) Forecast, by Application 2020 & 2033
- Table 42: South Africa Electric Motor Industry Revenue (Million) Forecast, by Application 2020 & 2033
- Table 43: Rest of Middle East and Africa Electric Motor Industry Revenue (Million) Forecast, by Application 2020 & 2033
Frequently Asked Questions
1. What is the projected Compound Annual Growth Rate (CAGR) of the Electric Motor Industry?
The projected CAGR is approximately 6.97%.
2. Which companies are prominent players in the Electric Motor Industry?
Key companies in the market include Rockwell Automation, ABB Ltd, AMETEK Inc, TECO-Westinghouse Motor Company, Weg SA, Toshiba Corp, Nidec Corporation, Johnson Electric Holdings Limited, Siemens AG, Hitachi Ltd, Robert Bosch GmbH, Regal Rexnord Corporation.
3. What are the main segments of the Electric Motor Industry?
The market segments include Motor Type, Voltage, Application.
4. Can you provide details about the market size?
The market size is estimated to be USD 136.95 Million as of 2022.
5. What are some drivers contributing to market growth?
4Increasing Residential Usage of the Electric Motor. Rising Adoption of Electric Vehicles.
6. What are the notable trends driving market growth?
Automotive Segment to Witness Growth.
7. Are there any restraints impacting market growth?
Fluctuating Prices of Raw Materials.
8. Can you provide examples of recent developments in the market?
February 2023: Electronic component maker Flash announced a technical collaboration with Slovenia-based GEM motors to develop electric motors. Under the partnership, both brands will manufacture hub motors for various electric vehicle segments in the range of 1 kW to 15 kW.
9. What pricing options are available for accessing the report?
Pricing options include single-user, multi-user, and enterprise licenses priced at USD 4750, USD 5250, and USD 8750 respectively.
10. Is the market size provided in terms of value or volume?
The market size is provided in terms of value, measured in Million.
11. Are there any specific market keywords associated with the report?
Yes, the market keyword associated with the report is "Electric Motor Industry," which aids in identifying and referencing the specific market segment covered.
12. How do I determine which pricing option suits my needs best?
The pricing options vary based on user requirements and access needs. Individual users may opt for single-user licenses, while businesses requiring broader access may choose multi-user or enterprise licenses for cost-effective access to the report.
13. Are there any additional resources or data provided in the Electric Motor Industry report?
While the report offers comprehensive insights, it's advisable to review the specific contents or supplementary materials provided to ascertain if additional resources or data are available.
14. How can I stay updated on further developments or reports in the Electric Motor Industry?
To stay informed about further developments, trends, and reports in the Electric Motor Industry, consider subscribing to industry newsletters, following relevant companies and organizations, or regularly checking reputable industry news sources and publications.
Methodology
Step 1 - Identification of Relevant Samples Size from Population Database


Step 2 - Approaches for Defining Global Market Size (Value, Volume* & Price*)

Note*: In applicable scenarios
Step 3 - Data Sources
Primary Research
- Web Analytics
- Survey Reports
- Research Institute
- Latest Research Reports
- Opinion Leaders
Secondary Research
- Annual Reports
- White Paper
- Latest Press Release
- Industry Association
- Paid Database
- Investor Presentations

Step 4 - Data Triangulation
Involves using different sources of information in order to increase the validity of a study
These sources are likely to be stakeholders in a program - participants, other researchers, program staff, other community members, and so on.
Then we put all data in single framework & apply various statistical tools to find out the dynamic on the market.
During the analysis stage, feedback from the stakeholder groups would be compared to determine areas of agreement as well as areas of divergence