

Key Insights
The Electronic Toll Collection (ETC) System market is experiencing robust growth, driven by increasing traffic congestion in urban areas and a rising preference for seamless and efficient travel. The market's Compound Annual Growth Rate (CAGR) exceeding 8% indicates significant expansion, projected to continue through 2033. This growth is fueled by several key factors. Governments worldwide are actively investing in infrastructure development, including the modernization of toll systems to enhance revenue collection and reduce traffic bottlenecks. The widespread adoption of electronic payment systems and the increasing penetration of smartphones are also contributing to the market's expansion. Furthermore, advancements in technology, such as the integration of Artificial Intelligence (AI) and the Internet of Things (IoT), are enabling more sophisticated and efficient ETC systems, further boosting market growth. The segment utilizing Electronic Toll Collection is expected to dominate the market due to its convenience and efficiency compared to barrier and entry/exit systems. Key applications driving demand include bridges, roads, and tunnels, with substantial opportunities for growth in developing economies experiencing rapid urbanization.
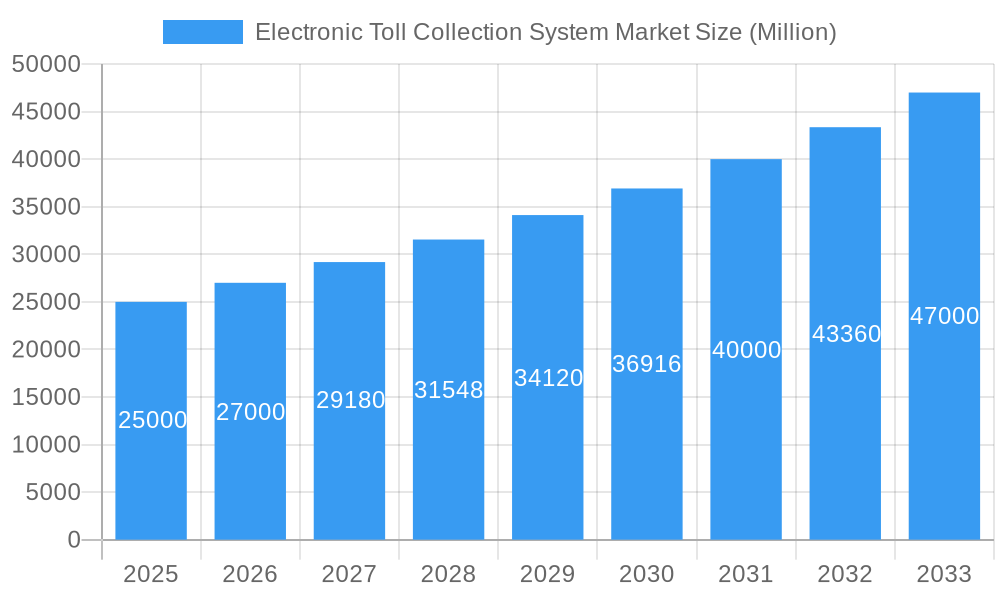
Electronic Toll Collection System Market Market Size (In Billion)
While the market shows immense potential, challenges remain. High initial investment costs for deploying ETC infrastructure, particularly in regions with limited technological advancement, could hinder growth. Concerns about data security and privacy related to the collection of user information through ETC systems also need careful consideration. Competition among established players and new entrants is intensifying, potentially influencing pricing strategies and market share distribution. However, the long-term outlook for the ETC market remains positive, driven by continuous technological innovation, increasing government investment, and the growing need for efficient transportation solutions globally. The market is geographically diverse, with North America, Europe, and Asia-Pacific representing major contributors, although emerging markets in regions like Latin America and Africa also present significant growth prospects.
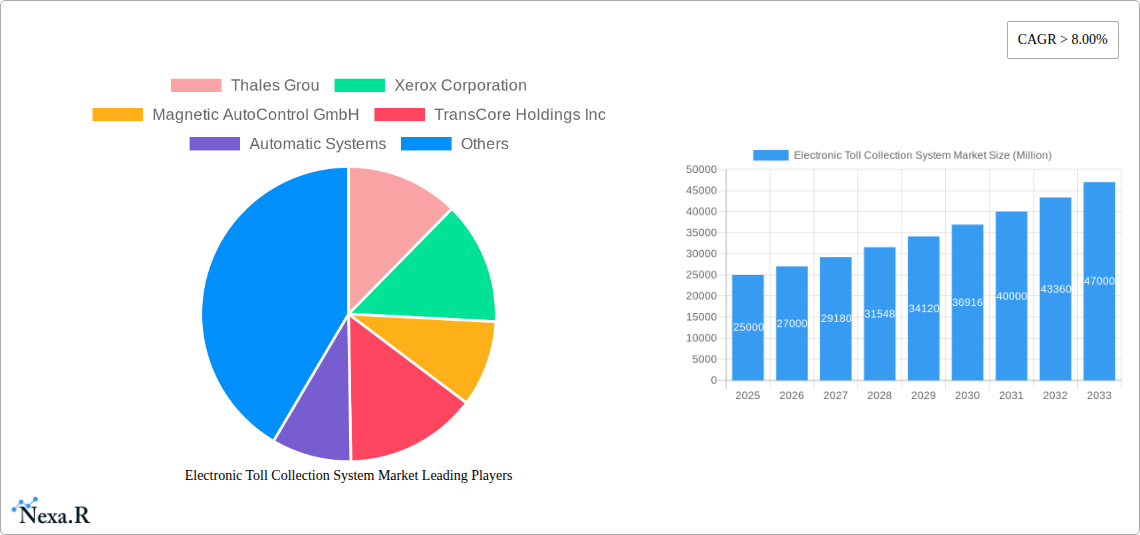
Electronic Toll Collection System Market Company Market Share
Electronic Toll Collection System Market: A Comprehensive Report (2019-2033)
This comprehensive report provides an in-depth analysis of the Electronic Toll Collection System market, encompassing market dynamics, growth trends, regional insights, product landscape, key players, and future outlook. The study period covers 2019-2033, with 2025 serving as the base and estimated year, and the forecast period spanning 2025-2033. The report segments the market by Toll Collection Type (Barrier Toll Collection, Entry/Exit Toll Collection, Electronic Toll Collection) and Application Type (Bridges, Roads, Tunnels), offering granular insights into this dynamic industry. The total market value in 2025 is estimated at xx Million.
Electronic Toll Collection System Market Dynamics & Structure
The Electronic Toll Collection System market is characterized by a moderately concentrated landscape, with key players vying for market share through technological innovation and strategic acquisitions. The market size in 2025 is estimated at xx Million. Technological advancements, particularly in RFID and GPS-based systems, are key drivers, while stringent regulatory frameworks and the emergence of competitive substitutes (e.g., alternative payment methods) pose challenges.
- Market Concentration: The top 5 players hold an estimated xx% market share in 2025.
- Technological Innovation: Investment in AI-powered toll systems and the integration of IoT are driving growth. However, high R&D costs present a barrier to entry for smaller players.
- Regulatory Frameworks: Government regulations concerning data privacy and system interoperability significantly influence market dynamics.
- Competitive Substitutes: The rise of mobile payment solutions and alternative transportation methods presents competitive pressure.
- End-User Demographics: The growth is driven by increasing urbanization and the need for efficient traffic management in densely populated areas.
- M&A Trends: The past five years have witnessed xx M&A deals, primarily focused on expanding geographical reach and technological capabilities.
Electronic Toll Collection System Market Growth Trends & Insights
The Electronic Toll Collection System market exhibits a robust growth trajectory, driven by rising infrastructure development globally and the increasing adoption of electronic toll collection systems to alleviate traffic congestion and improve efficiency. The market experienced a CAGR of xx% during the historical period (2019-2024) and is projected to maintain a CAGR of xx% during the forecast period (2025-2033). This growth is fueled by technological advancements such as the introduction of multi-lane free-flow systems, improved data analytics for traffic management, and the integration of these systems with smart city initiatives. Consumer behavior shifts toward cashless transactions and the preference for seamless travel experiences further contribute to market expansion. Market penetration is estimated at xx% in 2025, projected to increase to xx% by 2033.
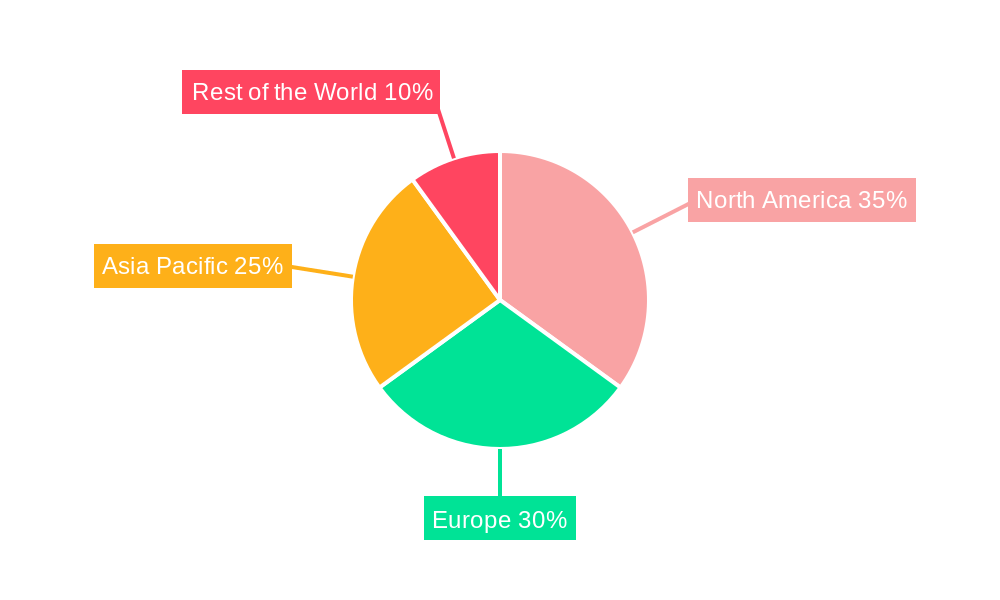
Dominant Regions, Countries, or Segments in Electronic Toll Collection System Market
North America currently dominates the Electronic Toll Collection System market, followed by Europe and Asia-Pacific. This dominance is attributed to robust infrastructure development, early adoption of advanced technologies, and supportive government policies. Within the segments, the Electronic Toll Collection type holds the largest market share, driven by its efficiency and reduced congestion. Similarly, the Roads application segment dominates due to the extensive road networks in developed regions.
- North America: High adoption rates of advanced ETC systems, coupled with substantial investments in infrastructure projects, drive market growth.
- Europe: Stringent environmental regulations and initiatives to reduce traffic congestion are stimulating the market.
- Asia-Pacific: Rapid urbanization and expanding transportation infrastructure are creating significant opportunities.
- By Toll Collection Type: Electronic Toll Collection dominates due to its efficiency and ease of use.
- By Application Type: Roads segment leads due to the high volume of traffic on roadways.
Electronic Toll Collection System Market Product Landscape
The Electronic Toll Collection System market offers a diverse range of products, from simple barrier systems to advanced multi-lane free-flow (MLFF) systems employing RFID, GPS, and ANPR technologies. These systems are designed to cater to varying traffic volumes and infrastructure needs. Key product innovations include improved accuracy, enhanced security features against fraud, and seamless integration with various payment platforms. The unique selling propositions often center around ease of use, reliability, reduced operational costs, and real-time data analytics capabilities. Technological advancements are focused on improving system interoperability, enhancing data security, and developing more efficient and environmentally friendly solutions.
Key Drivers, Barriers & Challenges in Electronic Toll Collection System Market
Key Drivers: Government initiatives to improve traffic management, increasing urbanization, the need for efficient toll collection, and technological advancements (e.g., AI, MLFF systems) drive market growth. The increasing adoption of cashless payment methods also contributes significantly.
Key Challenges: High initial investment costs for infrastructure upgrades, cybersecurity concerns related to data breaches, interoperability issues between different systems, and stringent regulatory compliance requirements pose significant challenges. The impact of these challenges is estimated to reduce market growth by approximately xx% by 2033.
Emerging Opportunities in Electronic Toll Collection System Market
Emerging opportunities lie in the expansion of ETC systems into developing economies, the integration of advanced analytics for traffic optimization, and the development of sustainable and environmentally friendly systems. The integration of ETC systems with other smart city initiatives presents a significant growth avenue. Moreover, the exploration of innovative payment methods, such as blockchain technology, offers potential for future expansion.
Growth Accelerators in the Electronic Toll Collection System Market Industry
Long-term growth will be accelerated by strategic partnerships between technology providers and infrastructure developers, government investments in smart city projects, and the continuous innovation of ETC systems to enhance efficiency, security, and sustainability. Furthermore, the increasing adoption of MLFF systems and the integration of AI for improved traffic management will play a crucial role.
Key Players Shaping the Electronic Toll Collection System Market Market
- Thales Group
- Xerox Corporation
- Magnetic AutoControl GmbH
- TransCore Holdings Inc
- Automatic Systems
- Feig Electronics
- TRMI Systems Integration
- Siemens AG
- Schneider Electric SE
- Nedap NV
- DENSO Corporation
- Mitsubishi Heavy Industries Ltd
Notable Milestones in Electronic Toll Collection System Market Sector
- 2021-Q3: Launch of a new AI-powered MLFF system by Thales Group.
- 2022-Q1: Acquisition of a smaller ETC provider by TransCore Holdings Inc, expanding its market share.
- 2023-Q2: Introduction of a new blockchain-based payment solution for ETC systems. (Further milestones can be added here as data becomes available)
In-Depth Electronic Toll Collection System Market Market Outlook
The Electronic Toll Collection System market is poised for continued strong growth, fueled by technological advancements, infrastructure development, and increasing demand for efficient traffic management solutions. Strategic partnerships and investments in R&D will further propel market expansion. The focus on sustainable and interoperable systems, along with the integration of AI and IoT technologies, will shape the future landscape, presenting significant opportunities for both established players and new entrants.
Electronic Toll Collection System Market Segmentation
-
1. Toll Collection Type
- 1.1. Barrier Toll Collection
- 1.2. Entry/Exit Toll Collection
- 1.3. Electronic Toll Collection
-
2. Application Type
- 2.1. Bridges
- 2.2. Roads
- 2.3. Tunnels
Electronic Toll Collection System Market Segmentation By Geography
-
1. North America
- 1.1. United States
- 1.2. Canada
- 1.3. Mexico
-
2. Europe
- 2.1. Germany
- 2.2. United Kingdom
- 2.3. France
- 2.4. Italy
- 2.5. Rest of Europe
-
3. Asia Pacific
- 3.1. China
- 3.2. Japan
- 3.3. India
- 3.4. South Korea
- 3.5. Rest of Asia Pacific
-
4. Rest of the World
- 4.1. Brazil
- 4.2. South Africa
- 4.3. Other Countries
Electronic Toll Collection System Market Regional Market Share
Geographic Coverage of Electronic Toll Collection System Market
Electronic Toll Collection System Market REPORT HIGHLIGHTS
| Aspects | Details |
|---|---|
| Study Period | 2020-2034 |
| Base Year | 2025 |
| Estimated Year | 2026 |
| Forecast Period | 2026-2034 |
| Historical Period | 2020-2025 |
| Growth Rate | CAGR of 8.34% from 2020-2034 |
| Segmentation |
|
Table of Contents
- 1. Introduction
- 1.1. Research Scope
- 1.2. Market Segmentation
- 1.3. Research Objective
- 1.4. Definitions and Assumptions
- 2. Executive Summary
- 2.1. Market Snapshot
- 3. Market Dynamics
- 3.1. Market Drivers
- 3.2. Market Restrains
- 3.3. Market Trends
- 3.4. Market Opportunities
- 4. Market Factor Analysis
- 4.1. Porters Five Forces
- 4.1.1. Bargaining Power of Suppliers
- 4.1.2. Bargaining Power of Buyers
- 4.1.3. Threat of New Entrants
- 4.1.4. Threat of Substitutes
- 4.1.5. Competitive Rivalry
- 4.2. PESTEL analysis
- 4.3. BCG Analysis
- 4.3.1. Stars (High Growth, High Market Share)
- 4.3.2. Cash Cows (Low Growth, High Market Share)
- 4.3.3. Question Mark (High Growth, Low Market Share)
- 4.3.4. Dogs (Low Growth, Low Market Share)
- 4.4. Ansoff Matrix Analysis
- 4.5. Supply Chain Analysis
- 4.6. Regulatory Landscape
- 4.7. Current Market Potential and Opportunity Assessment (TAM–SAM–SOM Framework)
- 4.8. NRP Analyst Note
- 4.1. Porters Five Forces
- 5. Market Analysis, Insights and Forecast 2021-2033
- 5.1. Market Analysis, Insights and Forecast - by Toll Collection Type
- 5.1.1. Barrier Toll Collection
- 5.1.2. Entry/Exit Toll Collection
- 5.1.3. Electronic Toll Collection
- 5.2. Market Analysis, Insights and Forecast - by Application Type
- 5.2.1. Bridges
- 5.2.2. Roads
- 5.2.3. Tunnels
- 5.3. Market Analysis, Insights and Forecast - by Region
- 5.3.1. North America
- 5.3.2. Europe
- 5.3.3. Asia Pacific
- 5.3.4. Rest of the World
- 5.1. Market Analysis, Insights and Forecast - by Toll Collection Type
- 6. Global Electronic Toll Collection System Market Analysis, Insights and Forecast, 2021-2033
- 6.1. Market Analysis, Insights and Forecast - by Toll Collection Type
- 6.1.1. Barrier Toll Collection
- 6.1.2. Entry/Exit Toll Collection
- 6.1.3. Electronic Toll Collection
- 6.2. Market Analysis, Insights and Forecast - by Application Type
- 6.2.1. Bridges
- 6.2.2. Roads
- 6.2.3. Tunnels
- 6.1. Market Analysis, Insights and Forecast - by Toll Collection Type
- 7. North America Electronic Toll Collection System Market Analysis, Insights and Forecast, 2020-2032
- 7.1. Market Analysis, Insights and Forecast - by Toll Collection Type
- 7.1.1. Barrier Toll Collection
- 7.1.2. Entry/Exit Toll Collection
- 7.1.3. Electronic Toll Collection
- 7.2. Market Analysis, Insights and Forecast - by Application Type
- 7.2.1. Bridges
- 7.2.2. Roads
- 7.2.3. Tunnels
- 7.1. Market Analysis, Insights and Forecast - by Toll Collection Type
- 8. Europe Electronic Toll Collection System Market Analysis, Insights and Forecast, 2020-2032
- 8.1. Market Analysis, Insights and Forecast - by Toll Collection Type
- 8.1.1. Barrier Toll Collection
- 8.1.2. Entry/Exit Toll Collection
- 8.1.3. Electronic Toll Collection
- 8.2. Market Analysis, Insights and Forecast - by Application Type
- 8.2.1. Bridges
- 8.2.2. Roads
- 8.2.3. Tunnels
- 8.1. Market Analysis, Insights and Forecast - by Toll Collection Type
- 9. Asia Pacific Electronic Toll Collection System Market Analysis, Insights and Forecast, 2020-2032
- 9.1. Market Analysis, Insights and Forecast - by Toll Collection Type
- 9.1.1. Barrier Toll Collection
- 9.1.2. Entry/Exit Toll Collection
- 9.1.3. Electronic Toll Collection
- 9.2. Market Analysis, Insights and Forecast - by Application Type
- 9.2.1. Bridges
- 9.2.2. Roads
- 9.2.3. Tunnels
- 9.1. Market Analysis, Insights and Forecast - by Toll Collection Type
- 10. Rest of the World Electronic Toll Collection System Market Analysis, Insights and Forecast, 2020-2032
- 10.1. Market Analysis, Insights and Forecast - by Toll Collection Type
- 10.1.1. Barrier Toll Collection
- 10.1.2. Entry/Exit Toll Collection
- 10.1.3. Electronic Toll Collection
- 10.2. Market Analysis, Insights and Forecast - by Application Type
- 10.2.1. Bridges
- 10.2.2. Roads
- 10.2.3. Tunnels
- 10.1. Market Analysis, Insights and Forecast - by Toll Collection Type
- 11. Competitive Analysis
- 11.1. Company Profiles
- 11.1.1 Thales Grou
- 11.1.1.1. Company Overview
- 11.1.1.2. Products
- 11.1.1.3. Company Financials
- 11.1.1.4. SWOT Analysis
- 11.1.2 Xerox Corporation
- 11.1.2.1. Company Overview
- 11.1.2.2. Products
- 11.1.2.3. Company Financials
- 11.1.2.4. SWOT Analysis
- 11.1.3 Magnetic AutoControl GmbH
- 11.1.3.1. Company Overview
- 11.1.3.2. Products
- 11.1.3.3. Company Financials
- 11.1.3.4. SWOT Analysis
- 11.1.4 TransCore Holdings Inc
- 11.1.4.1. Company Overview
- 11.1.4.2. Products
- 11.1.4.3. Company Financials
- 11.1.4.4. SWOT Analysis
- 11.1.5 Automatic Systems
- 11.1.5.1. Company Overview
- 11.1.5.2. Products
- 11.1.5.3. Company Financials
- 11.1.5.4. SWOT Analysis
- 11.1.6 Feig Electronics
- 11.1.6.1. Company Overview
- 11.1.6.2. Products
- 11.1.6.3. Company Financials
- 11.1.6.4. SWOT Analysis
- 11.1.7 TRMI Systems Integration
- 11.1.7.1. Company Overview
- 11.1.7.2. Products
- 11.1.7.3. Company Financials
- 11.1.7.4. SWOT Analysis
- 11.1.8 Siemens AG
- 11.1.8.1. Company Overview
- 11.1.8.2. Products
- 11.1.8.3. Company Financials
- 11.1.8.4. SWOT Analysis
- 11.1.9 Schneider Electric SE
- 11.1.9.1. Company Overview
- 11.1.9.2. Products
- 11.1.9.3. Company Financials
- 11.1.9.4. SWOT Analysis
- 11.1.10 Nedap NV
- 11.1.10.1. Company Overview
- 11.1.10.2. Products
- 11.1.10.3. Company Financials
- 11.1.10.4. SWOT Analysis
- 11.1.11 DENSO Corporation
- 11.1.11.1. Company Overview
- 11.1.11.2. Products
- 11.1.11.3. Company Financials
- 11.1.11.4. SWOT Analysis
- 11.1.12 Mitsubishi Heavy Industries Ltd
- 11.1.12.1. Company Overview
- 11.1.12.2. Products
- 11.1.12.3. Company Financials
- 11.1.12.4. SWOT Analysis
- 11.1.1 Thales Grou
- 11.2. Market Entropy
- 11.2.1 Company's Key Areas Served
- 11.2.2 Recent Developments
- 11.3. Company Market Share Analysis 2025
- 11.3.1 Top 5 Companies Market Share Analysis
- 11.3.2 Top 3 Companies Market Share Analysis
- 11.4. List of Potential Customers
- 12. Research Methodology
List of Figures
- Figure 1: Global Electronic Toll Collection System Market Revenue Breakdown (billion, %) by Region 2025 & 2033
- Figure 2: North America Electronic Toll Collection System Market Revenue (billion), by Toll Collection Type 2025 & 2033
- Figure 3: North America Electronic Toll Collection System Market Revenue Share (%), by Toll Collection Type 2025 & 2033
- Figure 4: North America Electronic Toll Collection System Market Revenue (billion), by Application Type 2025 & 2033
- Figure 5: North America Electronic Toll Collection System Market Revenue Share (%), by Application Type 2025 & 2033
- Figure 6: North America Electronic Toll Collection System Market Revenue (billion), by Country 2025 & 2033
- Figure 7: North America Electronic Toll Collection System Market Revenue Share (%), by Country 2025 & 2033
- Figure 8: Europe Electronic Toll Collection System Market Revenue (billion), by Toll Collection Type 2025 & 2033
- Figure 9: Europe Electronic Toll Collection System Market Revenue Share (%), by Toll Collection Type 2025 & 2033
- Figure 10: Europe Electronic Toll Collection System Market Revenue (billion), by Application Type 2025 & 2033
- Figure 11: Europe Electronic Toll Collection System Market Revenue Share (%), by Application Type 2025 & 2033
- Figure 12: Europe Electronic Toll Collection System Market Revenue (billion), by Country 2025 & 2033
- Figure 13: Europe Electronic Toll Collection System Market Revenue Share (%), by Country 2025 & 2033
- Figure 14: Asia Pacific Electronic Toll Collection System Market Revenue (billion), by Toll Collection Type 2025 & 2033
- Figure 15: Asia Pacific Electronic Toll Collection System Market Revenue Share (%), by Toll Collection Type 2025 & 2033
- Figure 16: Asia Pacific Electronic Toll Collection System Market Revenue (billion), by Application Type 2025 & 2033
- Figure 17: Asia Pacific Electronic Toll Collection System Market Revenue Share (%), by Application Type 2025 & 2033
- Figure 18: Asia Pacific Electronic Toll Collection System Market Revenue (billion), by Country 2025 & 2033
- Figure 19: Asia Pacific Electronic Toll Collection System Market Revenue Share (%), by Country 2025 & 2033
- Figure 20: Rest of the World Electronic Toll Collection System Market Revenue (billion), by Toll Collection Type 2025 & 2033
- Figure 21: Rest of the World Electronic Toll Collection System Market Revenue Share (%), by Toll Collection Type 2025 & 2033
- Figure 22: Rest of the World Electronic Toll Collection System Market Revenue (billion), by Application Type 2025 & 2033
- Figure 23: Rest of the World Electronic Toll Collection System Market Revenue Share (%), by Application Type 2025 & 2033
- Figure 24: Rest of the World Electronic Toll Collection System Market Revenue (billion), by Country 2025 & 2033
- Figure 25: Rest of the World Electronic Toll Collection System Market Revenue Share (%), by Country 2025 & 2033
List of Tables
- Table 1: Global Electronic Toll Collection System Market Revenue billion Forecast, by Toll Collection Type 2020 & 2033
- Table 2: Global Electronic Toll Collection System Market Revenue billion Forecast, by Application Type 2020 & 2033
- Table 3: Global Electronic Toll Collection System Market Revenue billion Forecast, by Region 2020 & 2033
- Table 4: Global Electronic Toll Collection System Market Revenue billion Forecast, by Toll Collection Type 2020 & 2033
- Table 5: Global Electronic Toll Collection System Market Revenue billion Forecast, by Application Type 2020 & 2033
- Table 6: Global Electronic Toll Collection System Market Revenue billion Forecast, by Country 2020 & 2033
- Table 7: United States Electronic Toll Collection System Market Revenue (billion) Forecast, by Application 2020 & 2033
- Table 8: Canada Electronic Toll Collection System Market Revenue (billion) Forecast, by Application 2020 & 2033
- Table 9: Mexico Electronic Toll Collection System Market Revenue (billion) Forecast, by Application 2020 & 2033
- Table 10: Global Electronic Toll Collection System Market Revenue billion Forecast, by Toll Collection Type 2020 & 2033
- Table 11: Global Electronic Toll Collection System Market Revenue billion Forecast, by Application Type 2020 & 2033
- Table 12: Global Electronic Toll Collection System Market Revenue billion Forecast, by Country 2020 & 2033
- Table 13: Germany Electronic Toll Collection System Market Revenue (billion) Forecast, by Application 2020 & 2033
- Table 14: United Kingdom Electronic Toll Collection System Market Revenue (billion) Forecast, by Application 2020 & 2033
- Table 15: France Electronic Toll Collection System Market Revenue (billion) Forecast, by Application 2020 & 2033
- Table 16: Italy Electronic Toll Collection System Market Revenue (billion) Forecast, by Application 2020 & 2033
- Table 17: Rest of Europe Electronic Toll Collection System Market Revenue (billion) Forecast, by Application 2020 & 2033
- Table 18: Global Electronic Toll Collection System Market Revenue billion Forecast, by Toll Collection Type 2020 & 2033
- Table 19: Global Electronic Toll Collection System Market Revenue billion Forecast, by Application Type 2020 & 2033
- Table 20: Global Electronic Toll Collection System Market Revenue billion Forecast, by Country 2020 & 2033
- Table 21: China Electronic Toll Collection System Market Revenue (billion) Forecast, by Application 2020 & 2033
- Table 22: Japan Electronic Toll Collection System Market Revenue (billion) Forecast, by Application 2020 & 2033
- Table 23: India Electronic Toll Collection System Market Revenue (billion) Forecast, by Application 2020 & 2033
- Table 24: South Korea Electronic Toll Collection System Market Revenue (billion) Forecast, by Application 2020 & 2033
- Table 25: Rest of Asia Pacific Electronic Toll Collection System Market Revenue (billion) Forecast, by Application 2020 & 2033
- Table 26: Global Electronic Toll Collection System Market Revenue billion Forecast, by Toll Collection Type 2020 & 2033
- Table 27: Global Electronic Toll Collection System Market Revenue billion Forecast, by Application Type 2020 & 2033
- Table 28: Global Electronic Toll Collection System Market Revenue billion Forecast, by Country 2020 & 2033
- Table 29: Brazil Electronic Toll Collection System Market Revenue (billion) Forecast, by Application 2020 & 2033
- Table 30: South Africa Electronic Toll Collection System Market Revenue (billion) Forecast, by Application 2020 & 2033
- Table 31: Other Countries Electronic Toll Collection System Market Revenue (billion) Forecast, by Application 2020 & 2033
Frequently Asked Questions
1. What is the projected Compound Annual Growth Rate (CAGR) of the Electronic Toll Collection System Market?
The projected CAGR is approximately 8.34%.
2. Which companies are prominent players in the Electronic Toll Collection System Market?
Key companies in the market include Thales Grou, Xerox Corporation, Magnetic AutoControl GmbH, TransCore Holdings Inc, Automatic Systems, Feig Electronics, TRMI Systems Integration, Siemens AG, Schneider Electric SE, Nedap NV, DENSO Corporation, Mitsubishi Heavy Industries Ltd.
3. What are the main segments of the Electronic Toll Collection System Market?
The market segments include Toll Collection Type, Application Type.
4. Can you provide details about the market size?
The market size is estimated to be USD 10.94 billion as of 2022.
5. What are some drivers contributing to market growth?
Rising Automotive Vehicle Sales Anticipated to Drive the Market.
6. What are the notable trends driving market growth?
Electronic Toll Collection is Expected to Witness the Highest Growth Rate.
7. Are there any restraints impacting market growth?
High Initial Cost Acting as Barrier for the Market.
8. Can you provide examples of recent developments in the market?
N/A
9. What pricing options are available for accessing the report?
Pricing options include single-user, multi-user, and enterprise licenses priced at USD 4750, USD 5250, and USD 8750 respectively.
10. Is the market size provided in terms of value or volume?
The market size is provided in terms of value, measured in billion.
11. Are there any specific market keywords associated with the report?
Yes, the market keyword associated with the report is "Electronic Toll Collection System Market," which aids in identifying and referencing the specific market segment covered.
12. How do I determine which pricing option suits my needs best?
The pricing options vary based on user requirements and access needs. Individual users may opt for single-user licenses, while businesses requiring broader access may choose multi-user or enterprise licenses for cost-effective access to the report.
13. Are there any additional resources or data provided in the Electronic Toll Collection System Market report?
While the report offers comprehensive insights, it's advisable to review the specific contents or supplementary materials provided to ascertain if additional resources or data are available.
14. How can I stay updated on further developments or reports in the Electronic Toll Collection System Market?
To stay informed about further developments, trends, and reports in the Electronic Toll Collection System Market, consider subscribing to industry newsletters, following relevant companies and organizations, or regularly checking reputable industry news sources and publications.
Methodology
Step 1 - Identification of Relevant Samples Size from Population Database


Step 2 - Approaches for Defining Global Market Size (Value, Volume* & Price*)

Note*: In applicable scenarios
Step 3 - Data Sources
Primary Research
- Web Analytics
- Survey Reports
- Research Institute
- Latest Research Reports
- Opinion Leaders
Secondary Research
- Annual Reports
- White Paper
- Latest Press Release
- Industry Association
- Paid Database
- Investor Presentations

Step 4 - Data Triangulation
Involves using different sources of information in order to increase the validity of a study
These sources are likely to be stakeholders in a program - participants, other researchers, program staff, other community members, and so on.
Then we put all data in single framework & apply various statistical tools to find out the dynamic on the market.
During the analysis stage, feedback from the stakeholder groups would be compared to determine areas of agreement as well as areas of divergence