

Key Insights
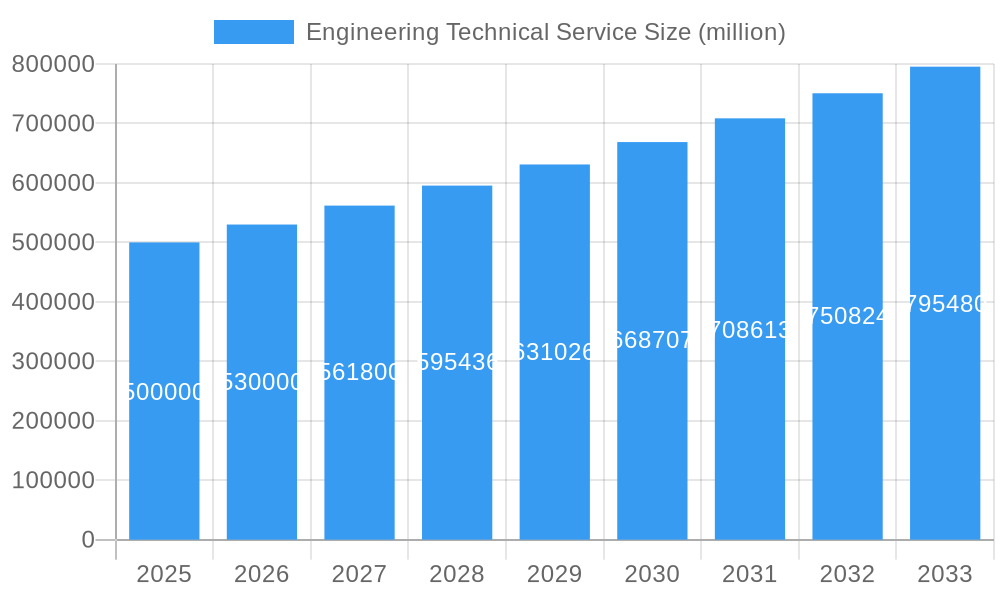
The global engineering technical services market is experiencing robust growth, driven by increasing infrastructure development, particularly in emerging economies, and the rising demand for advanced technological solutions across diverse sectors. The market, estimated at $500 billion in 2025, is projected to maintain a Compound Annual Growth Rate (CAGR) of 6% from 2025 to 2033, reaching approximately $800 billion by 2033. This expansion is fueled by several key factors, including the burgeoning adoption of Building Information Modeling (BIM) and digital twin technologies, the growing need for sustainable and environmentally friendly engineering solutions, and the increasing complexity of projects requiring specialized technical expertise. Major players like AECOM, WorleyParsons, SNC-Lavalin, Babcock International, and Fluor Corporation are strategically investing in research and development, expanding their service portfolios, and pursuing strategic acquisitions to maintain their competitive edge.
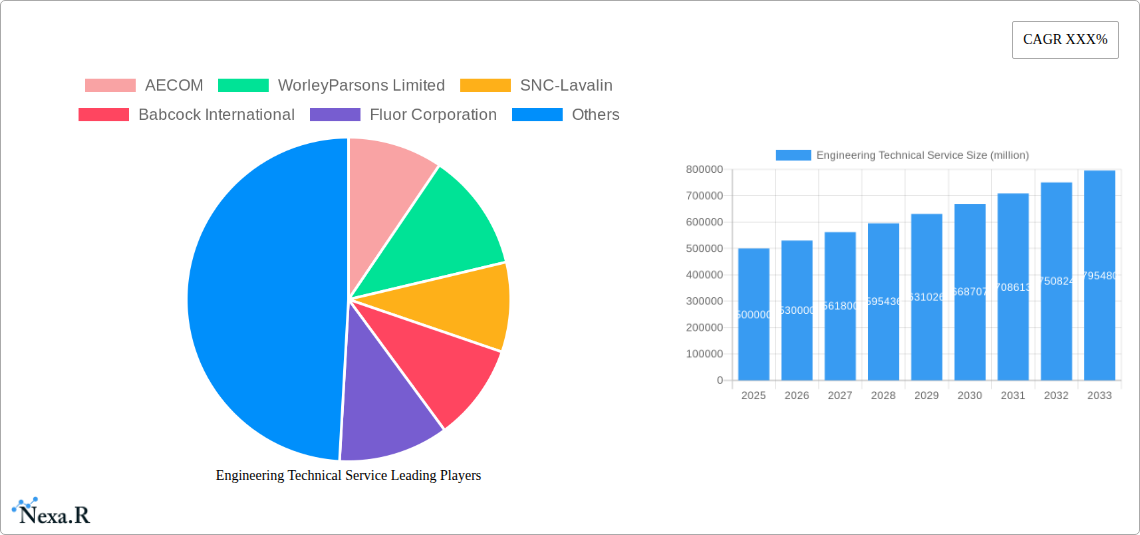
Engineering Technical Service Market Size (In Billion)
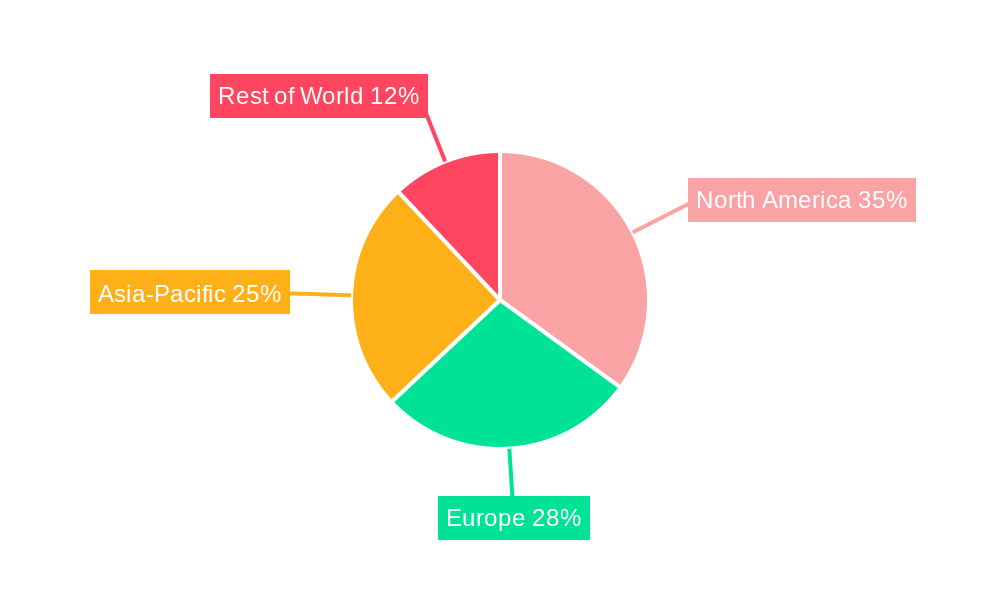
However, market growth faces some headwinds. Economic downturns, fluctuating commodity prices, and geopolitical instability can negatively impact project timelines and budgets. Furthermore, a shortage of skilled engineers and technicians poses a significant challenge to meeting the growing demand. To overcome these restraints, companies are focusing on talent acquisition and retention programs, investing in advanced training and upskilling initiatives, and embracing automation technologies to improve efficiency and productivity. The market is segmented by service type (e.g., consulting, design, construction management), industry vertical (e.g., energy, transportation, manufacturing), and geography. North America and Europe currently hold significant market shares, but the Asia-Pacific region is expected to witness the fastest growth due to substantial infrastructure investments. The forecast period (2025-2033) will likely see continued market consolidation, with larger firms acquiring smaller players to enhance their capabilities and geographical reach.
Engineering Technical Service Company Market Share
Engineering Technical Service Market Report: 2019-2033
This comprehensive report provides an in-depth analysis of the Engineering Technical Service market, encompassing market dynamics, growth trends, regional dominance, product landscape, key players, and future outlook. The study covers the period from 2019 to 2033, with a focus on the forecast period from 2025 to 2033. The base year is 2025 and the estimated year is also 2025. This report is designed for industry professionals, investors, and anyone seeking a detailed understanding of this rapidly evolving sector. The market size in 2025 is estimated at $xx million.
Engineering Technical Service Market Dynamics & Structure
The Engineering Technical Service market exhibits a moderately concentrated structure, with key players like AECOM, WorleyParsons Limited, SNC-Lavalin, Babcock International, and Fluor Corporation holding significant market share. The market is driven by technological innovations, particularly in areas like BIM (Building Information Modeling), digital twins, and AI-powered design and analysis tools. Regulatory frameworks, including environmental regulations and building codes, significantly influence market growth. Competitive product substitutes, such as automated design software and off-site construction methods, are also impacting the market. The end-user demographics are diverse, encompassing various industries like construction, energy, manufacturing, and transportation. M&A activity has been moderate over the historical period (2019-2024), with approximately xx deals valued at a total of $xx million.
- Market Concentration: Moderately concentrated, with top 5 players holding xx% market share in 2025.
- Technological Innovation Drivers: BIM, digital twins, AI-powered design tools.
- Regulatory Frameworks: Stringent environmental regulations and building codes.
- Competitive Substitutes: Automated design software, off-site construction methods.
- End-User Demographics: Construction, energy, manufacturing, transportation.
- M&A Trends: xx deals totaling $xx million (2019-2024). Increased consolidation expected in the forecast period.
- Innovation Barriers: High initial investment costs for new technologies, skills gap in adopting new software.
Engineering Technical Service Growth Trends & Insights
The Engineering Technical Service market has witnessed consistent growth over the historical period (2019-2024), with a CAGR of xx%. This growth is attributed to increasing infrastructure development globally, particularly in emerging economies, and the rising demand for sustainable and efficient engineering solutions. The adoption rate of advanced technologies like BIM and AI is gradually increasing, albeit at a moderate pace due to integration challenges. Consumer behavior shifts towards prioritizing sustainability and digitalization are shaping market demand. The market penetration of advanced engineering services is expected to reach xx% by 2033. The market is predicted to reach $xx million by 2033, driven by factors including increased government spending on infrastructure and growing demand for resilient infrastructure in the face of climate change.
Dominant Regions, Countries, or Segments in Engineering Technical Service
North America currently dominates the Engineering Technical Service market, driven by robust infrastructure investments and technological advancements. However, Asia-Pacific is expected to experience the fastest growth rate during the forecast period, fueled by rapid urbanization and industrialization, particularly in countries like China and India. Within segments, the building and infrastructure segment holds the largest market share, followed by energy and industrial segments.
- Key Drivers in North America: High government spending on infrastructure, strong technological base.
- Key Drivers in Asia-Pacific: Rapid urbanization, industrial expansion, government initiatives to improve infrastructure.
- Dominant Segment: Building and Infrastructure (xx% market share in 2025).
- Growth Potential: Asia-Pacific expected to exhibit the highest growth rate (xx% CAGR) during the forecast period.
Engineering Technical Service Product Landscape
The product landscape is characterized by a range of services, including design and engineering, project management, construction management, and commissioning. Technological advancements are leading to the development of more efficient and sustainable solutions, such as integrated design tools and smart building technologies. The unique selling propositions of various service providers are largely based on specialized expertise, technological proficiency, and project delivery capabilities.
Key Drivers, Barriers & Challenges in Engineering Technical Service
Key Drivers:
- Increasing investments in infrastructure development globally.
- Growing demand for sustainable and resilient infrastructure.
- Technological advancements in design and engineering tools.
- Stringent environmental regulations driving the need for efficient solutions.
Key Challenges and Restraints:
- Skilled labor shortages in engineering and construction sectors.
- Supply chain disruptions impacting project timelines and costs.
- Intense competition among service providers.
- Regulatory complexities and bureaucratic hurdles. These can lead to project delays and increased costs, impacting profitability by approximately xx% in some cases.
Emerging Opportunities in Engineering Technical Service
Emerging opportunities lie in the application of advanced technologies like AI and machine learning for predictive maintenance and asset management. There is also considerable growth potential in sustainable infrastructure development and the adoption of green building technologies. Furthermore, the expansion into untapped markets in developing economies presents significant opportunities for growth.
Growth Accelerators in the Engineering Technical Service Industry
Strategic partnerships between engineering firms and technology companies are accelerating the adoption of advanced technologies. Furthermore, the expansion into new geographic markets and the development of innovative service offerings are key drivers of long-term growth.
Key Players Shaping the Engineering Technical Service Market
Notable Milestones in Engineering Technical Service Sector
- 2020: Increased adoption of cloud-based design and collaboration tools.
- 2021: Launch of several AI-powered design software solutions.
- 2022: Several major M&A deals among engineering firms.
- 2023: Growing focus on sustainable infrastructure projects.
- 2024: Increased investment in digital twin technology.
In-Depth Engineering Technical Service Market Outlook
The Engineering Technical Service market is poised for continued growth, driven by technological advancements, rising infrastructure spending, and the increasing demand for sustainable solutions. Strategic partnerships, geographic expansion, and the development of innovative service offerings will be crucial for success in this dynamic market. The long-term outlook is positive, with significant potential for market expansion and profitability.
Engineering Technical Service Segmentation
-
1. Application
- 1.1. Automobile Industry
- 1.2. Industrial Manufacturing
- 1.3. Others
-
2. Type
- 2.1. Civil Engineering Services
- 2.2. Electrical Engineering Services
- 2.3. Mechanical Engineering Services
- 2.4. Others
Engineering Technical Service Segmentation By Geography
-
1. North America
- 1.1. United States
- 1.2. Canada
- 1.3. Mexico
-
2. South America
- 2.1. Brazil
- 2.2. Argentina
- 2.3. Rest of South America
-
3. Europe
- 3.1. United Kingdom
- 3.2. Germany
- 3.3. France
- 3.4. Italy
- 3.5. Spain
- 3.6. Russia
- 3.7. Benelux
- 3.8. Nordics
- 3.9. Rest of Europe
-
4. Middle East & Africa
- 4.1. Turkey
- 4.2. Israel
- 4.3. GCC
- 4.4. North Africa
- 4.5. South Africa
- 4.6. Rest of Middle East & Africa
-
5. Asia Pacific
- 5.1. China
- 5.2. India
- 5.3. Japan
- 5.4. South Korea
- 5.5. ASEAN
- 5.6. Oceania
- 5.7. Rest of Asia Pacific
Engineering Technical Service Regional Market Share
Geographic Coverage of Engineering Technical Service
Engineering Technical Service REPORT HIGHLIGHTS
| Aspects | Details |
|---|---|
| Study Period | 2020-2034 |
| Base Year | 2025 |
| Estimated Year | 2026 |
| Forecast Period | 2026-2034 |
| Historical Period | 2020-2025 |
| Growth Rate | CAGR of 4.2% from 2020-2034 |
| Segmentation |
|
Table of Contents
- 1. Introduction
- 1.1. Research Scope
- 1.2. Market Segmentation
- 1.3. Research Methodology
- 1.4. Definitions and Assumptions
- 2. Executive Summary
- 2.1. Introduction
- 3. Market Dynamics
- 3.1. Introduction
- 3.2. Market Drivers
- 3.3. Market Restrains
- 3.4. Market Trends
- 4. Market Factor Analysis
- 4.1. Porters Five Forces
- 4.2. Supply/Value Chain
- 4.3. PESTEL analysis
- 4.4. Market Entropy
- 4.5. Patent/Trademark Analysis
- 5. Global Engineering Technical Service Analysis, Insights and Forecast, 2020-2032
- 5.1. Market Analysis, Insights and Forecast - by Application
- 5.1.1. Automobile Industry
- 5.1.2. Industrial Manufacturing
- 5.1.3. Others
- 5.2. Market Analysis, Insights and Forecast - by Type
- 5.2.1. Civil Engineering Services
- 5.2.2. Electrical Engineering Services
- 5.2.3. Mechanical Engineering Services
- 5.2.4. Others
- 5.3. Market Analysis, Insights and Forecast - by Region
- 5.3.1. North America
- 5.3.2. South America
- 5.3.3. Europe
- 5.3.4. Middle East & Africa
- 5.3.5. Asia Pacific
- 5.1. Market Analysis, Insights and Forecast - by Application
- 6. North America Engineering Technical Service Analysis, Insights and Forecast, 2020-2032
- 6.1. Market Analysis, Insights and Forecast - by Application
- 6.1.1. Automobile Industry
- 6.1.2. Industrial Manufacturing
- 6.1.3. Others
- 6.2. Market Analysis, Insights and Forecast - by Type
- 6.2.1. Civil Engineering Services
- 6.2.2. Electrical Engineering Services
- 6.2.3. Mechanical Engineering Services
- 6.2.4. Others
- 6.1. Market Analysis, Insights and Forecast - by Application
- 7. South America Engineering Technical Service Analysis, Insights and Forecast, 2020-2032
- 7.1. Market Analysis, Insights and Forecast - by Application
- 7.1.1. Automobile Industry
- 7.1.2. Industrial Manufacturing
- 7.1.3. Others
- 7.2. Market Analysis, Insights and Forecast - by Type
- 7.2.1. Civil Engineering Services
- 7.2.2. Electrical Engineering Services
- 7.2.3. Mechanical Engineering Services
- 7.2.4. Others
- 7.1. Market Analysis, Insights and Forecast - by Application
- 8. Europe Engineering Technical Service Analysis, Insights and Forecast, 2020-2032
- 8.1. Market Analysis, Insights and Forecast - by Application
- 8.1.1. Automobile Industry
- 8.1.2. Industrial Manufacturing
- 8.1.3. Others
- 8.2. Market Analysis, Insights and Forecast - by Type
- 8.2.1. Civil Engineering Services
- 8.2.2. Electrical Engineering Services
- 8.2.3. Mechanical Engineering Services
- 8.2.4. Others
- 8.1. Market Analysis, Insights and Forecast - by Application
- 9. Middle East & Africa Engineering Technical Service Analysis, Insights and Forecast, 2020-2032
- 9.1. Market Analysis, Insights and Forecast - by Application
- 9.1.1. Automobile Industry
- 9.1.2. Industrial Manufacturing
- 9.1.3. Others
- 9.2. Market Analysis, Insights and Forecast - by Type
- 9.2.1. Civil Engineering Services
- 9.2.2. Electrical Engineering Services
- 9.2.3. Mechanical Engineering Services
- 9.2.4. Others
- 9.1. Market Analysis, Insights and Forecast - by Application
- 10. Asia Pacific Engineering Technical Service Analysis, Insights and Forecast, 2020-2032
- 10.1. Market Analysis, Insights and Forecast - by Application
- 10.1.1. Automobile Industry
- 10.1.2. Industrial Manufacturing
- 10.1.3. Others
- 10.2. Market Analysis, Insights and Forecast - by Type
- 10.2.1. Civil Engineering Services
- 10.2.2. Electrical Engineering Services
- 10.2.3. Mechanical Engineering Services
- 10.2.4. Others
- 10.1. Market Analysis, Insights and Forecast - by Application
- 11. Competitive Analysis
- 11.1. Global Market Share Analysis 2025
- 11.2. Company Profiles
- 11.2.1 AECOM
- 11.2.1.1. Overview
- 11.2.1.2. Products
- 11.2.1.3. SWOT Analysis
- 11.2.1.4. Recent Developments
- 11.2.1.5. Financials (Based on Availability)
- 11.2.2 WorleyParsons Limited
- 11.2.2.1. Overview
- 11.2.2.2. Products
- 11.2.2.3. SWOT Analysis
- 11.2.2.4. Recent Developments
- 11.2.2.5. Financials (Based on Availability)
- 11.2.3 SNC-Lavalin
- 11.2.3.1. Overview
- 11.2.3.2. Products
- 11.2.3.3. SWOT Analysis
- 11.2.3.4. Recent Developments
- 11.2.3.5. Financials (Based on Availability)
- 11.2.4 Babcock International
- 11.2.4.1. Overview
- 11.2.4.2. Products
- 11.2.4.3. SWOT Analysis
- 11.2.4.4. Recent Developments
- 11.2.4.5. Financials (Based on Availability)
- 11.2.5 Fluor Corporation
- 11.2.5.1. Overview
- 11.2.5.2. Products
- 11.2.5.3. SWOT Analysis
- 11.2.5.4. Recent Developments
- 11.2.5.5. Financials (Based on Availability)
- 11.2.1 AECOM
List of Figures
- Figure 1: Global Engineering Technical Service Revenue Breakdown (undefined, %) by Region 2025 & 2033
- Figure 2: North America Engineering Technical Service Revenue (undefined), by Application 2025 & 2033
- Figure 3: North America Engineering Technical Service Revenue Share (%), by Application 2025 & 2033
- Figure 4: North America Engineering Technical Service Revenue (undefined), by Type 2025 & 2033
- Figure 5: North America Engineering Technical Service Revenue Share (%), by Type 2025 & 2033
- Figure 6: North America Engineering Technical Service Revenue (undefined), by Country 2025 & 2033
- Figure 7: North America Engineering Technical Service Revenue Share (%), by Country 2025 & 2033
- Figure 8: South America Engineering Technical Service Revenue (undefined), by Application 2025 & 2033
- Figure 9: South America Engineering Technical Service Revenue Share (%), by Application 2025 & 2033
- Figure 10: South America Engineering Technical Service Revenue (undefined), by Type 2025 & 2033
- Figure 11: South America Engineering Technical Service Revenue Share (%), by Type 2025 & 2033
- Figure 12: South America Engineering Technical Service Revenue (undefined), by Country 2025 & 2033
- Figure 13: South America Engineering Technical Service Revenue Share (%), by Country 2025 & 2033
- Figure 14: Europe Engineering Technical Service Revenue (undefined), by Application 2025 & 2033
- Figure 15: Europe Engineering Technical Service Revenue Share (%), by Application 2025 & 2033
- Figure 16: Europe Engineering Technical Service Revenue (undefined), by Type 2025 & 2033
- Figure 17: Europe Engineering Technical Service Revenue Share (%), by Type 2025 & 2033
- Figure 18: Europe Engineering Technical Service Revenue (undefined), by Country 2025 & 2033
- Figure 19: Europe Engineering Technical Service Revenue Share (%), by Country 2025 & 2033
- Figure 20: Middle East & Africa Engineering Technical Service Revenue (undefined), by Application 2025 & 2033
- Figure 21: Middle East & Africa Engineering Technical Service Revenue Share (%), by Application 2025 & 2033
- Figure 22: Middle East & Africa Engineering Technical Service Revenue (undefined), by Type 2025 & 2033
- Figure 23: Middle East & Africa Engineering Technical Service Revenue Share (%), by Type 2025 & 2033
- Figure 24: Middle East & Africa Engineering Technical Service Revenue (undefined), by Country 2025 & 2033
- Figure 25: Middle East & Africa Engineering Technical Service Revenue Share (%), by Country 2025 & 2033
- Figure 26: Asia Pacific Engineering Technical Service Revenue (undefined), by Application 2025 & 2033
- Figure 27: Asia Pacific Engineering Technical Service Revenue Share (%), by Application 2025 & 2033
- Figure 28: Asia Pacific Engineering Technical Service Revenue (undefined), by Type 2025 & 2033
- Figure 29: Asia Pacific Engineering Technical Service Revenue Share (%), by Type 2025 & 2033
- Figure 30: Asia Pacific Engineering Technical Service Revenue (undefined), by Country 2025 & 2033
- Figure 31: Asia Pacific Engineering Technical Service Revenue Share (%), by Country 2025 & 2033
List of Tables
- Table 1: Global Engineering Technical Service Revenue undefined Forecast, by Application 2020 & 2033
- Table 2: Global Engineering Technical Service Revenue undefined Forecast, by Type 2020 & 2033
- Table 3: Global Engineering Technical Service Revenue undefined Forecast, by Region 2020 & 2033
- Table 4: Global Engineering Technical Service Revenue undefined Forecast, by Application 2020 & 2033
- Table 5: Global Engineering Technical Service Revenue undefined Forecast, by Type 2020 & 2033
- Table 6: Global Engineering Technical Service Revenue undefined Forecast, by Country 2020 & 2033
- Table 7: United States Engineering Technical Service Revenue (undefined) Forecast, by Application 2020 & 2033
- Table 8: Canada Engineering Technical Service Revenue (undefined) Forecast, by Application 2020 & 2033
- Table 9: Mexico Engineering Technical Service Revenue (undefined) Forecast, by Application 2020 & 2033
- Table 10: Global Engineering Technical Service Revenue undefined Forecast, by Application 2020 & 2033
- Table 11: Global Engineering Technical Service Revenue undefined Forecast, by Type 2020 & 2033
- Table 12: Global Engineering Technical Service Revenue undefined Forecast, by Country 2020 & 2033
- Table 13: Brazil Engineering Technical Service Revenue (undefined) Forecast, by Application 2020 & 2033
- Table 14: Argentina Engineering Technical Service Revenue (undefined) Forecast, by Application 2020 & 2033
- Table 15: Rest of South America Engineering Technical Service Revenue (undefined) Forecast, by Application 2020 & 2033
- Table 16: Global Engineering Technical Service Revenue undefined Forecast, by Application 2020 & 2033
- Table 17: Global Engineering Technical Service Revenue undefined Forecast, by Type 2020 & 2033
- Table 18: Global Engineering Technical Service Revenue undefined Forecast, by Country 2020 & 2033
- Table 19: United Kingdom Engineering Technical Service Revenue (undefined) Forecast, by Application 2020 & 2033
- Table 20: Germany Engineering Technical Service Revenue (undefined) Forecast, by Application 2020 & 2033
- Table 21: France Engineering Technical Service Revenue (undefined) Forecast, by Application 2020 & 2033
- Table 22: Italy Engineering Technical Service Revenue (undefined) Forecast, by Application 2020 & 2033
- Table 23: Spain Engineering Technical Service Revenue (undefined) Forecast, by Application 2020 & 2033
- Table 24: Russia Engineering Technical Service Revenue (undefined) Forecast, by Application 2020 & 2033
- Table 25: Benelux Engineering Technical Service Revenue (undefined) Forecast, by Application 2020 & 2033
- Table 26: Nordics Engineering Technical Service Revenue (undefined) Forecast, by Application 2020 & 2033
- Table 27: Rest of Europe Engineering Technical Service Revenue (undefined) Forecast, by Application 2020 & 2033
- Table 28: Global Engineering Technical Service Revenue undefined Forecast, by Application 2020 & 2033
- Table 29: Global Engineering Technical Service Revenue undefined Forecast, by Type 2020 & 2033
- Table 30: Global Engineering Technical Service Revenue undefined Forecast, by Country 2020 & 2033
- Table 31: Turkey Engineering Technical Service Revenue (undefined) Forecast, by Application 2020 & 2033
- Table 32: Israel Engineering Technical Service Revenue (undefined) Forecast, by Application 2020 & 2033
- Table 33: GCC Engineering Technical Service Revenue (undefined) Forecast, by Application 2020 & 2033
- Table 34: North Africa Engineering Technical Service Revenue (undefined) Forecast, by Application 2020 & 2033
- Table 35: South Africa Engineering Technical Service Revenue (undefined) Forecast, by Application 2020 & 2033
- Table 36: Rest of Middle East & Africa Engineering Technical Service Revenue (undefined) Forecast, by Application 2020 & 2033
- Table 37: Global Engineering Technical Service Revenue undefined Forecast, by Application 2020 & 2033
- Table 38: Global Engineering Technical Service Revenue undefined Forecast, by Type 2020 & 2033
- Table 39: Global Engineering Technical Service Revenue undefined Forecast, by Country 2020 & 2033
- Table 40: China Engineering Technical Service Revenue (undefined) Forecast, by Application 2020 & 2033
- Table 41: India Engineering Technical Service Revenue (undefined) Forecast, by Application 2020 & 2033
- Table 42: Japan Engineering Technical Service Revenue (undefined) Forecast, by Application 2020 & 2033
- Table 43: South Korea Engineering Technical Service Revenue (undefined) Forecast, by Application 2020 & 2033
- Table 44: ASEAN Engineering Technical Service Revenue (undefined) Forecast, by Application 2020 & 2033
- Table 45: Oceania Engineering Technical Service Revenue (undefined) Forecast, by Application 2020 & 2033
- Table 46: Rest of Asia Pacific Engineering Technical Service Revenue (undefined) Forecast, by Application 2020 & 2033
Frequently Asked Questions
1. What is the projected Compound Annual Growth Rate (CAGR) of the Engineering Technical Service?
The projected CAGR is approximately 4.2%.
2. Which companies are prominent players in the Engineering Technical Service?
Key companies in the market include AECOM, WorleyParsons Limited, SNC-Lavalin, Babcock International, Fluor Corporation.
3. What are the main segments of the Engineering Technical Service?
The market segments include Application, Type.
4. Can you provide details about the market size?
The market size is estimated to be USD XXX N/A as of 2022.
5. What are some drivers contributing to market growth?
N/A
6. What are the notable trends driving market growth?
N/A
7. Are there any restraints impacting market growth?
N/A
8. Can you provide examples of recent developments in the market?
N/A
9. What pricing options are available for accessing the report?
Pricing options include single-user, multi-user, and enterprise licenses priced at USD 3950.00, USD 5925.00, and USD 7900.00 respectively.
10. Is the market size provided in terms of value or volume?
The market size is provided in terms of value, measured in N/A.
11. Are there any specific market keywords associated with the report?
Yes, the market keyword associated with the report is "Engineering Technical Service," which aids in identifying and referencing the specific market segment covered.
12. How do I determine which pricing option suits my needs best?
The pricing options vary based on user requirements and access needs. Individual users may opt for single-user licenses, while businesses requiring broader access may choose multi-user or enterprise licenses for cost-effective access to the report.
13. Are there any additional resources or data provided in the Engineering Technical Service report?
While the report offers comprehensive insights, it's advisable to review the specific contents or supplementary materials provided to ascertain if additional resources or data are available.
14. How can I stay updated on further developments or reports in the Engineering Technical Service?
To stay informed about further developments, trends, and reports in the Engineering Technical Service, consider subscribing to industry newsletters, following relevant companies and organizations, or regularly checking reputable industry news sources and publications.
Methodology
Step 1 - Identification of Relevant Samples Size from Population Database


Step 2 - Approaches for Defining Global Market Size (Value, Volume* & Price*)

Note*: In applicable scenarios
Step 3 - Data Sources
Primary Research
- Web Analytics
- Survey Reports
- Research Institute
- Latest Research Reports
- Opinion Leaders
Secondary Research
- Annual Reports
- White Paper
- Latest Press Release
- Industry Association
- Paid Database
- Investor Presentations

Step 4 - Data Triangulation
Involves using different sources of information in order to increase the validity of a study
These sources are likely to be stakeholders in a program - participants, other researchers, program staff, other community members, and so on.
Then we put all data in single framework & apply various statistical tools to find out the dynamic on the market.
During the analysis stage, feedback from the stakeholder groups would be compared to determine areas of agreement as well as areas of divergence