

Key Insights
The Europe Power-to-Gas market is projected for substantial growth, anticipated to reach $46.76 billion by 2025, with a CAGR of 11.35% from 2025 to 2033. This expansion is driven by the global shift towards renewable energy and the imperative for energy sector decarbonization. The integration of variable renewable sources like solar and wind necessitates advanced energy storage and grid stabilization solutions, making power-to-gas technologies indispensable. Supportive government policies, stringent climate objectives, and increased investment in hydrogen infrastructure are further propelling market growth. The "Power-to-Methane" segment, utilizing both chemical and biological methanation, is expected to lead, enabling synthetic natural gas production for grid injection and fuel applications.
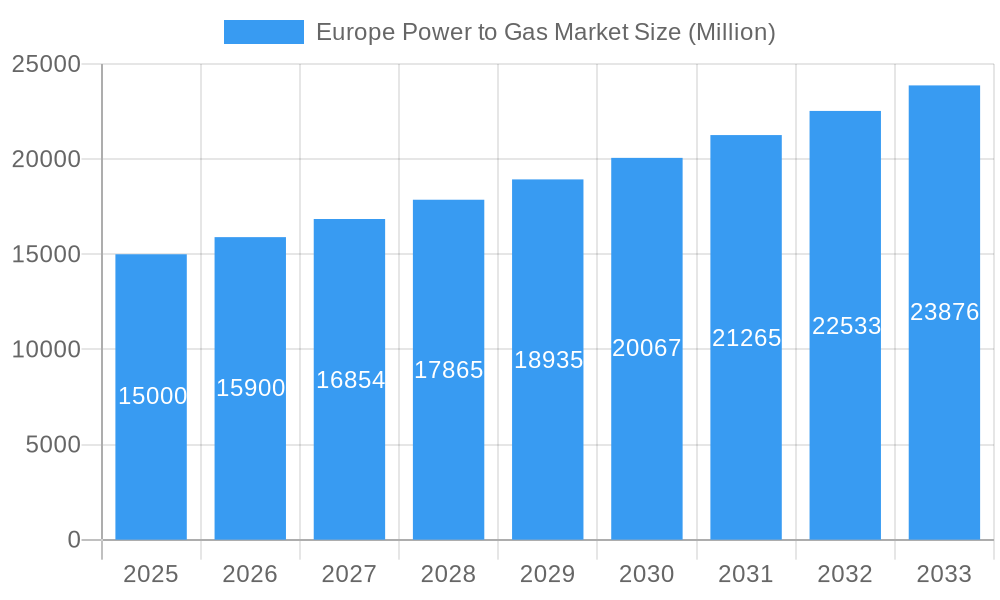
Europe Power to Gas Market Market Size (In Billion)
Key market drivers include advancements in green hydrogen production via electrolysis, improving electrolyzer scalability and cost-effectiveness. The utilization of industrial waste heat and CO2 in methanation projects also reinforces circular economy principles. However, challenges such as high initial capital investment for power-to-gas facilities, inconsistent regulatory frameworks across Europe, and the cost competitiveness of synthetic methane against fossil fuels require strategic attention. Despite these hurdles, ongoing investments and technological innovation position the Europe Power-to-Gas market as a critical enabler of Europe's clean energy transition.
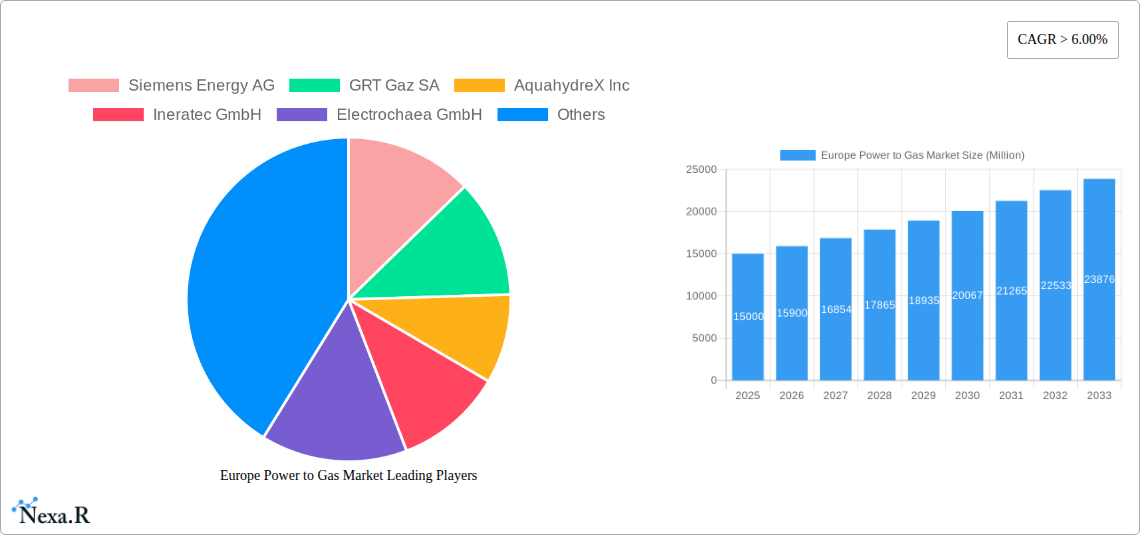
Europe Power to Gas Market Company Market Share
Europe Power to Gas Market: Comprehensive Analysis & Future Outlook (2019-2033)
This report offers an in-depth analysis of the burgeoning Europe Power to Gas (P2G) market, a critical component in the continent's transition to a sustainable energy future. We delve into the intricate dynamics, growth trends, regional dominance, product landscape, and key players shaping this transformative sector. With a study period from 2019 to 2033, including a base year of 2025 and a forecast period from 2025 to 2033, this report provides actionable insights for stakeholders seeking to capitalize on the opportunities presented by P2G technologies.
The P2G market encompasses technologies that convert renewable electricity into storable gases, primarily hydrogen and synthetic methane, addressing intermittency challenges of renewables and decarbonizing various sectors. Our analysis covers parent markets such as the Renewable Energy Market and Hydrogen Production Market, alongside child markets like Power-to-Hydrogen Market and Power-to-Methane Market. Key segments explored include technologies like Power-to-Gas and Power-to-Methane (including Chemical and Biological), capacities ranging from Less than 100 KW to More than 1000 KW, and end-users including Utilities, Industrial, and Commercial sectors across prominent European nations like the United Kingdom, Germany, and France.
Keywords: Europe Power to Gas Market, Power to Gas, P2G, Green Hydrogen, Synthetic Methane, Electrolysis, Renewable Energy, Energy Storage, Decarbonization, Hydrogen Economy, Power-to-Methane, Power-to-Hydrogen, Germany Power to Gas, UK Power to Gas, France Power to Gas, Industrial Hydrogen, Utilities, Commercial P2G, Energy Sector, Future Energy.
Europe Power to Gas Market Market Dynamics & Structure
The Europe Power to Gas market is characterized by dynamic interplay between rapid technological innovation and evolving regulatory frameworks. Market concentration is currently moderate, with several established energy and industrial gas players alongside innovative P2G technology providers. Technological innovation is primarily driven by the urgent need for decarbonization and energy security, with significant investments in advanced electrolysis technologies and methanation processes. Regulatory frameworks, such as the EU's Renewable Energy Directive and national hydrogen strategies, are increasingly supportive, creating a favorable environment for P2G deployment. Competitive product substitutes include traditional fossil fuels and other energy storage solutions, but the unique benefits of P2G in terms of long-duration storage and sector coupling offer a distinct advantage. End-user demographics are expanding beyond utilities to include industrial sectors seeking to decarbonize their processes and commercial entities looking for sustainable energy solutions. Mergers and acquisitions (M&A) are a growing trend as larger companies seek to acquire P2G expertise and scale up operations.
- Market Concentration: Moderate, with key players including Siemens Energy AG, GRT Gaz SA, AquahydreX Inc, Ineratec GmbH, Electrochaea GmbH, Sempra Energy, and Nel ASA.
- Technological Innovation Drivers: Decarbonization targets, renewable energy intermittency, energy security concerns, and decreasing electrolyzer costs.
- Regulatory Frameworks: Supportive policies include renewable energy targets, hydrogen strategies, carbon pricing mechanisms, and funding for P2G projects.
- Competitive Product Substitutes: Battery storage, compressed air energy storage, and direct use of renewables.
- End-User Demographics: Growing adoption by Utilities for grid balancing, Industrial sectors (e.g., chemicals, refining) for process heat and feedstocks, and Commercial entities for fleet electrification and building heating.
- M&A Trends: Increasing consolidation as companies acquire P2G technology developers and project integrators.
Europe Power to Gas Market Growth Trends & Insights
The Europe Power to Gas market is poised for exponential growth, driven by a confluence of factors including aggressive climate change mitigation targets, the imperative to integrate intermittent renewable energy sources, and the increasing demand for green hydrogen and synthetic fuels across various industries. The market size is projected to expand significantly from xx Million units in 2025 to xx Million units by 2033, exhibiting a robust Compound Annual Growth Rate (CAGR) of xx%. Adoption rates for P2G technologies are accelerating, spurred by technological advancements that are making electrolyzers more efficient and cost-effective. For instance, the decreasing capital expenditure for electrolyzers is a major disruptor, lowering the Levelized Cost of Hydrogen (LCOH). Consumer behavior is shifting towards sustainability, with industries actively seeking decarbonization solutions and governments prioritizing investments in green energy infrastructure. The integration of P2G into the broader energy system, enabling the storage of surplus renewable electricity and its conversion into transport fuels, heating, or industrial feedstocks, is a key trend. This sector coupling not only enhances grid stability but also unlocks new revenue streams and promotes a circular economy. The increasing prevalence of large-scale electrolysis projects, coupled with the development of advanced methanation processes to produce synthetic methane, signifies a maturing market ready for widespread deployment. Market penetration is expected to deepen as policy support solidifies and the business case for P2G becomes increasingly compelling.
Dominant Regions, Countries, or Segments in Europe Power to Gas Market
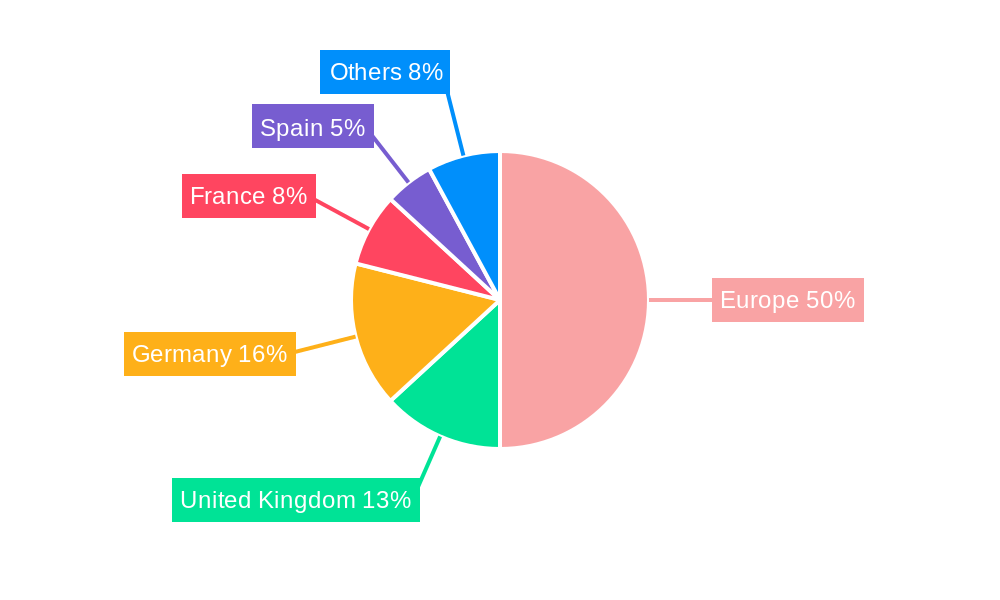
The Europe Power to Gas market's dominance is currently concentrated within Germany, driven by its proactive energy transition policies, substantial investments in renewable energy infrastructure, and a strong industrial base with a significant demand for hydrogen. Germany’s commitment to phasing out fossil fuels and its comprehensive national hydrogen strategy provide a fertile ground for P2G technologies. The Utilities end-user segment is a primary driver of growth, leveraging P2G for grid balancing, energy storage, and the production of green hydrogen to decarbonize their operations.
- Leading Region/Country: Germany, supported by the United Kingdom and France, with substantial growth potential in Spain and other EU nations.
- Dominant Segment (End-User): Utilities, due to their critical role in grid management and their increasing focus on renewable energy integration and decarbonization.
- Dominant Segment (Technology): Power-to-Gas, with Power-to-Methane (including Chemical and Biological) gaining significant traction as a means to create a carbon-neutral synthetic natural gas.
- Dominant Segment (Capacity): The More than 1000 KW capacity segment is experiencing the most rapid expansion, driven by the deployment of large-scale industrial and utility-level P2G plants. The 100 to 1000 KW segment is also crucial for regional and smaller industrial applications.
Key Drivers of Dominance:
- Economic Policies: Generous subsidies, tax incentives, and long-term power purchase agreements for green hydrogen and synthetic fuels.
- Infrastructure Development: Significant investments in electrolysis plants, hydrogen pipelines, and refueling stations.
- Regulatory Support: Robust national and EU-level policies and targets for renewable energy and greenhouse gas emission reductions.
- Industrial Demand: A large and established industrial sector actively seeking decarbonization solutions and alternative feedstocks.
- Research & Development: Strong commitment to innovation and pilot projects, fostering technological advancements and cost reductions.
Europe Power to Gas Market Product Landscape
The Europe Power to Gas market is witnessing a rapid evolution in its product landscape, characterized by increasing efficiency, scalability, and cost-competitiveness of P2G technologies. Innovations are focused on improving electrolyzer performance, with advancements in Proton Exchange Membrane (PEM) and Alkaline electrolyzer technologies leading to higher hydrogen production rates and lower energy consumption. Furthermore, the development of advanced methanation catalysts and reactor designs is enhancing the efficiency of synthetic methane production from hydrogen and captured CO2. Applications are diversifying beyond simple hydrogen production to include the creation of synthetic fuels for transportation, decarbonization of industrial heat, and the injection of synthetic methane into existing natural gas grids. Performance metrics are steadily improving, with electrolyzers achieving higher current densities and longer operational lifetimes, while methanation processes are reaching higher conversion rates and purities. Unique selling propositions of P2G products include their ability to store intermittent renewable energy, provide grid flexibility, and offer a pathway to decarbonize hard-to-abate sectors.
Key Drivers, Barriers & Challenges in Europe Power to Gas Market
The Europe Power to Gas market is propelled by several key drivers, primarily the urgent need for decarbonization across all sectors to meet ambitious climate targets set by governments and international bodies. The increasing penetration of renewable energy sources like solar and wind necessitates effective energy storage solutions to manage their intermittency, a role P2G technologies are uniquely positioned to fill. Furthermore, the growing demand for green hydrogen as a clean fuel and industrial feedstock, particularly in sectors like transport, heavy industry, and chemicals, acts as a significant growth catalyst. Policy support in the form of subsidies, tax incentives, and favorable regulatory frameworks is also a crucial driver.
However, the market faces substantial barriers and challenges. High upfront capital costs for electrolysis and methanation equipment remain a significant hurdle, despite ongoing cost reductions. The availability and cost of renewable electricity are critical, as the "green" credentials of P2G depend on a truly renewable energy supply. Regulatory uncertainties and the need for harmonized standards across different European countries can slow down project development and investment. Supply chain constraints for key components, such as rare earth materials for electrolyzers, can also pose a challenge. Finally, public perception and acceptance of hydrogen as a fuel, along with ensuring safe storage and transportation, are ongoing considerations.
Emerging Opportunities in Europe Power to Gas Market
Emerging opportunities within the Europe Power to Gas market are vast and are rapidly expanding beyond initial pilot projects. The development of the Power-to-Hydrogen segment, particularly for heavy-duty transport and industrial applications, presents a substantial growth avenue. The increasing focus on creating a circular economy is unlocking opportunities for P2G to utilize captured CO2 emissions, turning a waste product into a valuable resource for synthetic methane production. Untapped markets in sectors like aviation and shipping, which are difficult to electrify, offer significant potential for synthetic fuel derived from P2G. Furthermore, the integration of P2G with offshore wind farms presents a compelling opportunity to produce green hydrogen directly at the source, minimizing transmission losses and creating new value chains. Evolving consumer preferences for sustainable products and services are also driving demand for P2G-enabled decarbonized goods.
Growth Accelerators in the Europe Power to Gas Market Industry
Several key growth accelerators are shaping the long-term trajectory of the Europe Power to Gas market. Technological breakthroughs in electrolyzer efficiency and durability, coupled with innovations in methanation processes, are continuously driving down costs and improving performance, making P2G more economically viable. Strategic partnerships between technology providers, energy companies, industrial users, and governments are crucial for accelerating project development, fostering innovation, and de-risking investments. Market expansion strategies, including the establishment of dedicated hydrogen valleys and industrial clusters, are creating ecosystems that facilitate the scaling of P2G infrastructure and applications. Government initiatives, such as national hydrogen strategies and ambitious renewable energy targets, provide a strong policy push, while significant public and private funding is being channeled into research, development, and deployment of P2G technologies.
Key Players Shaping the Europe Power to Gas Market Market
- Siemens Energy AG
- GRT Gaz SA
- AquahydreX Inc
- Ineratec GmbH
- Electrochaea GmbH
- Sempra Energy
- Nel ASA
Notable Milestones in Europe Power to Gas Market Sector
- March 2022: Environmental Resources Management's (ERM) ERM Dolphyn and Source Energie entered into a partnership to develop a 200 MW floating wind to hydrogen project in the United Kingdom, expected to be commissioned by 2027 and produce green hydrogen.
- March 2022: Sunfire won the contract to supply electrolysis equipment for Finland's first industrial-scale green hydrogen plant constructed by P2X Solutions. The construction of the plant in Harjavalta, southwest Finland, expected to begin by mid-2022, involved a EUR 70 million investment for a 20 MW hydrogen and synthetic methane production plant.
In-Depth Europe Power to Gas Market Market Outlook
The Europe Power to Gas market is set for sustained and significant expansion, driven by the fundamental need to decarbonize the European energy landscape and achieve ambitious climate objectives. Growth accelerators such as continuous technological advancements in electrolyzer and methanation technologies, coupled with increasingly favorable policy support from national governments and the European Union, are creating a robust environment for investment and deployment. Strategic partnerships among key industry stakeholders, from technology developers to end-users, are vital for overcoming existing challenges and unlocking new market opportunities. The burgeoning demand for green hydrogen in industrial processes and transportation, along with the potential for synthetic methane to integrate into existing gas infrastructure, positions P2G as a cornerstone of Europe's future energy system. The outlook is highly positive, with considerable potential for market growth and innovation in the coming years.
Europe Power to Gas Market Segmentation
-
1. Technology
- 1.1. Power-to
- 1.2. Power-to-Methane (incl. Chemical and Biological)
-
2. Capacity
- 2.1. More than 1000 KW
- 2.2. 100 to 1000 KW
- 2.3. Less than 100 KW
-
3. End-User
- 3.1. Utilities
- 3.2. Industrial
- 3.3. Commercial
-
4. Location
- 4.1. United Kingdom
- 4.2. Germany
- 4.3. France
- 4.4. Spain
- 4.5. Others
Europe Power to Gas Market Segmentation By Geography
-
1. Europe
- 1.1. United Kingdom
- 1.2. Germany
- 1.3. France
- 1.4. Italy
- 1.5. Spain
- 1.6. Netherlands
- 1.7. Belgium
- 1.8. Sweden
- 1.9. Norway
- 1.10. Poland
- 1.11. Denmark
Europe Power to Gas Market Regional Market Share
Geographic Coverage of Europe Power to Gas Market
Europe Power to Gas Market REPORT HIGHLIGHTS
| Aspects | Details |
|---|---|
| Study Period | 2020-2034 |
| Base Year | 2025 |
| Estimated Year | 2026 |
| Forecast Period | 2026-2034 |
| Historical Period | 2020-2025 |
| Growth Rate | CAGR of 11.35% from 2020-2034 |
| Segmentation |
|
Table of Contents
- 1. Introduction
- 1.1. Research Scope
- 1.2. Market Segmentation
- 1.3. Research Objective
- 1.4. Definitions and Assumptions
- 2. Executive Summary
- 2.1. Market Snapshot
- 3. Market Dynamics
- 3.1. Market Drivers
- 3.2. Market Restrains
- 3.3. Market Trends
- 3.4. Market Opportunities
- 4. Market Factor Analysis
- 4.1. Porters Five Forces
- 4.1.1. Bargaining Power of Suppliers
- 4.1.2. Bargaining Power of Buyers
- 4.1.3. Threat of New Entrants
- 4.1.4. Threat of Substitutes
- 4.1.5. Competitive Rivalry
- 4.2. PESTEL analysis
- 4.3. BCG Analysis
- 4.3.1. Stars (High Growth, High Market Share)
- 4.3.2. Cash Cows (Low Growth, High Market Share)
- 4.3.3. Question Mark (High Growth, Low Market Share)
- 4.3.4. Dogs (Low Growth, Low Market Share)
- 4.4. Ansoff Matrix Analysis
- 4.5. Supply Chain Analysis
- 4.6. Regulatory Landscape
- 4.7. Current Market Potential and Opportunity Assessment (TAM–SAM–SOM Framework)
- 4.8. NRP Analyst Note
- 4.1. Porters Five Forces
- 5. Market Analysis, Insights and Forecast 2021-2033
- 5.1. Market Analysis, Insights and Forecast - by Technology
- 5.1.1. Power-to
- 5.1.2. Power-to-Methane (incl. Chemical and Biological)
- 5.2. Market Analysis, Insights and Forecast - by Capacity
- 5.2.1. More than 1000 KW
- 5.2.2. 100 to 1000 KW
- 5.2.3. Less than 100 KW
- 5.3. Market Analysis, Insights and Forecast - by End-User
- 5.3.1. Utilities
- 5.3.2. Industrial
- 5.3.3. Commercial
- 5.4. Market Analysis, Insights and Forecast - by Location
- 5.4.1. United Kingdom
- 5.4.2. Germany
- 5.4.3. France
- 5.4.4. Spain
- 5.4.5. Others
- 5.5. Market Analysis, Insights and Forecast - by Region
- 5.5.1. Europe
- 5.1. Market Analysis, Insights and Forecast - by Technology
- 6. Europe Power to Gas Market Analysis, Insights and Forecast, 2021-2033
- 6.1. Market Analysis, Insights and Forecast - by Technology
- 6.1.1. Power-to
- 6.1.2. Power-to-Methane (incl. Chemical and Biological)
- 6.2. Market Analysis, Insights and Forecast - by Capacity
- 6.2.1. More than 1000 KW
- 6.2.2. 100 to 1000 KW
- 6.2.3. Less than 100 KW
- 6.3. Market Analysis, Insights and Forecast - by End-User
- 6.3.1. Utilities
- 6.3.2. Industrial
- 6.3.3. Commercial
- 6.4. Market Analysis, Insights and Forecast - by Location
- 6.4.1. United Kingdom
- 6.4.2. Germany
- 6.4.3. France
- 6.4.4. Spain
- 6.4.5. Others
- 6.1. Market Analysis, Insights and Forecast - by Technology
- 7. Competitive Analysis
- 7.1. Company Profiles
- 7.1.1 Siemens Energy AG
- 7.1.1.1. Company Overview
- 7.1.1.2. Products
- 7.1.1.3. Company Financials
- 7.1.1.4. SWOT Analysis
- 7.1.2 GRT Gaz SA
- 7.1.2.1. Company Overview
- 7.1.2.2. Products
- 7.1.2.3. Company Financials
- 7.1.2.4. SWOT Analysis
- 7.1.3 AquahydreX Inc
- 7.1.3.1. Company Overview
- 7.1.3.2. Products
- 7.1.3.3. Company Financials
- 7.1.3.4. SWOT Analysis
- 7.1.4 Ineratec GmbH
- 7.1.4.1. Company Overview
- 7.1.4.2. Products
- 7.1.4.3. Company Financials
- 7.1.4.4. SWOT Analysis
- 7.1.5 Electrochaea GmbH
- 7.1.5.1. Company Overview
- 7.1.5.2. Products
- 7.1.5.3. Company Financials
- 7.1.5.4. SWOT Analysis
- 7.1.6 Sempra Energy
- 7.1.6.1. Company Overview
- 7.1.6.2. Products
- 7.1.6.3. Company Financials
- 7.1.6.4. SWOT Analysis
- 7.1.7 Nel ASA
- 7.1.7.1. Company Overview
- 7.1.7.2. Products
- 7.1.7.3. Company Financials
- 7.1.7.4. SWOT Analysis
- 7.1.1 Siemens Energy AG
- 7.2. Market Entropy
- 7.2.1 Company's Key Areas Served
- 7.2.2 Recent Developments
- 7.3. Company Market Share Analysis 2025
- 7.3.1 Top 5 Companies Market Share Analysis
- 7.3.2 Top 3 Companies Market Share Analysis
- 7.4. List of Potential Customers
- 8. Research Methodology
List of Figures
- Figure 1: Europe Power to Gas Market Revenue Breakdown (billion, %) by Product 2025 & 2033
- Figure 2: Europe Power to Gas Market Share (%) by Company 2025
List of Tables
- Table 1: Europe Power to Gas Market Revenue billion Forecast, by Technology 2020 & 2033
- Table 2: Europe Power to Gas Market Volume Gigawatt Forecast, by Technology 2020 & 2033
- Table 3: Europe Power to Gas Market Revenue billion Forecast, by Capacity 2020 & 2033
- Table 4: Europe Power to Gas Market Volume Gigawatt Forecast, by Capacity 2020 & 2033
- Table 5: Europe Power to Gas Market Revenue billion Forecast, by End-User 2020 & 2033
- Table 6: Europe Power to Gas Market Volume Gigawatt Forecast, by End-User 2020 & 2033
- Table 7: Europe Power to Gas Market Revenue billion Forecast, by Location 2020 & 2033
- Table 8: Europe Power to Gas Market Volume Gigawatt Forecast, by Location 2020 & 2033
- Table 9: Europe Power to Gas Market Revenue billion Forecast, by Region 2020 & 2033
- Table 10: Europe Power to Gas Market Volume Gigawatt Forecast, by Region 2020 & 2033
- Table 11: Europe Power to Gas Market Revenue billion Forecast, by Technology 2020 & 2033
- Table 12: Europe Power to Gas Market Volume Gigawatt Forecast, by Technology 2020 & 2033
- Table 13: Europe Power to Gas Market Revenue billion Forecast, by Capacity 2020 & 2033
- Table 14: Europe Power to Gas Market Volume Gigawatt Forecast, by Capacity 2020 & 2033
- Table 15: Europe Power to Gas Market Revenue billion Forecast, by End-User 2020 & 2033
- Table 16: Europe Power to Gas Market Volume Gigawatt Forecast, by End-User 2020 & 2033
- Table 17: Europe Power to Gas Market Revenue billion Forecast, by Location 2020 & 2033
- Table 18: Europe Power to Gas Market Volume Gigawatt Forecast, by Location 2020 & 2033
- Table 19: Europe Power to Gas Market Revenue billion Forecast, by Country 2020 & 2033
- Table 20: Europe Power to Gas Market Volume Gigawatt Forecast, by Country 2020 & 2033
- Table 21: United Kingdom Europe Power to Gas Market Revenue (billion) Forecast, by Application 2020 & 2033
- Table 22: United Kingdom Europe Power to Gas Market Volume (Gigawatt) Forecast, by Application 2020 & 2033
- Table 23: Germany Europe Power to Gas Market Revenue (billion) Forecast, by Application 2020 & 2033
- Table 24: Germany Europe Power to Gas Market Volume (Gigawatt) Forecast, by Application 2020 & 2033
- Table 25: France Europe Power to Gas Market Revenue (billion) Forecast, by Application 2020 & 2033
- Table 26: France Europe Power to Gas Market Volume (Gigawatt) Forecast, by Application 2020 & 2033
- Table 27: Italy Europe Power to Gas Market Revenue (billion) Forecast, by Application 2020 & 2033
- Table 28: Italy Europe Power to Gas Market Volume (Gigawatt) Forecast, by Application 2020 & 2033
- Table 29: Spain Europe Power to Gas Market Revenue (billion) Forecast, by Application 2020 & 2033
- Table 30: Spain Europe Power to Gas Market Volume (Gigawatt) Forecast, by Application 2020 & 2033
- Table 31: Netherlands Europe Power to Gas Market Revenue (billion) Forecast, by Application 2020 & 2033
- Table 32: Netherlands Europe Power to Gas Market Volume (Gigawatt) Forecast, by Application 2020 & 2033
- Table 33: Belgium Europe Power to Gas Market Revenue (billion) Forecast, by Application 2020 & 2033
- Table 34: Belgium Europe Power to Gas Market Volume (Gigawatt) Forecast, by Application 2020 & 2033
- Table 35: Sweden Europe Power to Gas Market Revenue (billion) Forecast, by Application 2020 & 2033
- Table 36: Sweden Europe Power to Gas Market Volume (Gigawatt) Forecast, by Application 2020 & 2033
- Table 37: Norway Europe Power to Gas Market Revenue (billion) Forecast, by Application 2020 & 2033
- Table 38: Norway Europe Power to Gas Market Volume (Gigawatt) Forecast, by Application 2020 & 2033
- Table 39: Poland Europe Power to Gas Market Revenue (billion) Forecast, by Application 2020 & 2033
- Table 40: Poland Europe Power to Gas Market Volume (Gigawatt) Forecast, by Application 2020 & 2033
- Table 41: Denmark Europe Power to Gas Market Revenue (billion) Forecast, by Application 2020 & 2033
- Table 42: Denmark Europe Power to Gas Market Volume (Gigawatt) Forecast, by Application 2020 & 2033
Frequently Asked Questions
1. What is the projected Compound Annual Growth Rate (CAGR) of the Europe Power to Gas Market?
The projected CAGR is approximately 11.35%.
2. Which companies are prominent players in the Europe Power to Gas Market?
Key companies in the market include Siemens Energy AG, GRT Gaz SA, AquahydreX Inc, Ineratec GmbH, Electrochaea GmbH, Sempra Energy, Nel ASA.
3. What are the main segments of the Europe Power to Gas Market?
The market segments include Technology, Capacity, End-User, Location.
4. Can you provide details about the market size?
The market size is estimated to be USD 46.76 billion as of 2022.
5. What are some drivers contributing to market growth?
4.; Growing Demand to Develop the Natural Gas Infrastructure4.; Increase in Offshore Oil and Gas Exploration and Production (E&P) Activities.
6. What are the notable trends driving market growth?
Germany is going to dominate the market.
7. Are there any restraints impacting market growth?
4.; High Volatility of Oil and Gas Prices.
8. Can you provide examples of recent developments in the market?
In March 2022. Environmental Resources Management's (ERM) ERM Dolphyn and Source Energie have entered into a partnership to develop a 200 floating wind to hydrogen project in the United Kingdom. The project is expected to be commissioned by 2027 and is likely to produce green hydrogen.
9. What pricing options are available for accessing the report?
Pricing options include single-user, multi-user, and enterprise licenses priced at USD 4750, USD 5250, and USD 8750 respectively.
10. Is the market size provided in terms of value or volume?
The market size is provided in terms of value, measured in billion and volume, measured in Gigawatt.
11. Are there any specific market keywords associated with the report?
Yes, the market keyword associated with the report is "Europe Power to Gas Market," which aids in identifying and referencing the specific market segment covered.
12. How do I determine which pricing option suits my needs best?
The pricing options vary based on user requirements and access needs. Individual users may opt for single-user licenses, while businesses requiring broader access may choose multi-user or enterprise licenses for cost-effective access to the report.
13. Are there any additional resources or data provided in the Europe Power to Gas Market report?
While the report offers comprehensive insights, it's advisable to review the specific contents or supplementary materials provided to ascertain if additional resources or data are available.
14. How can I stay updated on further developments or reports in the Europe Power to Gas Market?
To stay informed about further developments, trends, and reports in the Europe Power to Gas Market, consider subscribing to industry newsletters, following relevant companies and organizations, or regularly checking reputable industry news sources and publications.
Methodology
Step 1 - Identification of Relevant Samples Size from Population Database


Step 2 - Approaches for Defining Global Market Size (Value, Volume* & Price*)

Note*: In applicable scenarios
Step 3 - Data Sources
Primary Research
- Web Analytics
- Survey Reports
- Research Institute
- Latest Research Reports
- Opinion Leaders
Secondary Research
- Annual Reports
- White Paper
- Latest Press Release
- Industry Association
- Paid Database
- Investor Presentations

Step 4 - Data Triangulation
Involves using different sources of information in order to increase the validity of a study
These sources are likely to be stakeholders in a program - participants, other researchers, program staff, other community members, and so on.
Then we put all data in single framework & apply various statistical tools to find out the dynamic on the market.
During the analysis stage, feedback from the stakeholder groups would be compared to determine areas of agreement as well as areas of divergence