

Key Insights
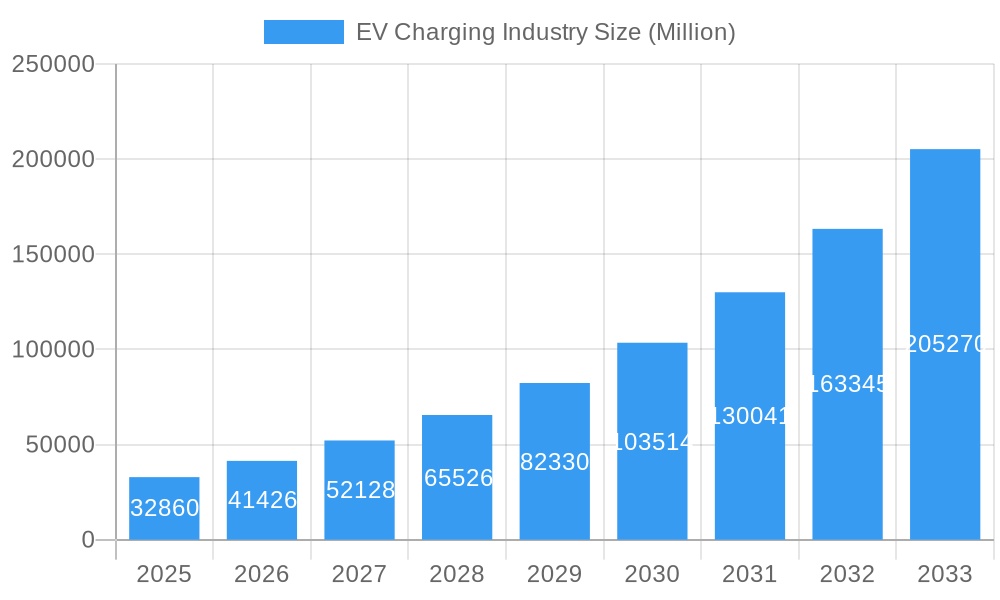
The global EV charging infrastructure market is experiencing explosive growth, driven by the accelerating adoption of electric vehicles (EVs) worldwide. With a market size of $32.86 billion in 2025 and a Compound Annual Growth Rate (CAGR) of 25.94%, the industry is projected to reach significant scale by 2033. Key growth drivers include government incentives promoting EV adoption, expanding EV model availability across various vehicle segments (passenger cars and commercial vehicles), and rising environmental concerns pushing consumers towards sustainable transportation options. The market is segmented by charger type (AC and DC), ownership (public and private), service (charging and battery swapping), infrastructure type (CHAdeMO, CCS, GB/T, Tesla Superchargers, and others), and vehicle type. The rapid expansion of charging networks, particularly in densely populated urban areas and along major transportation routes, is crucial for addressing range anxiety and encouraging wider EV uptake. Technological advancements in fast-charging technology are also contributing to market expansion, reducing charging times and increasing the convenience of EV ownership.
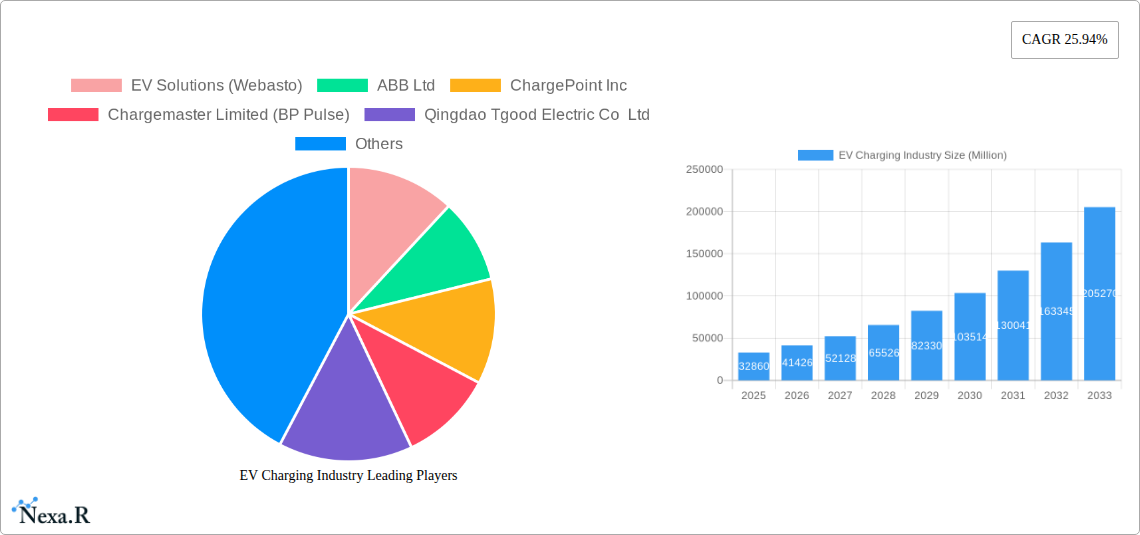
EV Charging Industry Market Size (In Billion)
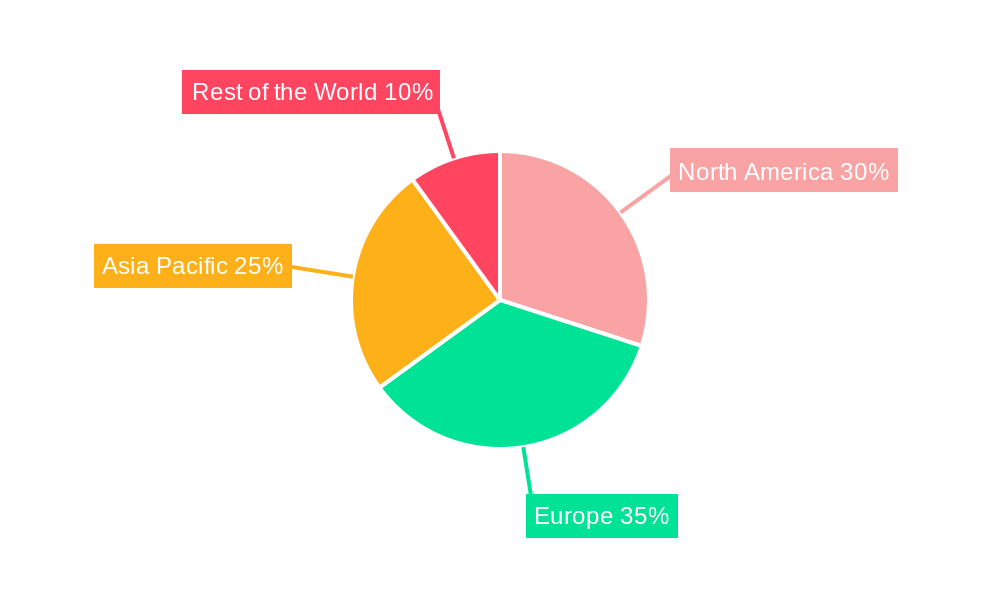
Competition within the EV charging industry is intense, with major players including established energy companies, automotive manufacturers, and specialized charging infrastructure providers. These companies are strategically investing in expanding their charging networks, developing innovative charging technologies, and forming partnerships to capture market share. Geographic growth is uneven, with North America, Europe, and Asia Pacific leading the charge, driven by strong government support, well-developed infrastructure in certain regions, and high EV adoption rates in key markets like the United States, China, and Germany. However, significant growth opportunities exist in emerging markets as EV adoption expands globally. Challenges remain, including the high initial investment costs associated with deploying charging infrastructure, the need for robust grid infrastructure to support increased electricity demand, and the standardization of charging technologies across different regions. Nevertheless, the long-term outlook for the EV charging market remains exceptionally positive, fueled by continuous technological innovation and the global transition towards sustainable transportation.
EV Charging Industry Company Market Share
EV Charging Industry Market Report: 2019-2033
This comprehensive report provides a detailed analysis of the global EV charging industry, encompassing market dynamics, growth trends, regional dominance, product landscape, and future outlook. The study period covers 2019-2033, with a base year of 2025 and a forecast period of 2025-2033. The report segments the market by charger type (AC and DC), charging ownership (public and private), charging service (EV charging and battery swapping), charging infrastructure (CHAdeMO, CCS, GB/T Fast Charge, Tesla Superchargers, and others), and vehicle type (passenger cars and commercial vehicles). Key players analyzed include EV Solutions (Webasto), ABB Ltd, ChargePoint Inc, Chargemaster Limited (BP Pulse), Qingdao Tgood Electric Co Ltd, Leviton Manufacturing Co Inc, BYD Company, Siemens AG, Schneider Electric SE, EFACEC Power Solutions SGPS, Evbox (ENGIE), Wanbang Digital Energy Pte Ltd (Star Charge), Tesla Motors Inc, SemaConnect Inc, and The Newmotion BV (Acquired by Shell). The report is invaluable for investors, industry professionals, and anyone seeking to understand this rapidly evolving market.
EV Charging Industry Market Dynamics & Structure
The EV charging industry is characterized by a dynamic interplay of technological advancements, regulatory landscapes, and competitive pressures. Market concentration is moderate, with several large players vying for market share alongside numerous smaller, regional providers. Technological innovation is a key driver, with continuous improvements in charging speed, efficiency, and infrastructure integration. Government regulations, including subsidies and mandates, play a crucial role in market growth, especially in regions actively promoting EV adoption. The industry also faces competition from alternative energy solutions and internal combustion engine vehicles. The end-user demographics are evolving, with a shift towards broader adoption across various segments including residential, commercial, and public spaces. Mergers and acquisitions (M&A) activity is relatively high, reflecting consolidation within the industry.
- Market Concentration: Moderately concentrated, with top 10 players holding xx% of the market share in 2024.
- Technological Innovation: Focus on high-power charging, smart charging technologies, and grid integration solutions.
- Regulatory Frameworks: Government incentives and mandates significantly influence market growth.
- Competitive Product Substitutes: Internal combustion engine vehicles and other alternative transportation options.
- End-User Demographics: Increasing adoption by both private and commercial users, expansion into public charging infrastructure.
- M&A Trends: Significant M&A activity, indicating industry consolidation and increased capital investment. Approximately xx M&A deals were recorded during 2019-2024.
EV Charging Industry Growth Trends & Insights
The global EV charging market is experiencing exponential growth, driven by increasing EV adoption, expanding charging infrastructure, and supportive government policies. The market size is projected to reach xx million units by 2033, exhibiting a Compound Annual Growth Rate (CAGR) of xx% during the forecast period (2025-2033). Technological advancements such as the introduction of high-power charging stations and battery swapping technologies are accelerating market growth. Consumer behavior is shifting towards preference for faster charging times, wider network availability and reliable charging solutions. Market penetration rates are expected to significantly increase as EV ownership expands globally. Adoption of smart charging technologies and integrated energy management solutions is also expected to drive market growth further.
Dominant Regions, Countries, or Segments in EV Charging Industry
The EV charging market is geographically diverse, with significant regional variations in growth rates and market share. China, Europe, and North America currently dominate the market, driven by high EV adoption rates, supportive government policies, and substantial investments in charging infrastructure.
- By Charger Type: DC charging stations are witnessing faster growth compared to AC charging stations due to faster charging times. In 2024, the DC market held xx million units, while AC held xx million units.
- By Charging Ownership Type: Public charging infrastructure is expanding rapidly, driven by government investments and increasing demand. Public charging captured xx million units of the market in 2024, while private held xx million units.
- By Charging Service Type: EV charging services are the dominant segment, although battery swapping services are gaining traction in specific regions. EV charging services constituted xx million units in 2024.
- By Charging Infrastructure Type: CCS and GB/T are leading in fast-charging infrastructure, whereas Tesla Superchargers maintain a strong position in the passenger car segment. In 2024, CCS accounted for xx million units and GB/T xx million units.
- By Vehicle Type: Passenger cars currently constitute the largest segment, while the commercial vehicle segment demonstrates strong growth potential. Passenger cars dominated at xx million units in 2024.
Key drivers include supportive government policies, expanding EV adoption, and improving charging infrastructure. Regions with robust EV policies and significant investments in public charging networks are experiencing the fastest growth.
EV Charging Industry Product Landscape
The EV charging industry features a wide range of products, including AC and DC charging stations, smart charging solutions, battery swapping stations, and related software and services. Product innovations focus on increasing charging speed, enhancing reliability, improving user experience, and integrating with smart grids. Key features include various power levels, different connector types (e.g., CCS, CHAdeMO, GB/T), smart charging functionalities, and remote monitoring capabilities. The unique selling propositions often revolve around charging speed, network accessibility, ease of use, and integration with other energy solutions. Technological advancements such as high-power charging and intelligent load management are defining market trends.
Key Drivers, Barriers & Challenges in EV Charging Industry
Key Drivers: Growing EV adoption, supportive government policies (subsidies, tax credits), expanding charging infrastructure, technological advancements in charging technology (higher power output, faster charging), and increasing consumer demand for convenient charging options. For example, the introduction of the 7Charge network by 7-Eleven shows a significant push towards wider accessibility.
Key Challenges: High initial investment costs for infrastructure development, interoperability issues between different charging standards, grid capacity limitations, uneven geographical distribution of charging stations, and the complexity of managing charging networks. Supply chain disruptions can lead to delays in deployment and increased costs. Regulatory hurdles and inconsistent standards across different regions present challenges to seamless market expansion. The intense competition among different stakeholders can reduce profitability for some industry players.
Emerging Opportunities in EV Charging Industry
Untapped markets in developing economies, integration of renewable energy sources into charging infrastructure, development of battery swapping technologies, creation of integrated energy management platforms, and the expansion into commercial vehicle charging are key emerging opportunities. The growing demand for bidirectional charging, allowing EVs to feed energy back into the grid, presents a significant growth avenue. Moreover, personalized charging plans tailored to individual driver needs represent a key opportunity for market expansion.
Growth Accelerators in the EV Charging Industry
Technological breakthroughs in battery technology, increasing adoption of V2G (Vehicle-to-Grid) technology, strategic partnerships between EV manufacturers and charging infrastructure providers, and expansion into new geographical markets are catalysts for long-term growth. Investments in smart charging solutions, optimized energy management, and integration with renewable energy sources are driving market expansion. Furthermore, streamlining the charging experience through seamless payment integrations and user-friendly applications contribute to accelerated growth.
Key Players Shaping the EV Charging Industry Market
- EV Solutions (Webasto)
- ABB Ltd
- ChargePoint Inc
- Chargemaster Limited (BP Pulse)
- Qingdao Tgood Electric Co Ltd
- Leviton Manufacturing Co Inc
- BYD Company
- Siemens AG
- Schneider Electric SE
- EFACEC Power Solutions SGPS
- Evbox (ENGIE)
- Wanbang Digital Energy Pte Ltd (Star Charge)
- Tesla Motors Inc
- SemaConnect Inc
- The Newmotion BV (Acquired by Shell)
Notable Milestones in EV Charging Industry Sector
- June 2023: Stellantis launched Free2move Charge, a comprehensive charging ecosystem.
- June 2023: Circontrol introduced the Genion One, enabling 100% green energy charging.
- June 2023: EVBox unveiled the EVBox Troniq High Power, a 400 kW charging station.
- March 2023: 7-Eleven launched 7Charge, its EV charging network and app.
In-Depth EV Charging Industry Market Outlook
The future of the EV charging industry is bright, with substantial growth potential driven by continued EV adoption, technological advancements, and supportive government policies. Strategic partnerships, expansion into new geographic markets, and the development of innovative charging solutions will play a critical role in shaping the market landscape. The focus on smart charging, grid integration, and renewable energy integration will further enhance the sustainability and efficiency of the industry, driving long-term growth and unlocking substantial market opportunities.
EV Charging Industry Segmentation
-
1. Vehicle Type
- 1.1. Passenger Cars
- 1.2. Commercial Vehicles
-
2. Charger Type
- 2.1. AC Charging Station
- 2.2. DC Charging Station
-
3. Charging Ownership Type
- 3.1. Public
- 3.2. Private
-
4. Charging Service Type
- 4.1. EV Charging Services
- 4.2. Battery Swapping Services
-
5. Charging Infrastructure Type
- 5.1. Chademo
- 5.2. CCS
- 5.3. GB/T Fast Charge
- 5.4. Tesla Superchargers
- 5.5. Other Charging Infrastructure Types
EV Charging Industry Segmentation By Geography
-
1. North America
- 1.1. United States
- 1.2. Canada
- 1.3. Rest of North America
-
2. Europe
- 2.1. Germany
- 2.2. United Kingdom
- 2.3. France
- 2.4. Italy
- 2.5. Rest of Europe
-
3. Asia Pacific
- 3.1. China
- 3.2. Japan
- 3.3. India
- 3.4. South Korea
- 3.5. Rest of Asia Pacific
-
4. Rest of the World
- 4.1. South America
- 4.2. Middle East and Africa
EV Charging Industry Regional Market Share
Geographic Coverage of EV Charging Industry
EV Charging Industry REPORT HIGHLIGHTS
| Aspects | Details |
|---|---|
| Study Period | 2020-2034 |
| Base Year | 2025 |
| Estimated Year | 2026 |
| Forecast Period | 2026-2034 |
| Historical Period | 2020-2025 |
| Growth Rate | CAGR of 25.94% from 2020-2034 |
| Segmentation |
|
Table of Contents
- 1. Introduction
- 1.1. Research Scope
- 1.2. Market Segmentation
- 1.3. Research Objective
- 1.4. Definitions and Assumptions
- 2. Executive Summary
- 2.1. Market Snapshot
- 3. Market Dynamics
- 3.1. Market Drivers
- 3.2. Market Restrains
- 3.3. Market Trends
- 3.4. Market Opportunities
- 4. Market Factor Analysis
- 4.1. Porters Five Forces
- 4.1.1. Bargaining Power of Suppliers
- 4.1.2. Bargaining Power of Buyers
- 4.1.3. Threat of New Entrants
- 4.1.4. Threat of Substitutes
- 4.1.5. Competitive Rivalry
- 4.2. PESTEL analysis
- 4.3. BCG Analysis
- 4.3.1. Stars (High Growth, High Market Share)
- 4.3.2. Cash Cows (Low Growth, High Market Share)
- 4.3.3. Question Mark (High Growth, Low Market Share)
- 4.3.4. Dogs (Low Growth, Low Market Share)
- 4.4. Ansoff Matrix Analysis
- 4.5. Supply Chain Analysis
- 4.6. Regulatory Landscape
- 4.7. Current Market Potential and Opportunity Assessment (TAM–SAM–SOM Framework)
- 4.8. NRP Analyst Note
- 4.1. Porters Five Forces
- 5. Market Analysis, Insights and Forecast 2021-2033
- 5.1. Market Analysis, Insights and Forecast - by Vehicle Type
- 5.1.1. Passenger Cars
- 5.1.2. Commercial Vehicles
- 5.2. Market Analysis, Insights and Forecast - by Charger Type
- 5.2.1. AC Charging Station
- 5.2.2. DC Charging Station
- 5.3. Market Analysis, Insights and Forecast - by Charging Ownership Type
- 5.3.1. Public
- 5.3.2. Private
- 5.4. Market Analysis, Insights and Forecast - by Charging Service Type
- 5.4.1. EV Charging Services
- 5.4.2. Battery Swapping Services
- 5.5. Market Analysis, Insights and Forecast - by Charging Infrastructure Type
- 5.5.1. Chademo
- 5.5.2. CCS
- 5.5.3. GB/T Fast Charge
- 5.5.4. Tesla Superchargers
- 5.5.5. Other Charging Infrastructure Types
- 5.6. Market Analysis, Insights and Forecast - by Region
- 5.6.1. North America
- 5.6.2. Europe
- 5.6.3. Asia Pacific
- 5.6.4. Rest of the World
- 5.1. Market Analysis, Insights and Forecast - by Vehicle Type
- 6. Global EV Charging Industry Analysis, Insights and Forecast, 2021-2033
- 6.1. Market Analysis, Insights and Forecast - by Vehicle Type
- 6.1.1. Passenger Cars
- 6.1.2. Commercial Vehicles
- 6.2. Market Analysis, Insights and Forecast - by Charger Type
- 6.2.1. AC Charging Station
- 6.2.2. DC Charging Station
- 6.3. Market Analysis, Insights and Forecast - by Charging Ownership Type
- 6.3.1. Public
- 6.3.2. Private
- 6.4. Market Analysis, Insights and Forecast - by Charging Service Type
- 6.4.1. EV Charging Services
- 6.4.2. Battery Swapping Services
- 6.5. Market Analysis, Insights and Forecast - by Charging Infrastructure Type
- 6.5.1. Chademo
- 6.5.2. CCS
- 6.5.3. GB/T Fast Charge
- 6.5.4. Tesla Superchargers
- 6.5.5. Other Charging Infrastructure Types
- 6.1. Market Analysis, Insights and Forecast - by Vehicle Type
- 7. North America EV Charging Industry Analysis, Insights and Forecast, 2020-2032
- 7.1. Market Analysis, Insights and Forecast - by Vehicle Type
- 7.1.1. Passenger Cars
- 7.1.2. Commercial Vehicles
- 7.2. Market Analysis, Insights and Forecast - by Charger Type
- 7.2.1. AC Charging Station
- 7.2.2. DC Charging Station
- 7.3. Market Analysis, Insights and Forecast - by Charging Ownership Type
- 7.3.1. Public
- 7.3.2. Private
- 7.4. Market Analysis, Insights and Forecast - by Charging Service Type
- 7.4.1. EV Charging Services
- 7.4.2. Battery Swapping Services
- 7.5. Market Analysis, Insights and Forecast - by Charging Infrastructure Type
- 7.5.1. Chademo
- 7.5.2. CCS
- 7.5.3. GB/T Fast Charge
- 7.5.4. Tesla Superchargers
- 7.5.5. Other Charging Infrastructure Types
- 7.1. Market Analysis, Insights and Forecast - by Vehicle Type
- 8. Europe EV Charging Industry Analysis, Insights and Forecast, 2020-2032
- 8.1. Market Analysis, Insights and Forecast - by Vehicle Type
- 8.1.1. Passenger Cars
- 8.1.2. Commercial Vehicles
- 8.2. Market Analysis, Insights and Forecast - by Charger Type
- 8.2.1. AC Charging Station
- 8.2.2. DC Charging Station
- 8.3. Market Analysis, Insights and Forecast - by Charging Ownership Type
- 8.3.1. Public
- 8.3.2. Private
- 8.4. Market Analysis, Insights and Forecast - by Charging Service Type
- 8.4.1. EV Charging Services
- 8.4.2. Battery Swapping Services
- 8.5. Market Analysis, Insights and Forecast - by Charging Infrastructure Type
- 8.5.1. Chademo
- 8.5.2. CCS
- 8.5.3. GB/T Fast Charge
- 8.5.4. Tesla Superchargers
- 8.5.5. Other Charging Infrastructure Types
- 8.1. Market Analysis, Insights and Forecast - by Vehicle Type
- 9. Asia Pacific EV Charging Industry Analysis, Insights and Forecast, 2020-2032
- 9.1. Market Analysis, Insights and Forecast - by Vehicle Type
- 9.1.1. Passenger Cars
- 9.1.2. Commercial Vehicles
- 9.2. Market Analysis, Insights and Forecast - by Charger Type
- 9.2.1. AC Charging Station
- 9.2.2. DC Charging Station
- 9.3. Market Analysis, Insights and Forecast - by Charging Ownership Type
- 9.3.1. Public
- 9.3.2. Private
- 9.4. Market Analysis, Insights and Forecast - by Charging Service Type
- 9.4.1. EV Charging Services
- 9.4.2. Battery Swapping Services
- 9.5. Market Analysis, Insights and Forecast - by Charging Infrastructure Type
- 9.5.1. Chademo
- 9.5.2. CCS
- 9.5.3. GB/T Fast Charge
- 9.5.4. Tesla Superchargers
- 9.5.5. Other Charging Infrastructure Types
- 9.1. Market Analysis, Insights and Forecast - by Vehicle Type
- 10. Rest of the World EV Charging Industry Analysis, Insights and Forecast, 2020-2032
- 10.1. Market Analysis, Insights and Forecast - by Vehicle Type
- 10.1.1. Passenger Cars
- 10.1.2. Commercial Vehicles
- 10.2. Market Analysis, Insights and Forecast - by Charger Type
- 10.2.1. AC Charging Station
- 10.2.2. DC Charging Station
- 10.3. Market Analysis, Insights and Forecast - by Charging Ownership Type
- 10.3.1. Public
- 10.3.2. Private
- 10.4. Market Analysis, Insights and Forecast - by Charging Service Type
- 10.4.1. EV Charging Services
- 10.4.2. Battery Swapping Services
- 10.5. Market Analysis, Insights and Forecast - by Charging Infrastructure Type
- 10.5.1. Chademo
- 10.5.2. CCS
- 10.5.3. GB/T Fast Charge
- 10.5.4. Tesla Superchargers
- 10.5.5. Other Charging Infrastructure Types
- 10.1. Market Analysis, Insights and Forecast - by Vehicle Type
- 11. Competitive Analysis
- 11.1. Company Profiles
- 11.1.1 EV Solutions (Webasto)
- 11.1.1.1. Company Overview
- 11.1.1.2. Products
- 11.1.1.3. Company Financials
- 11.1.1.4. SWOT Analysis
- 11.1.2 ABB Ltd
- 11.1.2.1. Company Overview
- 11.1.2.2. Products
- 11.1.2.3. Company Financials
- 11.1.2.4. SWOT Analysis
- 11.1.3 ChargePoint Inc
- 11.1.3.1. Company Overview
- 11.1.3.2. Products
- 11.1.3.3. Company Financials
- 11.1.3.4. SWOT Analysis
- 11.1.4 Chargemaster Limited (BP Pulse)
- 11.1.4.1. Company Overview
- 11.1.4.2. Products
- 11.1.4.3. Company Financials
- 11.1.4.4. SWOT Analysis
- 11.1.5 Qingdao Tgood Electric Co Ltd
- 11.1.5.1. Company Overview
- 11.1.5.2. Products
- 11.1.5.3. Company Financials
- 11.1.5.4. SWOT Analysis
- 11.1.6 Leviton Manufacturing Co Inc
- 11.1.6.1. Company Overview
- 11.1.6.2. Products
- 11.1.6.3. Company Financials
- 11.1.6.4. SWOT Analysis
- 11.1.7 BYD Company
- 11.1.7.1. Company Overview
- 11.1.7.2. Products
- 11.1.7.3. Company Financials
- 11.1.7.4. SWOT Analysis
- 11.1.8 Siemens AG
- 11.1.8.1. Company Overview
- 11.1.8.2. Products
- 11.1.8.3. Company Financials
- 11.1.8.4. SWOT Analysis
- 11.1.9 Schneider Electric SE
- 11.1.9.1. Company Overview
- 11.1.9.2. Products
- 11.1.9.3. Company Financials
- 11.1.9.4. SWOT Analysis
- 11.1.10 EFACEC Power Solutions SGPS
- 11.1.10.1. Company Overview
- 11.1.10.2. Products
- 11.1.10.3. Company Financials
- 11.1.10.4. SWOT Analysis
- 11.1.11 Evbox (ENGIE)
- 11.1.11.1. Company Overview
- 11.1.11.2. Products
- 11.1.11.3. Company Financials
- 11.1.11.4. SWOT Analysis
- 11.1.12 Wanbang Digital Energy Pte Ltd (Star Charge
- 11.1.12.1. Company Overview
- 11.1.12.2. Products
- 11.1.12.3. Company Financials
- 11.1.12.4. SWOT Analysis
- 11.1.13 Tesla Motors Inc
- 11.1.13.1. Company Overview
- 11.1.13.2. Products
- 11.1.13.3. Company Financials
- 11.1.13.4. SWOT Analysis
- 11.1.14 SemaConnect Inc
- 11.1.14.1. Company Overview
- 11.1.14.2. Products
- 11.1.14.3. Company Financials
- 11.1.14.4. SWOT Analysis
- 11.1.15 The Newmotion BV (Acquired by Shell)
- 11.1.15.1. Company Overview
- 11.1.15.2. Products
- 11.1.15.3. Company Financials
- 11.1.15.4. SWOT Analysis
- 11.1.1 EV Solutions (Webasto)
- 11.2. Market Entropy
- 11.2.1 Company's Key Areas Served
- 11.2.2 Recent Developments
- 11.3. Company Market Share Analysis 2025
- 11.3.1 Top 5 Companies Market Share Analysis
- 11.3.2 Top 3 Companies Market Share Analysis
- 11.4. List of Potential Customers
- 12. Research Methodology
List of Figures
- Figure 1: Global EV Charging Industry Revenue Breakdown (Million, %) by Region 2025 & 2033
- Figure 2: North America EV Charging Industry Revenue (Million), by Vehicle Type 2025 & 2033
- Figure 3: North America EV Charging Industry Revenue Share (%), by Vehicle Type 2025 & 2033
- Figure 4: North America EV Charging Industry Revenue (Million), by Charger Type 2025 & 2033
- Figure 5: North America EV Charging Industry Revenue Share (%), by Charger Type 2025 & 2033
- Figure 6: North America EV Charging Industry Revenue (Million), by Charging Ownership Type 2025 & 2033
- Figure 7: North America EV Charging Industry Revenue Share (%), by Charging Ownership Type 2025 & 2033
- Figure 8: North America EV Charging Industry Revenue (Million), by Charging Service Type 2025 & 2033
- Figure 9: North America EV Charging Industry Revenue Share (%), by Charging Service Type 2025 & 2033
- Figure 10: North America EV Charging Industry Revenue (Million), by Charging Infrastructure Type 2025 & 2033
- Figure 11: North America EV Charging Industry Revenue Share (%), by Charging Infrastructure Type 2025 & 2033
- Figure 12: North America EV Charging Industry Revenue (Million), by Country 2025 & 2033
- Figure 13: North America EV Charging Industry Revenue Share (%), by Country 2025 & 2033
- Figure 14: Europe EV Charging Industry Revenue (Million), by Vehicle Type 2025 & 2033
- Figure 15: Europe EV Charging Industry Revenue Share (%), by Vehicle Type 2025 & 2033
- Figure 16: Europe EV Charging Industry Revenue (Million), by Charger Type 2025 & 2033
- Figure 17: Europe EV Charging Industry Revenue Share (%), by Charger Type 2025 & 2033
- Figure 18: Europe EV Charging Industry Revenue (Million), by Charging Ownership Type 2025 & 2033
- Figure 19: Europe EV Charging Industry Revenue Share (%), by Charging Ownership Type 2025 & 2033
- Figure 20: Europe EV Charging Industry Revenue (Million), by Charging Service Type 2025 & 2033
- Figure 21: Europe EV Charging Industry Revenue Share (%), by Charging Service Type 2025 & 2033
- Figure 22: Europe EV Charging Industry Revenue (Million), by Charging Infrastructure Type 2025 & 2033
- Figure 23: Europe EV Charging Industry Revenue Share (%), by Charging Infrastructure Type 2025 & 2033
- Figure 24: Europe EV Charging Industry Revenue (Million), by Country 2025 & 2033
- Figure 25: Europe EV Charging Industry Revenue Share (%), by Country 2025 & 2033
- Figure 26: Asia Pacific EV Charging Industry Revenue (Million), by Vehicle Type 2025 & 2033
- Figure 27: Asia Pacific EV Charging Industry Revenue Share (%), by Vehicle Type 2025 & 2033
- Figure 28: Asia Pacific EV Charging Industry Revenue (Million), by Charger Type 2025 & 2033
- Figure 29: Asia Pacific EV Charging Industry Revenue Share (%), by Charger Type 2025 & 2033
- Figure 30: Asia Pacific EV Charging Industry Revenue (Million), by Charging Ownership Type 2025 & 2033
- Figure 31: Asia Pacific EV Charging Industry Revenue Share (%), by Charging Ownership Type 2025 & 2033
- Figure 32: Asia Pacific EV Charging Industry Revenue (Million), by Charging Service Type 2025 & 2033
- Figure 33: Asia Pacific EV Charging Industry Revenue Share (%), by Charging Service Type 2025 & 2033
- Figure 34: Asia Pacific EV Charging Industry Revenue (Million), by Charging Infrastructure Type 2025 & 2033
- Figure 35: Asia Pacific EV Charging Industry Revenue Share (%), by Charging Infrastructure Type 2025 & 2033
- Figure 36: Asia Pacific EV Charging Industry Revenue (Million), by Country 2025 & 2033
- Figure 37: Asia Pacific EV Charging Industry Revenue Share (%), by Country 2025 & 2033
- Figure 38: Rest of the World EV Charging Industry Revenue (Million), by Vehicle Type 2025 & 2033
- Figure 39: Rest of the World EV Charging Industry Revenue Share (%), by Vehicle Type 2025 & 2033
- Figure 40: Rest of the World EV Charging Industry Revenue (Million), by Charger Type 2025 & 2033
- Figure 41: Rest of the World EV Charging Industry Revenue Share (%), by Charger Type 2025 & 2033
- Figure 42: Rest of the World EV Charging Industry Revenue (Million), by Charging Ownership Type 2025 & 2033
- Figure 43: Rest of the World EV Charging Industry Revenue Share (%), by Charging Ownership Type 2025 & 2033
- Figure 44: Rest of the World EV Charging Industry Revenue (Million), by Charging Service Type 2025 & 2033
- Figure 45: Rest of the World EV Charging Industry Revenue Share (%), by Charging Service Type 2025 & 2033
- Figure 46: Rest of the World EV Charging Industry Revenue (Million), by Charging Infrastructure Type 2025 & 2033
- Figure 47: Rest of the World EV Charging Industry Revenue Share (%), by Charging Infrastructure Type 2025 & 2033
- Figure 48: Rest of the World EV Charging Industry Revenue (Million), by Country 2025 & 2033
- Figure 49: Rest of the World EV Charging Industry Revenue Share (%), by Country 2025 & 2033
List of Tables
- Table 1: Global EV Charging Industry Revenue Million Forecast, by Vehicle Type 2020 & 2033
- Table 2: Global EV Charging Industry Revenue Million Forecast, by Charger Type 2020 & 2033
- Table 3: Global EV Charging Industry Revenue Million Forecast, by Charging Ownership Type 2020 & 2033
- Table 4: Global EV Charging Industry Revenue Million Forecast, by Charging Service Type 2020 & 2033
- Table 5: Global EV Charging Industry Revenue Million Forecast, by Charging Infrastructure Type 2020 & 2033
- Table 6: Global EV Charging Industry Revenue Million Forecast, by Region 2020 & 2033
- Table 7: Global EV Charging Industry Revenue Million Forecast, by Vehicle Type 2020 & 2033
- Table 8: Global EV Charging Industry Revenue Million Forecast, by Charger Type 2020 & 2033
- Table 9: Global EV Charging Industry Revenue Million Forecast, by Charging Ownership Type 2020 & 2033
- Table 10: Global EV Charging Industry Revenue Million Forecast, by Charging Service Type 2020 & 2033
- Table 11: Global EV Charging Industry Revenue Million Forecast, by Charging Infrastructure Type 2020 & 2033
- Table 12: Global EV Charging Industry Revenue Million Forecast, by Country 2020 & 2033
- Table 13: United States EV Charging Industry Revenue (Million) Forecast, by Application 2020 & 2033
- Table 14: Canada EV Charging Industry Revenue (Million) Forecast, by Application 2020 & 2033
- Table 15: Rest of North America EV Charging Industry Revenue (Million) Forecast, by Application 2020 & 2033
- Table 16: Global EV Charging Industry Revenue Million Forecast, by Vehicle Type 2020 & 2033
- Table 17: Global EV Charging Industry Revenue Million Forecast, by Charger Type 2020 & 2033
- Table 18: Global EV Charging Industry Revenue Million Forecast, by Charging Ownership Type 2020 & 2033
- Table 19: Global EV Charging Industry Revenue Million Forecast, by Charging Service Type 2020 & 2033
- Table 20: Global EV Charging Industry Revenue Million Forecast, by Charging Infrastructure Type 2020 & 2033
- Table 21: Global EV Charging Industry Revenue Million Forecast, by Country 2020 & 2033
- Table 22: Germany EV Charging Industry Revenue (Million) Forecast, by Application 2020 & 2033
- Table 23: United Kingdom EV Charging Industry Revenue (Million) Forecast, by Application 2020 & 2033
- Table 24: France EV Charging Industry Revenue (Million) Forecast, by Application 2020 & 2033
- Table 25: Italy EV Charging Industry Revenue (Million) Forecast, by Application 2020 & 2033
- Table 26: Rest of Europe EV Charging Industry Revenue (Million) Forecast, by Application 2020 & 2033
- Table 27: Global EV Charging Industry Revenue Million Forecast, by Vehicle Type 2020 & 2033
- Table 28: Global EV Charging Industry Revenue Million Forecast, by Charger Type 2020 & 2033
- Table 29: Global EV Charging Industry Revenue Million Forecast, by Charging Ownership Type 2020 & 2033
- Table 30: Global EV Charging Industry Revenue Million Forecast, by Charging Service Type 2020 & 2033
- Table 31: Global EV Charging Industry Revenue Million Forecast, by Charging Infrastructure Type 2020 & 2033
- Table 32: Global EV Charging Industry Revenue Million Forecast, by Country 2020 & 2033
- Table 33: China EV Charging Industry Revenue (Million) Forecast, by Application 2020 & 2033
- Table 34: Japan EV Charging Industry Revenue (Million) Forecast, by Application 2020 & 2033
- Table 35: India EV Charging Industry Revenue (Million) Forecast, by Application 2020 & 2033
- Table 36: South Korea EV Charging Industry Revenue (Million) Forecast, by Application 2020 & 2033
- Table 37: Rest of Asia Pacific EV Charging Industry Revenue (Million) Forecast, by Application 2020 & 2033
- Table 38: Global EV Charging Industry Revenue Million Forecast, by Vehicle Type 2020 & 2033
- Table 39: Global EV Charging Industry Revenue Million Forecast, by Charger Type 2020 & 2033
- Table 40: Global EV Charging Industry Revenue Million Forecast, by Charging Ownership Type 2020 & 2033
- Table 41: Global EV Charging Industry Revenue Million Forecast, by Charging Service Type 2020 & 2033
- Table 42: Global EV Charging Industry Revenue Million Forecast, by Charging Infrastructure Type 2020 & 2033
- Table 43: Global EV Charging Industry Revenue Million Forecast, by Country 2020 & 2033
- Table 44: South America EV Charging Industry Revenue (Million) Forecast, by Application 2020 & 2033
- Table 45: Middle East and Africa EV Charging Industry Revenue (Million) Forecast, by Application 2020 & 2033
Frequently Asked Questions
1. What is the projected Compound Annual Growth Rate (CAGR) of the EV Charging Industry?
The projected CAGR is approximately 25.94%.
2. Which companies are prominent players in the EV Charging Industry?
Key companies in the market include EV Solutions (Webasto), ABB Ltd, ChargePoint Inc, Chargemaster Limited (BP Pulse), Qingdao Tgood Electric Co Ltd, Leviton Manufacturing Co Inc, BYD Company, Siemens AG, Schneider Electric SE, EFACEC Power Solutions SGPS, Evbox (ENGIE), Wanbang Digital Energy Pte Ltd (Star Charge, Tesla Motors Inc, SemaConnect Inc, The Newmotion BV (Acquired by Shell).
3. What are the main segments of the EV Charging Industry?
The market segments include Vehicle Type, Charger Type, Charging Ownership Type, Charging Service Type, Charging Infrastructure Type.
4. Can you provide details about the market size?
The market size is estimated to be USD 32.86 Million as of 2022.
5. What are some drivers contributing to market growth?
Rising EV Sales and Decreasing EV Prices are Driving the Market.
6. What are the notable trends driving market growth?
Passenger Cars are Leading the Electric Vehicle Charging Station Market.
7. Are there any restraints impacting market growth?
High Initial Cost of Installing and Maintaining a Standard EV Charging Station is a Challenge.
8. Can you provide examples of recent developments in the market?
June 2023: Stellantis introduced Free2move Charge, a comprehensive ecosystem that provides seamless charging and energy management solutions for electric vehicle (EV) customers. This holistic approach caters to EV needs across various scenarios, including home charging, business charging, and on-the-go charging. The initiative is overseen by the newly established Stellantis Charging & Energy Business Unit, emphasizing Stellantis’s commitment to supporting the growing EV market.
9. What pricing options are available for accessing the report?
Pricing options include single-user, multi-user, and enterprise licenses priced at USD 4750, USD 5250, and USD 8750 respectively.
10. Is the market size provided in terms of value or volume?
The market size is provided in terms of value, measured in Million.
11. Are there any specific market keywords associated with the report?
Yes, the market keyword associated with the report is "EV Charging Industry," which aids in identifying and referencing the specific market segment covered.
12. How do I determine which pricing option suits my needs best?
The pricing options vary based on user requirements and access needs. Individual users may opt for single-user licenses, while businesses requiring broader access may choose multi-user or enterprise licenses for cost-effective access to the report.
13. Are there any additional resources or data provided in the EV Charging Industry report?
While the report offers comprehensive insights, it's advisable to review the specific contents or supplementary materials provided to ascertain if additional resources or data are available.
14. How can I stay updated on further developments or reports in the EV Charging Industry?
To stay informed about further developments, trends, and reports in the EV Charging Industry, consider subscribing to industry newsletters, following relevant companies and organizations, or regularly checking reputable industry news sources and publications.
Methodology
Step 1 - Identification of Relevant Samples Size from Population Database


Step 2 - Approaches for Defining Global Market Size (Value, Volume* & Price*)

Note*: In applicable scenarios
Step 3 - Data Sources
Primary Research
- Web Analytics
- Survey Reports
- Research Institute
- Latest Research Reports
- Opinion Leaders
Secondary Research
- Annual Reports
- White Paper
- Latest Press Release
- Industry Association
- Paid Database
- Investor Presentations

Step 4 - Data Triangulation
Involves using different sources of information in order to increase the validity of a study
These sources are likely to be stakeholders in a program - participants, other researchers, program staff, other community members, and so on.
Then we put all data in single framework & apply various statistical tools to find out the dynamic on the market.
During the analysis stage, feedback from the stakeholder groups would be compared to determine areas of agreement as well as areas of divergence