

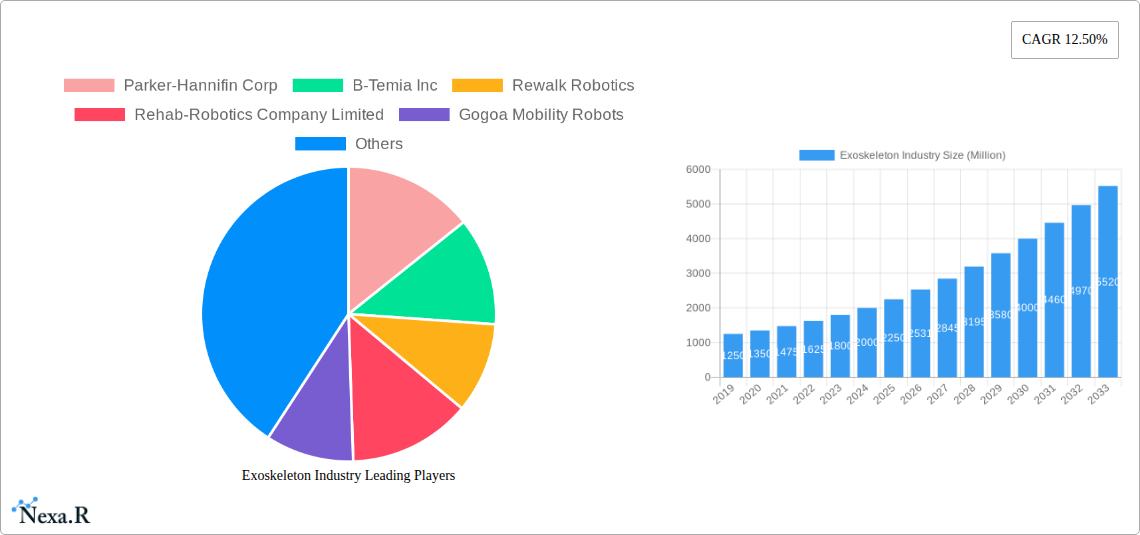
Key Insights
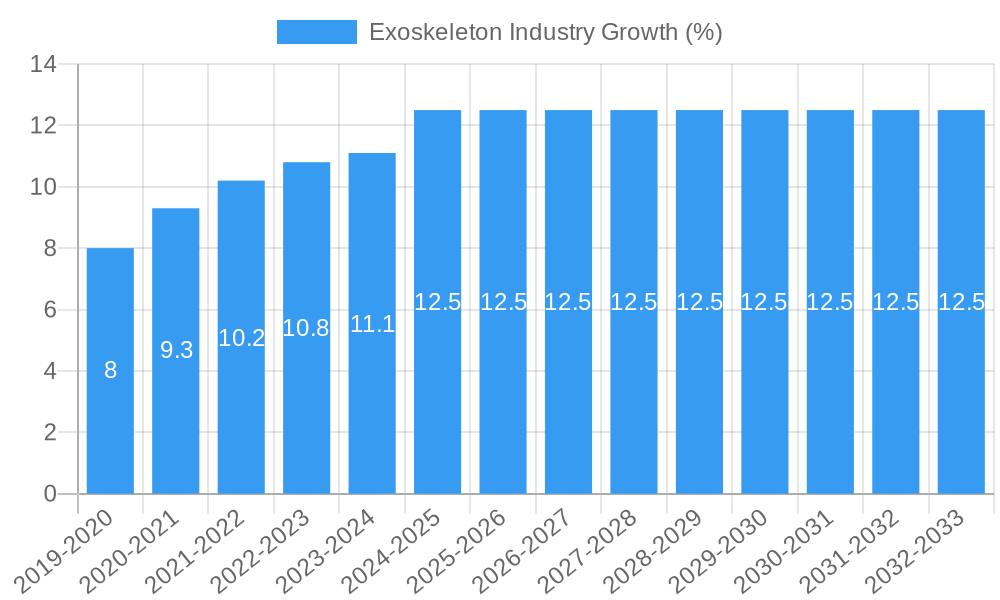
The global Exoskeleton Industry is poised for remarkable expansion, projected to reach a significant market size of approximately $2,500 million by 2025, with a robust Compound Annual Growth Rate (CAGR) of 12.50% anticipated through 2033. This impressive growth is primarily fueled by advancements in robotic technology, increasing adoption in rehabilitation and assistive care, and a growing demand for solutions to enhance human physical capabilities in industrial and military sectors. The drive towards improved patient outcomes in physical therapy and the rising prevalence of mobility-related disorders are key accelerators. Furthermore, the integration of artificial intelligence and sophisticated sensor technologies is enabling more intuitive and responsive exoskeleton designs, broadening their application scope. The rehabilitation segment is expected to lead this growth, driven by its critical role in restoring mobility and function for individuals with neurological and musculoskeletal conditions.
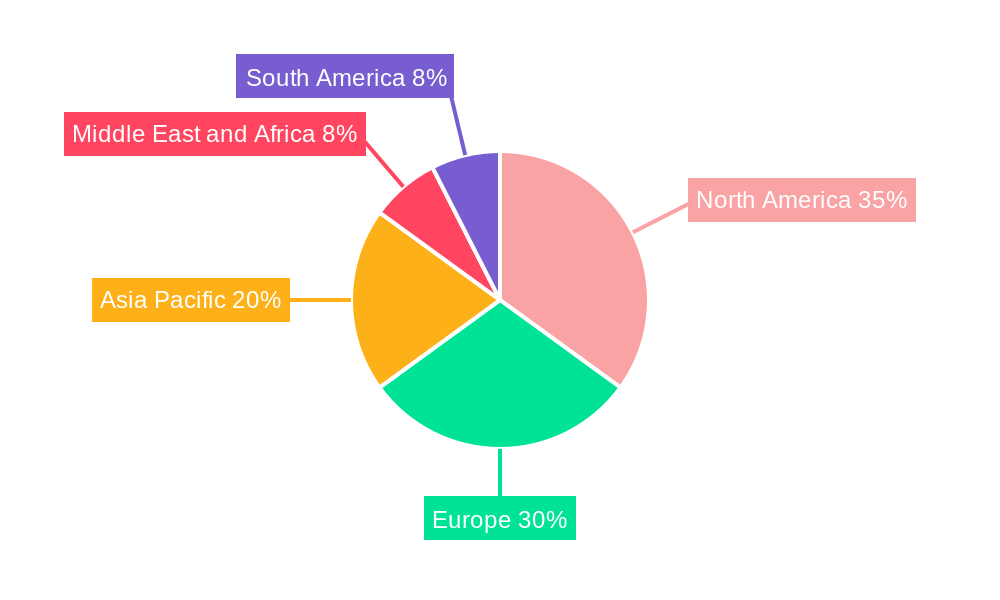
The market is characterized by several key trends, including the development of lighter, more ergonomic, and user-friendly exoskeleton designs. Mobile exoskeletons are gaining traction, offering greater freedom of movement for users in various environments, contrasting with the more established stationary models. Geographically, North America and Europe currently dominate the market due to advanced healthcare infrastructure, significant R&D investments, and a higher disposable income for advanced medical devices. However, the Asia Pacific region is anticipated to witness the fastest growth, propelled by increasing healthcare expenditure, a burgeoning elderly population, and a growing awareness of rehabilitation technologies. Restraints include high manufacturing costs, regulatory hurdles for medical device approval, and the need for extensive user training. Despite these challenges, the continuous innovation in materials science and robotics, coupled with strategic collaborations between technology providers and healthcare institutions, will undoubtedly propel the exoskeleton market to new heights.
Unlock the Future of Human Augmentation and Rehabilitation: Comprehensive Exoskeleton Industry Market Analysis 2019-2033
Dive deep into the revolutionary exoskeleton industry with this in-depth market report. Covering the period from 2019 to 2033, with a base and estimated year of 2025, this analysis provides critical insights into the rapidly evolving landscape of wearable robots. We examine the entire value chain, from medical exoskeletons for rehabilitation to industrial exoskeletons for augmentation, offering unparalleled visibility into market dynamics, growth trajectories, and key player strategies. Whether you're tracking exoskeleton market size, exploring robotic suits, or understanding the impact of advanced robotics, this report is your definitive guide.
Exoskeleton Industry Market Dynamics & Structure
The exoskeleton industry is characterized by a moderate market concentration, with a blend of established conglomerates and agile innovators. Technological innovation is a primary driver, fueled by advancements in AI, miniaturization of components, and battery technology. Regulatory frameworks are maturing, particularly for rehabilitation exoskeletons, as efficacy and safety standards are refined. Competitive product substitutes, though nascent, include advanced prosthetics and specialized ergonomic equipment. End-user demographics are diversifying, spanning individuals with mobility impairments, industrial workers, and military personnel. Mergers and acquisitions (M&A) are on the rise as larger players seek to acquire cutting-edge technologies and expand their market reach.
- Market Concentration: Moderate, with key players and emerging startups.
- Technological Innovation: Driven by AI, materials science, and battery tech.
- Regulatory Frameworks: Evolving, with a focus on safety and efficacy for medical applications.
- Competitive Landscape: Emerging substitutes include advanced prosthetics and ergonomic solutions.
- End-User Demographics: Expanding from medical to industrial and defense sectors.
- M&A Trends: Increasing, indicating consolidation and strategic expansion.
Exoskeleton Industry Growth Trends & Insights
The global exoskeleton market is poised for significant expansion, driven by increasing awareness of the benefits offered by these advanced robotic systems. The exoskeleton market size is projected to witness a robust Compound Annual Growth Rate (CAGR) of xx% during the forecast period of 2025–2033. This growth is underpinned by a surge in adoption rates across both rehabilitation and augmentation segments. Technological disruptions, including the development of lighter, more intuitive, and affordable wearable robotic suits, are accelerating this trend. Consumer behavior is shifting towards embracing assistive technologies that enhance quality of life and workplace productivity.
The rehabilitation exoskeleton segment, crucial for aiding individuals with spinal cord injuries, stroke, and other mobility disorders, is experiencing substantial growth. Innovations in this area focus on improving gait patterns, reducing user fatigue, and enabling greater independence. Simultaneously, the industrial exoskeleton market is booming as companies invest in solutions to mitigate workplace injuries and boost worker efficiency. These industrial augmentation exoskeletons provide crucial support for physically demanding tasks, leading to increased productivity and reduced operational costs.
Furthermore, the integration of advanced sensing technologies and artificial intelligence is making exoskeletons more responsive and adaptive to individual user needs. This personalization is a key factor driving market penetration. The exoskeleton industry is also benefiting from increased R&D investments and government initiatives promoting the adoption of advanced assistive technologies. The report forecasts the market to reach USD xx billion by 2033, up from an estimated USD xx billion in 2025.
Dominant Regions, Countries, or Segments in Exoskeleton Industry
The exoskeleton industry exhibits a dynamic regional and segmental dominance, with North America currently leading the market due to robust healthcare infrastructure, significant R&D investments, and a strong presence of key players. The United States, in particular, is a powerhouse, driven by a high incidence of neurological disorders requiring rehabilitation and a proactive industrial sector adopting augmentation technologies.
Within the Treatment Type segment, Rehabilitation is currently the dominant force. This is primarily due to the increasing prevalence of conditions like spinal cord injuries, stroke, and multiple sclerosis, coupled with a growing demand for advanced assistive devices to improve patient recovery and mobility. The Augmentation segment, encompassing industrial and military applications, is a rapidly growing child market, poised to challenge rehabilitation's dominance in the long term.
Analyzing Body Part Type, the Lower Body segment holds a significant market share, driven by the critical need for gait restoration and mobility assistance in rehabilitation. However, advancements in upper body exoskeletons for industrial tasks and support are leading to rapid growth in this sub-segment.
Regarding Product Type, Mobile exoskeletons are gaining traction over Stationary exoskeletons due to their versatility and ability to provide mobility assistance in various environments, both clinical and personal. The demand for untethered solutions is a key driver for mobile product adoption.
- Leading Region: North America (particularly the United States)
- Drivers: Advanced healthcare infrastructure, high R&D funding, presence of leading exoskeleton manufacturers.
- Market Share: Dominant position in both rehabilitation and industrial segments.
- Growth Potential: Continued innovation and adoption across various applications.
- Dominant Treatment Type: Rehabilitation
- Key Drivers: Rising incidence of neurological disorders, aging population, growing demand for mobility solutions.
- Market Share: Significant portion of the overall exoskeleton market.
- Growth Potential: Steady and substantial growth driven by medical needs.
- Growing Child Market (Treatment Type): Augmentation
- Key Drivers: Focus on worker safety in industrial sectors, military force enhancement, demand for increased physical capabilities.
- Market Share: Rapidly expanding and projected to gain market share.
- Growth Potential: High, driven by economic benefits and technological advancements.
- Dominant Body Part Type: Lower Body
- Key Drivers: Critical for gait restoration and mobility in rehabilitation, extensive research and development in lower limb prosthetics and orthotics.
- Market Share: Historically highest share due to rehabilitation focus.
- Growth Potential: Strong, with continuous improvements in functionality.
- Emerging Dominance (Body Part Type): Upper Body
- Key Drivers: Increased application in industrial settings for lifting and repetitive tasks, support for individuals with upper limb paralysis.
- Market Share: Growing rapidly, driven by industrial demand.
- Growth Potential: Very high, with new applications emerging.
- Dominant Product Type: Mobile Exoskeletons
- Key Drivers: Versatility, independence, ability to function in diverse environments.
- Market Share: Increasing preference over stationary models.
- Growth Potential: High, as technology enables greater portability and ease of use.
Exoskeleton Industry Product Landscape
The exoskeleton product landscape is characterized by continuous innovation in material science, biomechanics, and artificial intelligence. Products range from lightweight, powered braces for gait assistance to robust, full-body suits designed for heavy lifting in industrial environments. Key advancements include enhanced sensor integration for intuitive control, improved battery life for extended operation, and customizable designs to fit diverse user anatomies and needs. Performance metrics such as torque output, range of motion, and energy efficiency are constantly being refined. Unique selling propositions often revolve around user comfort, ease of donning and doffing, and the ability to seamlessly integrate with existing workflows or rehabilitation protocols.
Key Drivers, Barriers & Challenges in Exoskeleton Industry
The exoskeleton industry is propelled by several key drivers. Technological advancements in robotics, AI, and materials science are making exoskeletons more efficient, lighter, and affordable. Increasing awareness of their benefits in rehabilitation, coupled with a growing aging population and rising incidence of mobility-affecting conditions, fuels demand for medical exoskeletons. In the industrial sector, a focus on worker safety, injury prevention, and productivity enhancement is driving the adoption of industrial augmentation exoskeletons. Government initiatives and funding for assistive technologies also play a crucial role.
However, significant barriers and challenges impede widespread adoption. High initial costs remain a major restraint for both individuals and organizations. Regulatory hurdles, particularly for advanced medical devices, can slow down market entry and widespread deployment. The need for extensive training and user adaptation can also be a deterrent. Furthermore, issues related to battery life, weight, and long-term comfort need continuous improvement. Competition from alternative solutions and the inherent complexity of human-robot interaction present ongoing challenges.
Emerging Opportunities in Exoskeleton Industry
Emerging opportunities in the exoskeleton industry lie in untapped markets and innovative applications. The expanding use of wearable robots in logistics and construction for repetitive tasks and heavy lifting presents a significant growth avenue. The development of affordable, consumer-grade exoskeletons for the elderly and individuals with mild mobility issues opens up a vast new user base. Furthermore, advancements in haptic feedback and brain-computer interfaces offer the potential for even more intuitive and integrated human-robot collaboration. Personalized rehabilitation programs utilizing AI-driven exoskeletons, and the integration of exoskeletons into smart manufacturing environments, represent further promising frontiers.
Growth Accelerators in the Exoskeleton Industry Industry
The long-term growth of the exoskeleton industry is being accelerated by several key factors. Continuous breakthroughs in AI and machine learning are enabling exoskeletons to learn and adapt to individual user movements and needs, enhancing their effectiveness and user experience. Strategic partnerships between technology developers, healthcare providers, and industrial companies are crucial for co-creating solutions that meet specific market demands. Market expansion strategies, including global outreach and the development of localized support networks, are vital for increasing adoption rates. Furthermore, significant investments in R&D by both established corporations and venture-backed startups are fueling a pipeline of next-generation exoskeleton technologies.
Key Players Shaping the Exoskeleton Industry Market
- Parker-Hannifin Corp
- B-Temia Inc
- Rewalk Robotics
- Rehab-Robotics Company Limited
- Gogoa Mobility Robots
- Bioservo Technologies AB
- Bionik Laboratories Corp
- Cyberdyne Inc
- Ekso Bionics Holdings
- Bioness Inc
Notable Milestones in Exoskeleton Industry Sector
- 2019: ReWalk Robotics receives FDA clearance for the Exoskeleton for Stroke Rehabilitation.
- 2020: Cyberdyne Inc. expands its HAL (Hybrid Assistive Limb) suit applications into industrial use cases.
- 2021: Ekso Bionics Holdings announces a strategic partnership to develop advanced industrial exoskeletons.
- 2022: Bionik Laboratories Corp. secures funding for further development of its InMotionArm exoskeletons.
- 2023: Bioservo Technologies AB collaborates with NASA on advanced haptic feedback technologies for robotic suits.
- 2023: Gogoa Mobility Robots launches a new generation of personalized mobility exoskeletons.
- 2024: B-Temia Inc. receives regulatory approval for its Keeogo™ exoskeleton for home use.
- 2024: Parker-Hannifin Corp. showcases its advanced industrial exoskeleton solutions at major trade shows.
- 2024: Rehab-Robotics Company Limited expands its manufacturing capacity for its rehabilitation exoskeletons.
- 2025 (Estimated): Bioness Inc. is expected to launch its next-generation neural interface for exoskeleton control.
In-Depth Exoskeleton Industry Market Outlook
The future of the exoskeleton industry is exceptionally bright, driven by ongoing technological innovation and expanding market applications. Growth accelerators such as advancements in AI, strategic collaborations, and market expansion initiatives will continue to propel the industry forward. The increasing demand for solutions that enhance human capabilities, improve rehabilitation outcomes, and ensure worker safety will create sustained market growth. The report foresees a market ripe with opportunities for those who can navigate the evolving technological landscape and address the cost and regulatory challenges. Strategic investments in research and development, coupled with a focus on user-centric design, will be paramount for success in this dynamic sector.
Exoskeleton Industry Segmentation
-
1. Treatment Type
- 1.1. Rehabilitation
- 1.2. Augmentation
-
2. Body Part Type
- 2.1. Upper Body
- 2.2. Lower Body
-
3. Product Type
- 3.1. Stationary
- 3.2. Mobile
Exoskeleton Industry Segmentation By Geography
-
1. North America
- 1.1. United States
- 1.2. Canada
- 1.3. Mexico
-
2. Europe
- 2.1. Germany
- 2.2. United Kingdom
- 2.3. France
- 2.4. Italy
- 2.5. Spain
- 2.6. Rest of Europe
-
3. Asia Pacific
- 3.1. China
- 3.2. Japan
- 3.3. India
- 3.4. Australia
- 3.5. South Korea
- 3.6. Rest of Asia Pacific
-
4. Middle East and Africa
- 4.1. GCC
- 4.2. South Africa
- 4.3. Rest of Middle East and Africa
-
5. South America
- 5.1. Brazil
- 5.2. Argentina
- 5.3. Rest of South America
Exoskeleton Industry REPORT HIGHLIGHTS
| Aspects | Details |
|---|---|
| Study Period | 2019-2033 |
| Base Year | 2024 |
| Estimated Year | 2025 |
| Forecast Period | 2025-2033 |
| Historical Period | 2019-2024 |
| Growth Rate | CAGR of 12.50% from 2019-2033 |
| Segmentation |
|
Table of Contents
- 1. Introduction
- 1.1. Research Scope
- 1.2. Market Segmentation
- 1.3. Research Methodology
- 1.4. Definitions and Assumptions
- 2. Executive Summary
- 2.1. Introduction
- 3. Market Dynamics
- 3.1. Introduction
- 3.2. Market Drivers
- 3.2.1. Growing Demand from Healthcare Sector for Robotic Rehabilitation; Advancement in Robotic Technologies; Huge Investment for the Development of the Exoskeleton Technology
- 3.3. Market Restrains
- 3.3.1. Risks Involved with Using Exoskeletons Due to Vague Safety Guidelines
- 3.4. Market Trends
- 3.4.1. The Mobile Segment is Expected to Hold the Largest Share by Product Type Over the Forecast Period
- 4. Market Factor Analysis
- 4.1. Porters Five Forces
- 4.2. Supply/Value Chain
- 4.3. PESTEL analysis
- 4.4. Market Entropy
- 4.5. Patent/Trademark Analysis
- 5. Global Exoskeleton Industry Analysis, Insights and Forecast, 2019-2031
- 5.1. Market Analysis, Insights and Forecast - by Treatment Type
- 5.1.1. Rehabilitation
- 5.1.2. Augmentation
- 5.2. Market Analysis, Insights and Forecast - by Body Part Type
- 5.2.1. Upper Body
- 5.2.2. Lower Body
- 5.3. Market Analysis, Insights and Forecast - by Product Type
- 5.3.1. Stationary
- 5.3.2. Mobile
- 5.4. Market Analysis, Insights and Forecast - by Region
- 5.4.1. North America
- 5.4.2. Europe
- 5.4.3. Asia Pacific
- 5.4.4. Middle East and Africa
- 5.4.5. South America
- 5.1. Market Analysis, Insights and Forecast - by Treatment Type
- 6. North America Exoskeleton Industry Analysis, Insights and Forecast, 2019-2031
- 6.1. Market Analysis, Insights and Forecast - by Treatment Type
- 6.1.1. Rehabilitation
- 6.1.2. Augmentation
- 6.2. Market Analysis, Insights and Forecast - by Body Part Type
- 6.2.1. Upper Body
- 6.2.2. Lower Body
- 6.3. Market Analysis, Insights and Forecast - by Product Type
- 6.3.1. Stationary
- 6.3.2. Mobile
- 6.1. Market Analysis, Insights and Forecast - by Treatment Type
- 7. Europe Exoskeleton Industry Analysis, Insights and Forecast, 2019-2031
- 7.1. Market Analysis, Insights and Forecast - by Treatment Type
- 7.1.1. Rehabilitation
- 7.1.2. Augmentation
- 7.2. Market Analysis, Insights and Forecast - by Body Part Type
- 7.2.1. Upper Body
- 7.2.2. Lower Body
- 7.3. Market Analysis, Insights and Forecast - by Product Type
- 7.3.1. Stationary
- 7.3.2. Mobile
- 7.1. Market Analysis, Insights and Forecast - by Treatment Type
- 8. Asia Pacific Exoskeleton Industry Analysis, Insights and Forecast, 2019-2031
- 8.1. Market Analysis, Insights and Forecast - by Treatment Type
- 8.1.1. Rehabilitation
- 8.1.2. Augmentation
- 8.2. Market Analysis, Insights and Forecast - by Body Part Type
- 8.2.1. Upper Body
- 8.2.2. Lower Body
- 8.3. Market Analysis, Insights and Forecast - by Product Type
- 8.3.1. Stationary
- 8.3.2. Mobile
- 8.1. Market Analysis, Insights and Forecast - by Treatment Type
- 9. Middle East and Africa Exoskeleton Industry Analysis, Insights and Forecast, 2019-2031
- 9.1. Market Analysis, Insights and Forecast - by Treatment Type
- 9.1.1. Rehabilitation
- 9.1.2. Augmentation
- 9.2. Market Analysis, Insights and Forecast - by Body Part Type
- 9.2.1. Upper Body
- 9.2.2. Lower Body
- 9.3. Market Analysis, Insights and Forecast - by Product Type
- 9.3.1. Stationary
- 9.3.2. Mobile
- 9.1. Market Analysis, Insights and Forecast - by Treatment Type
- 10. South America Exoskeleton Industry Analysis, Insights and Forecast, 2019-2031
- 10.1. Market Analysis, Insights and Forecast - by Treatment Type
- 10.1.1. Rehabilitation
- 10.1.2. Augmentation
- 10.2. Market Analysis, Insights and Forecast - by Body Part Type
- 10.2.1. Upper Body
- 10.2.2. Lower Body
- 10.3. Market Analysis, Insights and Forecast - by Product Type
- 10.3.1. Stationary
- 10.3.2. Mobile
- 10.1. Market Analysis, Insights and Forecast - by Treatment Type
- 11. North America Exoskeleton Industry Analysis, Insights and Forecast, 2019-2031
- 11.1. Market Analysis, Insights and Forecast - By Country/Sub-region
- 11.1.1 United States
- 11.1.2 Canada
- 11.1.3 Mexico
- 12. Europe Exoskeleton Industry Analysis, Insights and Forecast, 2019-2031
- 12.1. Market Analysis, Insights and Forecast - By Country/Sub-region
- 12.1.1 Germany
- 12.1.2 United Kingdom
- 12.1.3 France
- 12.1.4 Italy
- 12.1.5 Spain
- 12.1.6 Rest of Europe
- 13. Asia Pacific Exoskeleton Industry Analysis, Insights and Forecast, 2019-2031
- 13.1. Market Analysis, Insights and Forecast - By Country/Sub-region
- 13.1.1 China
- 13.1.2 Japan
- 13.1.3 India
- 13.1.4 Australia
- 13.1.5 South Korea
- 13.1.6 Rest of Asia Pacific
- 14. Middle East and Africa Exoskeleton Industry Analysis, Insights and Forecast, 2019-2031
- 14.1. Market Analysis, Insights and Forecast - By Country/Sub-region
- 14.1.1 GCC
- 14.1.2 South Africa
- 14.1.3 Rest of Middle East and Africa
- 15. South America Exoskeleton Industry Analysis, Insights and Forecast, 2019-2031
- 15.1. Market Analysis, Insights and Forecast - By Country/Sub-region
- 15.1.1 Brazil
- 15.1.2 Argentina
- 15.1.3 Rest of South America
- 16. Competitive Analysis
- 16.1. Global Market Share Analysis 2024
- 16.2. Company Profiles
- 16.2.1 Parker-Hannifin Corp
- 16.2.1.1. Overview
- 16.2.1.2. Products
- 16.2.1.3. SWOT Analysis
- 16.2.1.4. Recent Developments
- 16.2.1.5. Financials (Based on Availability)
- 16.2.2 B-Temia Inc
- 16.2.2.1. Overview
- 16.2.2.2. Products
- 16.2.2.3. SWOT Analysis
- 16.2.2.4. Recent Developments
- 16.2.2.5. Financials (Based on Availability)
- 16.2.3 Rewalk Robotics
- 16.2.3.1. Overview
- 16.2.3.2. Products
- 16.2.3.3. SWOT Analysis
- 16.2.3.4. Recent Developments
- 16.2.3.5. Financials (Based on Availability)
- 16.2.4 Rehab-Robotics Company Limited
- 16.2.4.1. Overview
- 16.2.4.2. Products
- 16.2.4.3. SWOT Analysis
- 16.2.4.4. Recent Developments
- 16.2.4.5. Financials (Based on Availability)
- 16.2.5 Gogoa Mobility Robots
- 16.2.5.1. Overview
- 16.2.5.2. Products
- 16.2.5.3. SWOT Analysis
- 16.2.5.4. Recent Developments
- 16.2.5.5. Financials (Based on Availability)
- 16.2.6 Bioservo Technologies AB
- 16.2.6.1. Overview
- 16.2.6.2. Products
- 16.2.6.3. SWOT Analysis
- 16.2.6.4. Recent Developments
- 16.2.6.5. Financials (Based on Availability)
- 16.2.7 Bionik Laboratories Corp
- 16.2.7.1. Overview
- 16.2.7.2. Products
- 16.2.7.3. SWOT Analysis
- 16.2.7.4. Recent Developments
- 16.2.7.5. Financials (Based on Availability)
- 16.2.8 Cyberdyne Inc
- 16.2.8.1. Overview
- 16.2.8.2. Products
- 16.2.8.3. SWOT Analysis
- 16.2.8.4. Recent Developments
- 16.2.8.5. Financials (Based on Availability)
- 16.2.9 Ekso Bionics Holdings
- 16.2.9.1. Overview
- 16.2.9.2. Products
- 16.2.9.3. SWOT Analysis
- 16.2.9.4. Recent Developments
- 16.2.9.5. Financials (Based on Availability)
- 16.2.10 Bioness Inc
- 16.2.10.1. Overview
- 16.2.10.2. Products
- 16.2.10.3. SWOT Analysis
- 16.2.10.4. Recent Developments
- 16.2.10.5. Financials (Based on Availability)
- 16.2.1 Parker-Hannifin Corp
List of Figures
- Figure 1: Global Exoskeleton Industry Revenue Breakdown (Million, %) by Region 2024 & 2032
- Figure 2: North America Exoskeleton Industry Revenue (Million), by Country 2024 & 2032
- Figure 3: North America Exoskeleton Industry Revenue Share (%), by Country 2024 & 2032
- Figure 4: Europe Exoskeleton Industry Revenue (Million), by Country 2024 & 2032
- Figure 5: Europe Exoskeleton Industry Revenue Share (%), by Country 2024 & 2032
- Figure 6: Asia Pacific Exoskeleton Industry Revenue (Million), by Country 2024 & 2032
- Figure 7: Asia Pacific Exoskeleton Industry Revenue Share (%), by Country 2024 & 2032
- Figure 8: Middle East and Africa Exoskeleton Industry Revenue (Million), by Country 2024 & 2032
- Figure 9: Middle East and Africa Exoskeleton Industry Revenue Share (%), by Country 2024 & 2032
- Figure 10: South America Exoskeleton Industry Revenue (Million), by Country 2024 & 2032
- Figure 11: South America Exoskeleton Industry Revenue Share (%), by Country 2024 & 2032
- Figure 12: North America Exoskeleton Industry Revenue (Million), by Treatment Type 2024 & 2032
- Figure 13: North America Exoskeleton Industry Revenue Share (%), by Treatment Type 2024 & 2032
- Figure 14: North America Exoskeleton Industry Revenue (Million), by Body Part Type 2024 & 2032
- Figure 15: North America Exoskeleton Industry Revenue Share (%), by Body Part Type 2024 & 2032
- Figure 16: North America Exoskeleton Industry Revenue (Million), by Product Type 2024 & 2032
- Figure 17: North America Exoskeleton Industry Revenue Share (%), by Product Type 2024 & 2032
- Figure 18: North America Exoskeleton Industry Revenue (Million), by Country 2024 & 2032
- Figure 19: North America Exoskeleton Industry Revenue Share (%), by Country 2024 & 2032
- Figure 20: Europe Exoskeleton Industry Revenue (Million), by Treatment Type 2024 & 2032
- Figure 21: Europe Exoskeleton Industry Revenue Share (%), by Treatment Type 2024 & 2032
- Figure 22: Europe Exoskeleton Industry Revenue (Million), by Body Part Type 2024 & 2032
- Figure 23: Europe Exoskeleton Industry Revenue Share (%), by Body Part Type 2024 & 2032
- Figure 24: Europe Exoskeleton Industry Revenue (Million), by Product Type 2024 & 2032
- Figure 25: Europe Exoskeleton Industry Revenue Share (%), by Product Type 2024 & 2032
- Figure 26: Europe Exoskeleton Industry Revenue (Million), by Country 2024 & 2032
- Figure 27: Europe Exoskeleton Industry Revenue Share (%), by Country 2024 & 2032
- Figure 28: Asia Pacific Exoskeleton Industry Revenue (Million), by Treatment Type 2024 & 2032
- Figure 29: Asia Pacific Exoskeleton Industry Revenue Share (%), by Treatment Type 2024 & 2032
- Figure 30: Asia Pacific Exoskeleton Industry Revenue (Million), by Body Part Type 2024 & 2032
- Figure 31: Asia Pacific Exoskeleton Industry Revenue Share (%), by Body Part Type 2024 & 2032
- Figure 32: Asia Pacific Exoskeleton Industry Revenue (Million), by Product Type 2024 & 2032
- Figure 33: Asia Pacific Exoskeleton Industry Revenue Share (%), by Product Type 2024 & 2032
- Figure 34: Asia Pacific Exoskeleton Industry Revenue (Million), by Country 2024 & 2032
- Figure 35: Asia Pacific Exoskeleton Industry Revenue Share (%), by Country 2024 & 2032
- Figure 36: Middle East and Africa Exoskeleton Industry Revenue (Million), by Treatment Type 2024 & 2032
- Figure 37: Middle East and Africa Exoskeleton Industry Revenue Share (%), by Treatment Type 2024 & 2032
- Figure 38: Middle East and Africa Exoskeleton Industry Revenue (Million), by Body Part Type 2024 & 2032
- Figure 39: Middle East and Africa Exoskeleton Industry Revenue Share (%), by Body Part Type 2024 & 2032
- Figure 40: Middle East and Africa Exoskeleton Industry Revenue (Million), by Product Type 2024 & 2032
- Figure 41: Middle East and Africa Exoskeleton Industry Revenue Share (%), by Product Type 2024 & 2032
- Figure 42: Middle East and Africa Exoskeleton Industry Revenue (Million), by Country 2024 & 2032
- Figure 43: Middle East and Africa Exoskeleton Industry Revenue Share (%), by Country 2024 & 2032
- Figure 44: South America Exoskeleton Industry Revenue (Million), by Treatment Type 2024 & 2032
- Figure 45: South America Exoskeleton Industry Revenue Share (%), by Treatment Type 2024 & 2032
- Figure 46: South America Exoskeleton Industry Revenue (Million), by Body Part Type 2024 & 2032
- Figure 47: South America Exoskeleton Industry Revenue Share (%), by Body Part Type 2024 & 2032
- Figure 48: South America Exoskeleton Industry Revenue (Million), by Product Type 2024 & 2032
- Figure 49: South America Exoskeleton Industry Revenue Share (%), by Product Type 2024 & 2032
- Figure 50: South America Exoskeleton Industry Revenue (Million), by Country 2024 & 2032
- Figure 51: South America Exoskeleton Industry Revenue Share (%), by Country 2024 & 2032
List of Tables
- Table 1: Global Exoskeleton Industry Revenue Million Forecast, by Region 2019 & 2032
- Table 2: Global Exoskeleton Industry Revenue Million Forecast, by Treatment Type 2019 & 2032
- Table 3: Global Exoskeleton Industry Revenue Million Forecast, by Body Part Type 2019 & 2032
- Table 4: Global Exoskeleton Industry Revenue Million Forecast, by Product Type 2019 & 2032
- Table 5: Global Exoskeleton Industry Revenue Million Forecast, by Region 2019 & 2032
- Table 6: Global Exoskeleton Industry Revenue Million Forecast, by Country 2019 & 2032
- Table 7: United States Exoskeleton Industry Revenue (Million) Forecast, by Application 2019 & 2032
- Table 8: Canada Exoskeleton Industry Revenue (Million) Forecast, by Application 2019 & 2032
- Table 9: Mexico Exoskeleton Industry Revenue (Million) Forecast, by Application 2019 & 2032
- Table 10: Global Exoskeleton Industry Revenue Million Forecast, by Country 2019 & 2032
- Table 11: Germany Exoskeleton Industry Revenue (Million) Forecast, by Application 2019 & 2032
- Table 12: United Kingdom Exoskeleton Industry Revenue (Million) Forecast, by Application 2019 & 2032
- Table 13: France Exoskeleton Industry Revenue (Million) Forecast, by Application 2019 & 2032
- Table 14: Italy Exoskeleton Industry Revenue (Million) Forecast, by Application 2019 & 2032
- Table 15: Spain Exoskeleton Industry Revenue (Million) Forecast, by Application 2019 & 2032
- Table 16: Rest of Europe Exoskeleton Industry Revenue (Million) Forecast, by Application 2019 & 2032
- Table 17: Global Exoskeleton Industry Revenue Million Forecast, by Country 2019 & 2032
- Table 18: China Exoskeleton Industry Revenue (Million) Forecast, by Application 2019 & 2032
- Table 19: Japan Exoskeleton Industry Revenue (Million) Forecast, by Application 2019 & 2032
- Table 20: India Exoskeleton Industry Revenue (Million) Forecast, by Application 2019 & 2032
- Table 21: Australia Exoskeleton Industry Revenue (Million) Forecast, by Application 2019 & 2032
- Table 22: South Korea Exoskeleton Industry Revenue (Million) Forecast, by Application 2019 & 2032
- Table 23: Rest of Asia Pacific Exoskeleton Industry Revenue (Million) Forecast, by Application 2019 & 2032
- Table 24: Global Exoskeleton Industry Revenue Million Forecast, by Country 2019 & 2032
- Table 25: GCC Exoskeleton Industry Revenue (Million) Forecast, by Application 2019 & 2032
- Table 26: South Africa Exoskeleton Industry Revenue (Million) Forecast, by Application 2019 & 2032
- Table 27: Rest of Middle East and Africa Exoskeleton Industry Revenue (Million) Forecast, by Application 2019 & 2032
- Table 28: Global Exoskeleton Industry Revenue Million Forecast, by Country 2019 & 2032
- Table 29: Brazil Exoskeleton Industry Revenue (Million) Forecast, by Application 2019 & 2032
- Table 30: Argentina Exoskeleton Industry Revenue (Million) Forecast, by Application 2019 & 2032
- Table 31: Rest of South America Exoskeleton Industry Revenue (Million) Forecast, by Application 2019 & 2032
- Table 32: Global Exoskeleton Industry Revenue Million Forecast, by Treatment Type 2019 & 2032
- Table 33: Global Exoskeleton Industry Revenue Million Forecast, by Body Part Type 2019 & 2032
- Table 34: Global Exoskeleton Industry Revenue Million Forecast, by Product Type 2019 & 2032
- Table 35: Global Exoskeleton Industry Revenue Million Forecast, by Country 2019 & 2032
- Table 36: United States Exoskeleton Industry Revenue (Million) Forecast, by Application 2019 & 2032
- Table 37: Canada Exoskeleton Industry Revenue (Million) Forecast, by Application 2019 & 2032
- Table 38: Mexico Exoskeleton Industry Revenue (Million) Forecast, by Application 2019 & 2032
- Table 39: Global Exoskeleton Industry Revenue Million Forecast, by Treatment Type 2019 & 2032
- Table 40: Global Exoskeleton Industry Revenue Million Forecast, by Body Part Type 2019 & 2032
- Table 41: Global Exoskeleton Industry Revenue Million Forecast, by Product Type 2019 & 2032
- Table 42: Global Exoskeleton Industry Revenue Million Forecast, by Country 2019 & 2032
- Table 43: Germany Exoskeleton Industry Revenue (Million) Forecast, by Application 2019 & 2032
- Table 44: United Kingdom Exoskeleton Industry Revenue (Million) Forecast, by Application 2019 & 2032
- Table 45: France Exoskeleton Industry Revenue (Million) Forecast, by Application 2019 & 2032
- Table 46: Italy Exoskeleton Industry Revenue (Million) Forecast, by Application 2019 & 2032
- Table 47: Spain Exoskeleton Industry Revenue (Million) Forecast, by Application 2019 & 2032
- Table 48: Rest of Europe Exoskeleton Industry Revenue (Million) Forecast, by Application 2019 & 2032
- Table 49: Global Exoskeleton Industry Revenue Million Forecast, by Treatment Type 2019 & 2032
- Table 50: Global Exoskeleton Industry Revenue Million Forecast, by Body Part Type 2019 & 2032
- Table 51: Global Exoskeleton Industry Revenue Million Forecast, by Product Type 2019 & 2032
- Table 52: Global Exoskeleton Industry Revenue Million Forecast, by Country 2019 & 2032
- Table 53: China Exoskeleton Industry Revenue (Million) Forecast, by Application 2019 & 2032
- Table 54: Japan Exoskeleton Industry Revenue (Million) Forecast, by Application 2019 & 2032
- Table 55: India Exoskeleton Industry Revenue (Million) Forecast, by Application 2019 & 2032
- Table 56: Australia Exoskeleton Industry Revenue (Million) Forecast, by Application 2019 & 2032
- Table 57: South Korea Exoskeleton Industry Revenue (Million) Forecast, by Application 2019 & 2032
- Table 58: Rest of Asia Pacific Exoskeleton Industry Revenue (Million) Forecast, by Application 2019 & 2032
- Table 59: Global Exoskeleton Industry Revenue Million Forecast, by Treatment Type 2019 & 2032
- Table 60: Global Exoskeleton Industry Revenue Million Forecast, by Body Part Type 2019 & 2032
- Table 61: Global Exoskeleton Industry Revenue Million Forecast, by Product Type 2019 & 2032
- Table 62: Global Exoskeleton Industry Revenue Million Forecast, by Country 2019 & 2032
- Table 63: GCC Exoskeleton Industry Revenue (Million) Forecast, by Application 2019 & 2032
- Table 64: South Africa Exoskeleton Industry Revenue (Million) Forecast, by Application 2019 & 2032
- Table 65: Rest of Middle East and Africa Exoskeleton Industry Revenue (Million) Forecast, by Application 2019 & 2032
- Table 66: Global Exoskeleton Industry Revenue Million Forecast, by Treatment Type 2019 & 2032
- Table 67: Global Exoskeleton Industry Revenue Million Forecast, by Body Part Type 2019 & 2032
- Table 68: Global Exoskeleton Industry Revenue Million Forecast, by Product Type 2019 & 2032
- Table 69: Global Exoskeleton Industry Revenue Million Forecast, by Country 2019 & 2032
- Table 70: Brazil Exoskeleton Industry Revenue (Million) Forecast, by Application 2019 & 2032
- Table 71: Argentina Exoskeleton Industry Revenue (Million) Forecast, by Application 2019 & 2032
- Table 72: Rest of South America Exoskeleton Industry Revenue (Million) Forecast, by Application 2019 & 2032
Frequently Asked Questions
1. What is the projected Compound Annual Growth Rate (CAGR) of the Exoskeleton Industry?
The projected CAGR is approximately 12.50%.
2. Which companies are prominent players in the Exoskeleton Industry?
Key companies in the market include Parker-Hannifin Corp, B-Temia Inc, Rewalk Robotics, Rehab-Robotics Company Limited, Gogoa Mobility Robots, Bioservo Technologies AB, Bionik Laboratories Corp, Cyberdyne Inc, Ekso Bionics Holdings, Bioness Inc.
3. What are the main segments of the Exoskeleton Industry?
The market segments include Treatment Type, Body Part Type, Product Type.
4. Can you provide details about the market size?
The market size is estimated to be USD XX Million as of 2022.
5. What are some drivers contributing to market growth?
Growing Demand from Healthcare Sector for Robotic Rehabilitation; Advancement in Robotic Technologies; Huge Investment for the Development of the Exoskeleton Technology.
6. What are the notable trends driving market growth?
The Mobile Segment is Expected to Hold the Largest Share by Product Type Over the Forecast Period.
7. Are there any restraints impacting market growth?
Risks Involved with Using Exoskeletons Due to Vague Safety Guidelines.
8. Can you provide examples of recent developments in the market?
N/A
9. What pricing options are available for accessing the report?
Pricing options include single-user, multi-user, and enterprise licenses priced at USD 4750, USD 5250, and USD 8750 respectively.
10. Is the market size provided in terms of value or volume?
The market size is provided in terms of value, measured in Million.
11. Are there any specific market keywords associated with the report?
Yes, the market keyword associated with the report is "Exoskeleton Industry," which aids in identifying and referencing the specific market segment covered.
12. How do I determine which pricing option suits my needs best?
The pricing options vary based on user requirements and access needs. Individual users may opt for single-user licenses, while businesses requiring broader access may choose multi-user or enterprise licenses for cost-effective access to the report.
13. Are there any additional resources or data provided in the Exoskeleton Industry report?
While the report offers comprehensive insights, it's advisable to review the specific contents or supplementary materials provided to ascertain if additional resources or data are available.
14. How can I stay updated on further developments or reports in the Exoskeleton Industry?
To stay informed about further developments, trends, and reports in the Exoskeleton Industry, consider subscribing to industry newsletters, following relevant companies and organizations, or regularly checking reputable industry news sources and publications.
Methodology
Step 1 - Identification of Relevant Samples Size from Population Database


Step 2 - Approaches for Defining Global Market Size (Value, Volume* & Price*)

Note*: In applicable scenarios
Step 3 - Data Sources
Primary Research
- Web Analytics
- Survey Reports
- Research Institute
- Latest Research Reports
- Opinion Leaders
Secondary Research
- Annual Reports
- White Paper
- Latest Press Release
- Industry Association
- Paid Database
- Investor Presentations

Step 4 - Data Triangulation
Involves using different sources of information in order to increase the validity of a study
These sources are likely to be stakeholders in a program - participants, other researchers, program staff, other community members, and so on.
Then we put all data in single framework & apply various statistical tools to find out the dynamic on the market.
During the analysis stage, feedback from the stakeholder groups would be compared to determine areas of agreement as well as areas of divergence
