

Key Insights
The Flue Gas Desulfurization (FGD) Systems market is poised for significant expansion, driven by increasingly stringent environmental regulations targeting sulfur dioxide (SO2) emissions across key industrial sectors including power generation, cement, and chemicals. The market is projected to reach $9.55 billion by 2025, with a robust Compound Annual Growth Rate (CAGR) of approximately 13.06% from 2025 to 2033. This upward trajectory is propelled by the growth of coal-fired power plants in emerging economies, the rising demand for sustainable energy, and global efforts to achieve emission compliance. The market is further bolstered by the adoption of advanced FGD technologies, such as Dry and Wet FGD systems, which cater to diverse industrial requirements. While power generation remains the primary application, burgeoning industrial activity in regions like Asia-Pacific is stimulating growth across other segments, including cement, chemical, and iron and steel manufacturing.
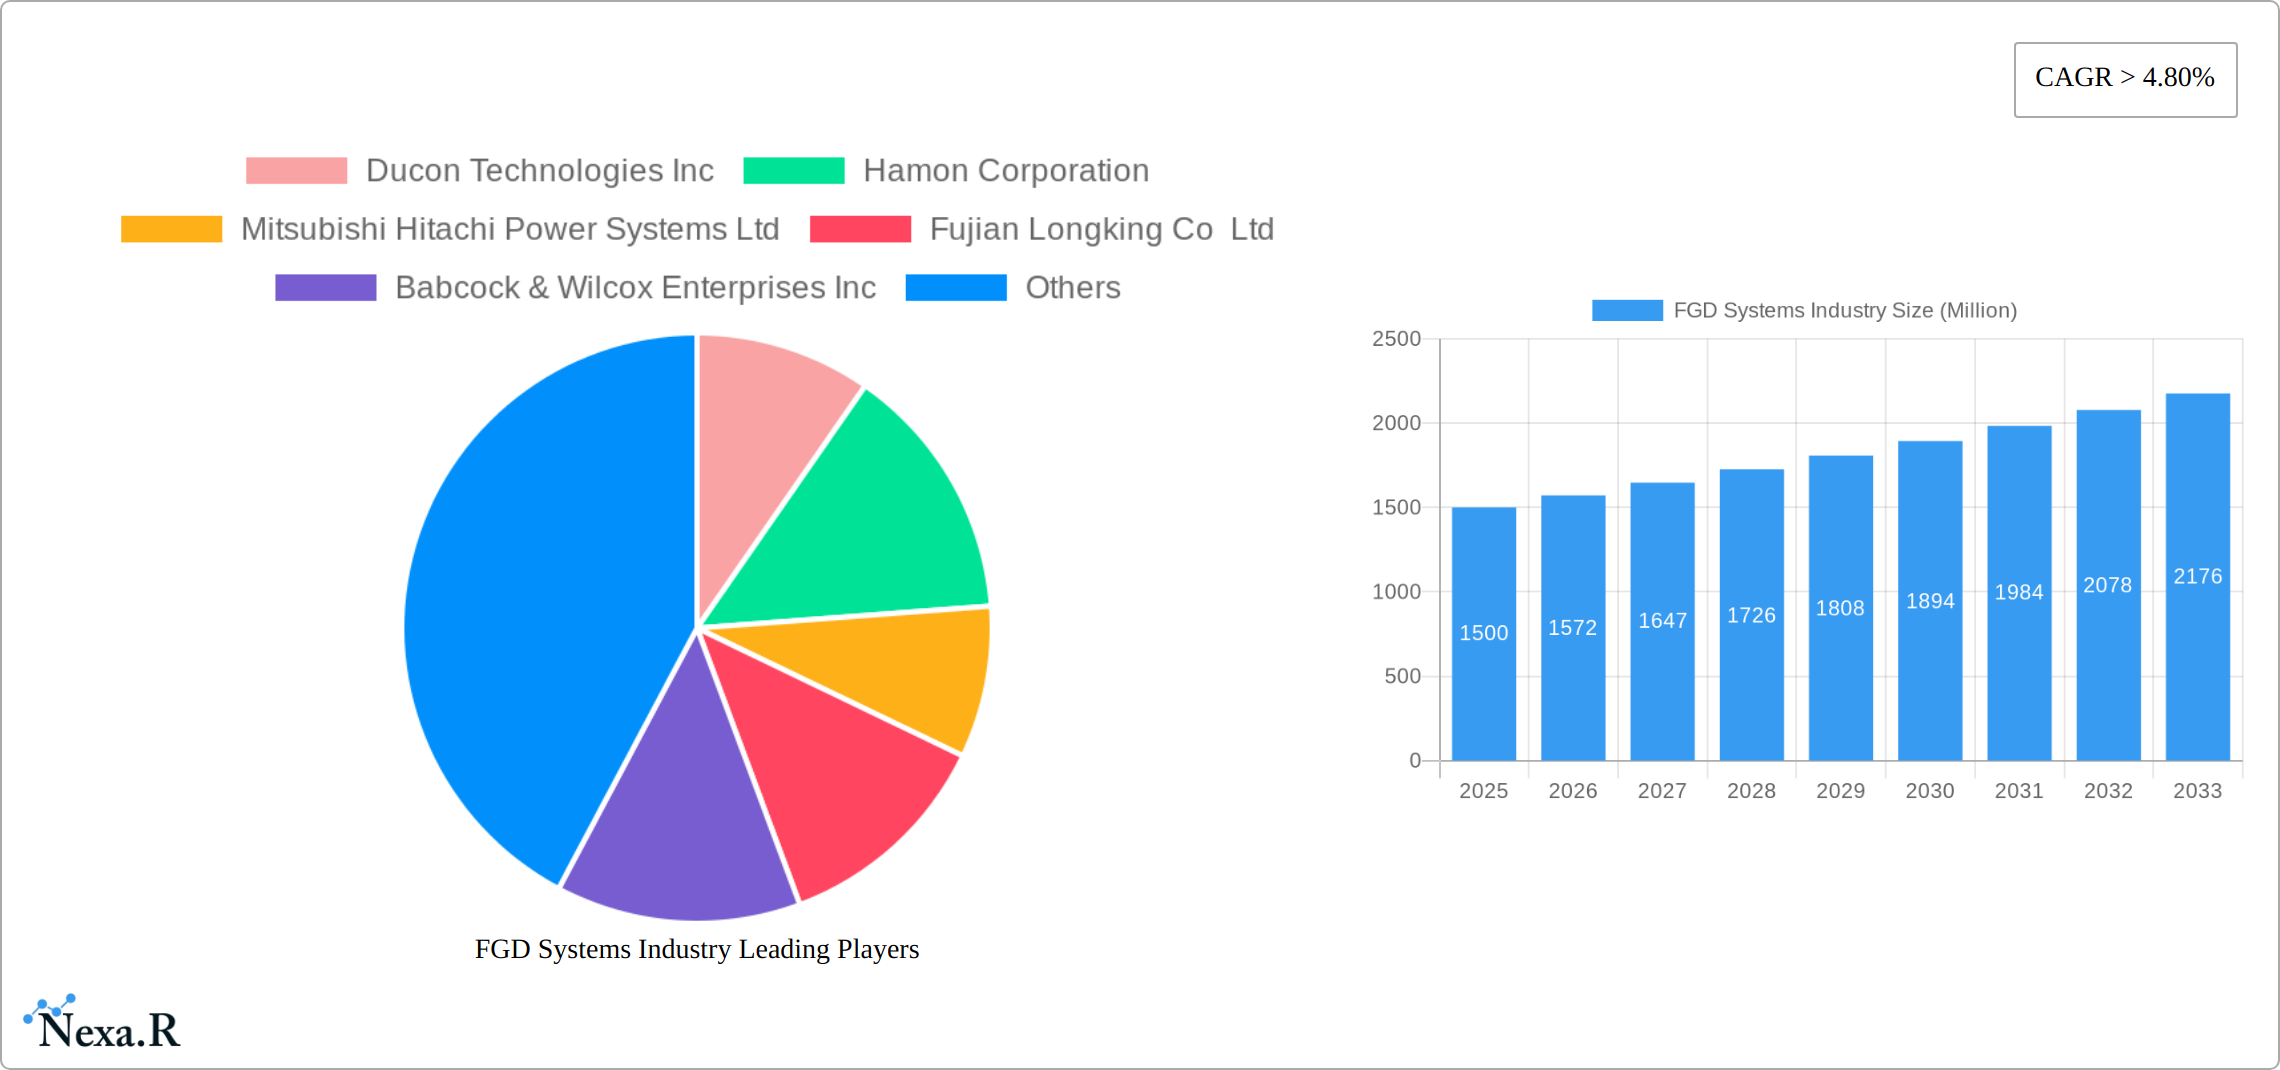
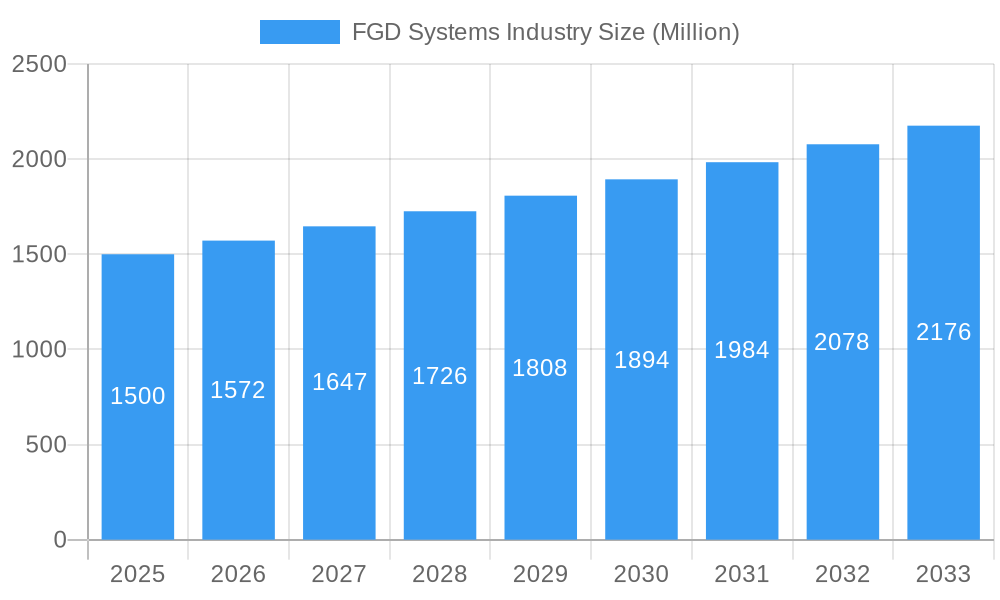
FGD Systems Industry Market Size (In Billion)
Key market trends include technological innovations focused on enhancing energy efficiency, minimizing water usage (particularly for Wet FGD systems), and reducing operational expenditures. Geographic expansion, especially within Asia-Pacific and other developing regions experiencing rapid industrialization and implementing air quality initiatives, is a significant growth factor. Despite considerable initial investment requirements and challenges in by-product management, the long-term environmental and public health benefits of FGD systems are expected to ensure sustained market growth. Leading companies such as Ducon Technologies, Hamon Corporation, and Mitsubishi Hitachi Power Systems are actively shaping this competitive landscape through continuous innovation and strategic market penetration.
FGD Systems Industry Company Market Share
FGD Systems Market Report: 2019-2033
A Comprehensive Analysis of the FGD Systems Industry, encompassing Dry FGD and Wet FGD technologies across Power Generation, Cement, Chemical, Iron & Steel, and Other End-User Industries.
This in-depth report provides a comprehensive analysis of the FGD Systems market from 2019 to 2033, offering invaluable insights for industry professionals, investors, and strategic decision-makers. The report leverages rigorous data analysis and expert insights to uncover key trends, growth drivers, and challenges shaping this dynamic sector. With a focus on both the parent market (Pollution Control Equipment) and the child market (FGD Systems), this report provides a granular understanding of market segments including Dry FGD and Wet FGD, across various end-user industries. The market size is projected in Million USD.
FGD Systems Industry Market Dynamics & Structure
This section analyzes the FGD Systems market's competitive landscape, encompassing market concentration, technological advancements, regulatory influences, competitive substitutes, end-user demographics, and merger & acquisition (M&A) activities. The analysis spans the period from 2019-2024 and projects trends through 2033.
- Market Concentration: The FGD Systems market exhibits a moderately consolidated structure, with a few major players holding significant market share (estimated at xx% for the top 5 players in 2025).
- Technological Innovation: Continuous innovation in FGD technology focuses on enhancing efficiency, reducing operational costs, and minimizing environmental impact. Key areas of focus include advanced materials, automation, and integration with other emission control systems. Barriers to innovation include high R&D costs and the need for rigorous testing and regulatory approvals.
- Regulatory Framework: Stringent environmental regulations globally are driving the demand for FGD systems. Compliance costs and evolving emission standards significantly impact market growth. Variations in regulatory frameworks across different regions create diverse market opportunities.
- Competitive Substitutes: Alternative technologies for flue gas desulfurization, albeit less prevalent, include wet scrubbers and dry sorbent injection. The competitive landscape is influenced by the cost-effectiveness and efficiency of each technology.
- End-User Demographics: The power generation sector remains the dominant end-user, followed by the cement, chemical, and iron and steel industries. Growth in these sectors, particularly in developing economies, fuels FGD Systems demand.
- M&A Trends: The number of M&A deals in the FGD Systems industry between 2019-2024 averaged xx per year. Consolidation is expected to continue, driven by the need for enhanced technological capabilities and geographical reach.
FGD Systems Industry Growth Trends & Insights
This section provides a comprehensive analysis of the FGD Systems market's growth trajectory, leveraging both qualitative and quantitative data. The analysis examines market size evolution, adoption rates, technological disruptions, and shifts in consumer behavior (i.e., end-user preferences and investment decisions).
The FGD Systems market witnessed significant growth during the historical period (2019-2024), with a Compound Annual Growth Rate (CAGR) of xx%. This growth is expected to continue during the forecast period (2025-2033), with a projected CAGR of xx%, driven by factors such as increasing environmental regulations, expanding industrial capacity in emerging economies, and advancements in FGD technology. Market penetration is expected to reach xx% by 2033. Technological disruptions, such as the adoption of advanced materials and AI-driven optimization, are expected to further accelerate market growth. The shift towards more stringent emission standards and a growing awareness of environmental sustainability among end-users are also crucial drivers. This analysis includes detailed market sizing and forecasting based on type (Dry FGD and Wet FGD) and end-user industry.
Dominant Regions, Countries, or Segments in FGD Systems Industry
This section analyzes the leading geographic regions, specific countries, and market segments within the FGD Systems industry that are driving its growth. The analysis encompasses market share data, growth potential assessments, and identification of key contributing factors. A nuanced understanding of these dynamics is crucial for strategic decision-making within the industry.
- Dominant Region: The Asia-Pacific region is projected to maintain its leading position in the FGD Systems market. This dominance is attributed to factors such as rapid industrial expansion, a surge in power generation capacity, and increasingly stringent environmental regulations aimed at mitigating air pollution.
- Key Growth Countries: China and India are the primary growth drivers within the Asia-Pacific region, reflecting their significant energy demands and ongoing infrastructure development. Other notable contributors include the United States, Germany, and Japan, each representing substantial markets with established regulatory frameworks and substantial investments in emission control technologies.
- Dominant Segment (Technology): Wet FGD systems currently command a larger market share than dry FGD systems due to their superior efficiency in removing sulfur dioxide (SO2) emissions. However, dry FGD systems are experiencing growing adoption, driven by their advantages in terms of reduced water consumption and smaller footprint requirements, making them attractive options in specific applications and geographical contexts. The choice between wet and dry systems often depends on factors like site-specific conditions, regulatory constraints, and overall cost-benefit analysis.
- Dominant Segment (End-User): The power generation sector remains the largest end-user of FGD systems, followed by the cement and chemical industries. The growth trajectory of these sectors directly correlates with the demand for FGD systems. Key drivers include government incentives promoting renewable energy integration, increasing environmental awareness among consumers and stakeholders, and a growing focus on corporate social responsibility.
FGD Systems Industry Product Landscape
FGD systems are evolving to incorporate advanced technologies, improving efficiency and minimizing environmental footprint. Recent innovations include improved scrubbing solutions for enhanced SO2 removal, advanced control systems for optimized operation, and the integration of waste heat recovery systems to enhance energy efficiency. These advancements deliver superior performance, reduced operational costs, and enhanced environmental compliance. Key selling propositions include reduced operating costs, improved SO2 removal efficiency, lower water usage (for dry FGD), and compact designs.
Key Drivers, Barriers & Challenges in FGD Systems Industry
Key Drivers:
- Stringent Environmental Regulations: Globally implemented and increasingly stringent environmental regulations are the primary impetus for the growth of the FGD systems market. These regulations impose limits on SO2 and other harmful emissions, necessitating the adoption of FGD technology.
- Industrialization and Power Generation Expansion: The ongoing expansion of industrial activities and power generation capacity, particularly in developing economies, fuels the demand for FGD systems to mitigate the environmental impact of these operations.
- Technological Advancements: Continuous innovation in FGD system technologies leads to improved efficiency, reduced operational costs, and enhanced performance, making them a more attractive investment for various sectors.
- Growing Environmental Awareness: Increased public awareness of the detrimental health and environmental consequences of air pollution has created greater pressure on industries to adopt cleaner technologies, including FGD systems.
Key Barriers and Challenges:
- High Capital Expenditure (CAPEX): The significant upfront investment required for installing FGD systems can be a major barrier to entry, particularly for smaller companies or those operating in developing economies.
- Operational Costs: Ongoing operational expenses, including energy consumption, maintenance, and waste disposal, contribute to the overall cost of ownership and can influence the financial viability of FGD systems.
- Skilled Labor Shortages: The installation, operation, and maintenance of FGD systems require specialized skills and expertise, and shortages of qualified personnel can hinder project implementation and efficient operation.
- Regulatory Uncertainty: Changes in environmental regulations and emission standards can create uncertainty and impact project timelines and costs, potentially discouraging investment in FGD systems.
Emerging Opportunities in FGD Systems Industry
The FGD Systems industry presents several promising opportunities for growth and innovation. The increasing adoption of hybrid FGD systems, combining different technologies to optimize performance and reduce costs, is a key trend. Developments in advanced materials and sensor technologies promise to enhance efficiency and enable more precise performance monitoring. Finally, expanding into new markets, such as smaller industrial facilities and developing economies with increasing environmental concerns, offers significant potential for market expansion.
Growth Accelerators in the FGD Systems Industry
Long-term growth will be propelled by technological breakthroughs in areas such as AI-driven optimization and the development of more sustainable materials. Strategic partnerships between FGD system manufacturers and power generation companies will be crucial in accelerating market penetration. Expansion into new geographical markets and diversification into new end-user industries will also drive long-term growth.
Key Players Shaping the FGD Systems Industry Market
Notable Milestones in FGD Systems Industry Sector
- 2021-Q3: Introduction of a new dry FGD system by X company, featuring advanced materials for enhanced efficiency.
- 2022-Q1: Merger between two prominent FGD system providers, expanding market reach and technological capabilities.
- 2023-Q4: Launch of a government initiative promoting the adoption of FGD systems in the cement industry.
In-Depth FGD Systems Industry Market Outlook
The FGD Systems market is poised for substantial growth over the coming decade, fueled by ongoing demand from the power generation and other industrial sectors. Strategic alliances, technological advancements, and expansion into emerging markets present significant opportunities for existing and new market participants. Businesses prioritizing innovation, operational efficiency, and sustainable solutions are well-positioned to succeed in this dynamic landscape. Market forecasts predict a market valuation of xx Million USD by 2033, indicating a compelling investment prospect for both established industry players and new entrants. Further detailed analysis is required to refine this prediction and identify specific investment opportunities.
FGD Systems Industry Segmentation
-
1. Type
- 1.1. Dry FGD
- 1.2. Wet FGD
-
2. End-User Industry
- 2.1. Power Generation
- 2.2. Cement
- 2.3. Chemical
- 2.4. Iron and Steel
- 2.5. Other End-User Industries
FGD Systems Industry Segmentation By Geography
- 1. North America
- 2. Europe
- 3. Asia Pacific
- 4. South America
- 5. Middle East and Africa
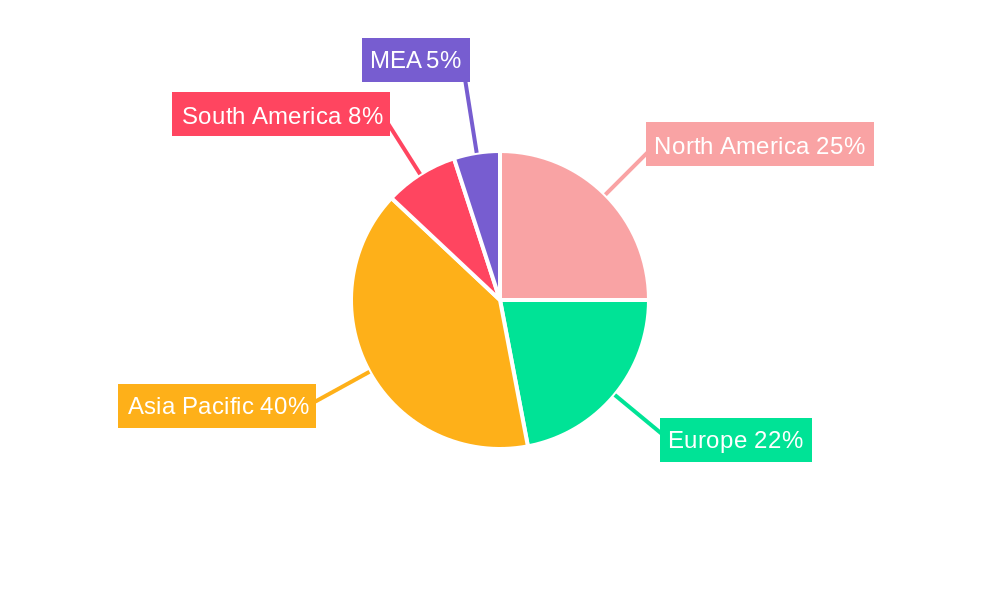
FGD Systems Industry Regional Market Share
Geographic Coverage of FGD Systems Industry
FGD Systems Industry REPORT HIGHLIGHTS
| Aspects | Details |
|---|---|
| Study Period | 2020-2034 |
| Base Year | 2025 |
| Estimated Year | 2026 |
| Forecast Period | 2026-2034 |
| Historical Period | 2020-2025 |
| Growth Rate | CAGR of 13.06% from 2020-2034 |
| Segmentation |
|
Table of Contents
- 1. Introduction
- 1.1. Research Scope
- 1.2. Market Segmentation
- 1.3. Research Objective
- 1.4. Definitions and Assumptions
- 2. Executive Summary
- 2.1. Market Snapshot
- 3. Market Dynamics
- 3.1. Market Drivers
- 3.2. Market Restrains
- 3.3. Market Trends
- 3.4. Market Opportunities
- 4. Market Factor Analysis
- 4.1. Porters Five Forces
- 4.1.1. Bargaining Power of Suppliers
- 4.1.2. Bargaining Power of Buyers
- 4.1.3. Threat of New Entrants
- 4.1.4. Threat of Substitutes
- 4.1.5. Competitive Rivalry
- 4.2. PESTEL analysis
- 4.3. BCG Analysis
- 4.3.1. Stars (High Growth, High Market Share)
- 4.3.2. Cash Cows (Low Growth, High Market Share)
- 4.3.3. Question Mark (High Growth, Low Market Share)
- 4.3.4. Dogs (Low Growth, Low Market Share)
- 4.4. Ansoff Matrix Analysis
- 4.5. Supply Chain Analysis
- 4.6. Regulatory Landscape
- 4.7. Current Market Potential and Opportunity Assessment (TAM–SAM–SOM Framework)
- 4.8. NRP Analyst Note
- 4.1. Porters Five Forces
- 5. Market Analysis, Insights and Forecast 2021-2033
- 5.1. Market Analysis, Insights and Forecast - by Type
- 5.1.1. Dry FGD
- 5.1.2. Wet FGD
- 5.2. Market Analysis, Insights and Forecast - by End-User Industry
- 5.2.1. Power Generation
- 5.2.2. Cement
- 5.2.3. Chemical
- 5.2.4. Iron and Steel
- 5.2.5. Other End-User Industries
- 5.3. Market Analysis, Insights and Forecast - by Region
- 5.3.1. North America
- 5.3.2. Europe
- 5.3.3. Asia Pacific
- 5.3.4. South America
- 5.3.5. Middle East and Africa
- 5.1. Market Analysis, Insights and Forecast - by Type
- 6. Global FGD Systems Industry Analysis, Insights and Forecast, 2021-2033
- 6.1. Market Analysis, Insights and Forecast - by Type
- 6.1.1. Dry FGD
- 6.1.2. Wet FGD
- 6.2. Market Analysis, Insights and Forecast - by End-User Industry
- 6.2.1. Power Generation
- 6.2.2. Cement
- 6.2.3. Chemical
- 6.2.4. Iron and Steel
- 6.2.5. Other End-User Industries
- 6.1. Market Analysis, Insights and Forecast - by Type
- 7. North America FGD Systems Industry Analysis, Insights and Forecast, 2020-2032
- 7.1. Market Analysis, Insights and Forecast - by Type
- 7.1.1. Dry FGD
- 7.1.2. Wet FGD
- 7.2. Market Analysis, Insights and Forecast - by End-User Industry
- 7.2.1. Power Generation
- 7.2.2. Cement
- 7.2.3. Chemical
- 7.2.4. Iron and Steel
- 7.2.5. Other End-User Industries
- 7.1. Market Analysis, Insights and Forecast - by Type
- 8. Europe FGD Systems Industry Analysis, Insights and Forecast, 2020-2032
- 8.1. Market Analysis, Insights and Forecast - by Type
- 8.1.1. Dry FGD
- 8.1.2. Wet FGD
- 8.2. Market Analysis, Insights and Forecast - by End-User Industry
- 8.2.1. Power Generation
- 8.2.2. Cement
- 8.2.3. Chemical
- 8.2.4. Iron and Steel
- 8.2.5. Other End-User Industries
- 8.1. Market Analysis, Insights and Forecast - by Type
- 9. Asia Pacific FGD Systems Industry Analysis, Insights and Forecast, 2020-2032
- 9.1. Market Analysis, Insights and Forecast - by Type
- 9.1.1. Dry FGD
- 9.1.2. Wet FGD
- 9.2. Market Analysis, Insights and Forecast - by End-User Industry
- 9.2.1. Power Generation
- 9.2.2. Cement
- 9.2.3. Chemical
- 9.2.4. Iron and Steel
- 9.2.5. Other End-User Industries
- 9.1. Market Analysis, Insights and Forecast - by Type
- 10. South America FGD Systems Industry Analysis, Insights and Forecast, 2020-2032
- 10.1. Market Analysis, Insights and Forecast - by Type
- 10.1.1. Dry FGD
- 10.1.2. Wet FGD
- 10.2. Market Analysis, Insights and Forecast - by End-User Industry
- 10.2.1. Power Generation
- 10.2.2. Cement
- 10.2.3. Chemical
- 10.2.4. Iron and Steel
- 10.2.5. Other End-User Industries
- 10.1. Market Analysis, Insights and Forecast - by Type
- 11. Middle East and Africa FGD Systems Industry Analysis, Insights and Forecast, 2020-2032
- 11.1. Market Analysis, Insights and Forecast - by Type
- 11.1.1. Dry FGD
- 11.1.2. Wet FGD
- 11.2. Market Analysis, Insights and Forecast - by End-User Industry
- 11.2.1. Power Generation
- 11.2.2. Cement
- 11.2.3. Chemical
- 11.2.4. Iron and Steel
- 11.2.5. Other End-User Industries
- 11.1. Market Analysis, Insights and Forecast - by Type
- 12. Competitive Analysis
- 12.1. Company Profiles
- 12.1.1 Ducon Technologies Inc
- 12.1.1.1. Company Overview
- 12.1.1.2. Products
- 12.1.1.3. Company Financials
- 12.1.1.4. SWOT Analysis
- 12.1.2 Hamon Corporation
- 12.1.2.1. Company Overview
- 12.1.2.2. Products
- 12.1.2.3. Company Financials
- 12.1.2.4. SWOT Analysis
- 12.1.3 Mitsubishi Hitachi Power Systems Ltd
- 12.1.3.1. Company Overview
- 12.1.3.2. Products
- 12.1.3.3. Company Financials
- 12.1.3.4. SWOT Analysis
- 12.1.4 Fujian Longking Co Ltd
- 12.1.4.1. Company Overview
- 12.1.4.2. Products
- 12.1.4.3. Company Financials
- 12.1.4.4. SWOT Analysis
- 12.1.5 Babcock & Wilcox Enterprises Inc
- 12.1.5.1. Company Overview
- 12.1.5.2. Products
- 12.1.5.3. Company Financials
- 12.1.5.4. SWOT Analysis
- 12.1.6 Thermax Ltd*List Not Exhaustive
- 12.1.6.1. Company Overview
- 12.1.6.2. Products
- 12.1.6.3. Company Financials
- 12.1.6.4. SWOT Analysis
- 12.1.7 John Wood Group PLC
- 12.1.7.1. Company Overview
- 12.1.7.2. Products
- 12.1.7.3. Company Financials
- 12.1.7.4. SWOT Analysis
- 12.1.8 Alstom S A
- 12.1.8.1. Company Overview
- 12.1.8.2. Products
- 12.1.8.3. Company Financials
- 12.1.8.4. SWOT Analysis
- 12.1.9 General Electric Company
- 12.1.9.1. Company Overview
- 12.1.9.2. Products
- 12.1.9.3. Company Financials
- 12.1.9.4. SWOT Analysis
- 12.1.10 Andritz AG
- 12.1.10.1. Company Overview
- 12.1.10.2. Products
- 12.1.10.3. Company Financials
- 12.1.10.4. SWOT Analysis
- 12.1.1 Ducon Technologies Inc
- 12.2. Market Entropy
- 12.2.1 Company's Key Areas Served
- 12.2.2 Recent Developments
- 12.3. Company Market Share Analysis 2025
- 12.3.1 Top 5 Companies Market Share Analysis
- 12.3.2 Top 3 Companies Market Share Analysis
- 12.4. List of Potential Customers
- 13. Research Methodology
List of Figures
- Figure 1: Global FGD Systems Industry Revenue Breakdown (billion, %) by Region 2025 & 2033
- Figure 2: North America FGD Systems Industry Revenue (billion), by Type 2025 & 2033
- Figure 3: North America FGD Systems Industry Revenue Share (%), by Type 2025 & 2033
- Figure 4: North America FGD Systems Industry Revenue (billion), by End-User Industry 2025 & 2033
- Figure 5: North America FGD Systems Industry Revenue Share (%), by End-User Industry 2025 & 2033
- Figure 6: North America FGD Systems Industry Revenue (billion), by Country 2025 & 2033
- Figure 7: North America FGD Systems Industry Revenue Share (%), by Country 2025 & 2033
- Figure 8: Europe FGD Systems Industry Revenue (billion), by Type 2025 & 2033
- Figure 9: Europe FGD Systems Industry Revenue Share (%), by Type 2025 & 2033
- Figure 10: Europe FGD Systems Industry Revenue (billion), by End-User Industry 2025 & 2033
- Figure 11: Europe FGD Systems Industry Revenue Share (%), by End-User Industry 2025 & 2033
- Figure 12: Europe FGD Systems Industry Revenue (billion), by Country 2025 & 2033
- Figure 13: Europe FGD Systems Industry Revenue Share (%), by Country 2025 & 2033
- Figure 14: Asia Pacific FGD Systems Industry Revenue (billion), by Type 2025 & 2033
- Figure 15: Asia Pacific FGD Systems Industry Revenue Share (%), by Type 2025 & 2033
- Figure 16: Asia Pacific FGD Systems Industry Revenue (billion), by End-User Industry 2025 & 2033
- Figure 17: Asia Pacific FGD Systems Industry Revenue Share (%), by End-User Industry 2025 & 2033
- Figure 18: Asia Pacific FGD Systems Industry Revenue (billion), by Country 2025 & 2033
- Figure 19: Asia Pacific FGD Systems Industry Revenue Share (%), by Country 2025 & 2033
- Figure 20: South America FGD Systems Industry Revenue (billion), by Type 2025 & 2033
- Figure 21: South America FGD Systems Industry Revenue Share (%), by Type 2025 & 2033
- Figure 22: South America FGD Systems Industry Revenue (billion), by End-User Industry 2025 & 2033
- Figure 23: South America FGD Systems Industry Revenue Share (%), by End-User Industry 2025 & 2033
- Figure 24: South America FGD Systems Industry Revenue (billion), by Country 2025 & 2033
- Figure 25: South America FGD Systems Industry Revenue Share (%), by Country 2025 & 2033
- Figure 26: Middle East and Africa FGD Systems Industry Revenue (billion), by Type 2025 & 2033
- Figure 27: Middle East and Africa FGD Systems Industry Revenue Share (%), by Type 2025 & 2033
- Figure 28: Middle East and Africa FGD Systems Industry Revenue (billion), by End-User Industry 2025 & 2033
- Figure 29: Middle East and Africa FGD Systems Industry Revenue Share (%), by End-User Industry 2025 & 2033
- Figure 30: Middle East and Africa FGD Systems Industry Revenue (billion), by Country 2025 & 2033
- Figure 31: Middle East and Africa FGD Systems Industry Revenue Share (%), by Country 2025 & 2033
List of Tables
- Table 1: Global FGD Systems Industry Revenue billion Forecast, by Type 2020 & 2033
- Table 2: Global FGD Systems Industry Revenue billion Forecast, by End-User Industry 2020 & 2033
- Table 3: Global FGD Systems Industry Revenue billion Forecast, by Region 2020 & 2033
- Table 4: Global FGD Systems Industry Revenue billion Forecast, by Type 2020 & 2033
- Table 5: Global FGD Systems Industry Revenue billion Forecast, by End-User Industry 2020 & 2033
- Table 6: Global FGD Systems Industry Revenue billion Forecast, by Country 2020 & 2033
- Table 7: Global FGD Systems Industry Revenue billion Forecast, by Type 2020 & 2033
- Table 8: Global FGD Systems Industry Revenue billion Forecast, by End-User Industry 2020 & 2033
- Table 9: Global FGD Systems Industry Revenue billion Forecast, by Country 2020 & 2033
- Table 10: Global FGD Systems Industry Revenue billion Forecast, by Type 2020 & 2033
- Table 11: Global FGD Systems Industry Revenue billion Forecast, by End-User Industry 2020 & 2033
- Table 12: Global FGD Systems Industry Revenue billion Forecast, by Country 2020 & 2033
- Table 13: Global FGD Systems Industry Revenue billion Forecast, by Type 2020 & 2033
- Table 14: Global FGD Systems Industry Revenue billion Forecast, by End-User Industry 2020 & 2033
- Table 15: Global FGD Systems Industry Revenue billion Forecast, by Country 2020 & 2033
- Table 16: Global FGD Systems Industry Revenue billion Forecast, by Type 2020 & 2033
- Table 17: Global FGD Systems Industry Revenue billion Forecast, by End-User Industry 2020 & 2033
- Table 18: Global FGD Systems Industry Revenue billion Forecast, by Country 2020 & 2033
Frequently Asked Questions
1. What is the projected Compound Annual Growth Rate (CAGR) of the FGD Systems Industry?
The projected CAGR is approximately 13.06%.
2. Which companies are prominent players in the FGD Systems Industry?
Key companies in the market include Ducon Technologies Inc, Hamon Corporation, Mitsubishi Hitachi Power Systems Ltd, Fujian Longking Co Ltd, Babcock & Wilcox Enterprises Inc, Thermax Ltd*List Not Exhaustive, John Wood Group PLC, Alstom S A, General Electric Company, Andritz AG.
3. What are the main segments of the FGD Systems Industry?
The market segments include Type, End-User Industry.
4. Can you provide details about the market size?
The market size is estimated to be USD 9.55 billion as of 2022.
5. What are some drivers contributing to market growth?
4.; Increasing Industrialization across the World4.; Expansion and Development of New Power Plants.
6. What are the notable trends driving market growth?
Increasing Demand from Power Generation Sector.
7. Are there any restraints impacting market growth?
4.; Increasing Adoption of Renewable Energy.
8. Can you provide examples of recent developments in the market?
N/A
9. What pricing options are available for accessing the report?
Pricing options include single-user, multi-user, and enterprise licenses priced at USD 4750, USD 5250, and USD 8750 respectively.
10. Is the market size provided in terms of value or volume?
The market size is provided in terms of value, measured in billion.
11. Are there any specific market keywords associated with the report?
Yes, the market keyword associated with the report is "FGD Systems Industry," which aids in identifying and referencing the specific market segment covered.
12. How do I determine which pricing option suits my needs best?
The pricing options vary based on user requirements and access needs. Individual users may opt for single-user licenses, while businesses requiring broader access may choose multi-user or enterprise licenses for cost-effective access to the report.
13. Are there any additional resources or data provided in the FGD Systems Industry report?
While the report offers comprehensive insights, it's advisable to review the specific contents or supplementary materials provided to ascertain if additional resources or data are available.
14. How can I stay updated on further developments or reports in the FGD Systems Industry?
To stay informed about further developments, trends, and reports in the FGD Systems Industry, consider subscribing to industry newsletters, following relevant companies and organizations, or regularly checking reputable industry news sources and publications.
Methodology
Step 1 - Identification of Relevant Samples Size from Population Database


Step 2 - Approaches for Defining Global Market Size (Value, Volume* & Price*)

Note*: In applicable scenarios
Step 3 - Data Sources
Primary Research
- Web Analytics
- Survey Reports
- Research Institute
- Latest Research Reports
- Opinion Leaders
Secondary Research
- Annual Reports
- White Paper
- Latest Press Release
- Industry Association
- Paid Database
- Investor Presentations

Step 4 - Data Triangulation
Involves using different sources of information in order to increase the validity of a study
These sources are likely to be stakeholders in a program - participants, other researchers, program staff, other community members, and so on.
Then we put all data in single framework & apply various statistical tools to find out the dynamic on the market.
During the analysis stage, feedback from the stakeholder groups would be compared to determine areas of agreement as well as areas of divergence