

Key Insights
The global heat shield market is projected for significant expansion, propelled by escalating demand for advanced thermal management solutions across automotive and diverse industrial applications. The market is estimated at $5.18 billion in the base year 2025, and is anticipated to grow at a Compound Annual Growth Rate (CAGR) of 5.5% through the forecast period. This upward trend is underpinned by several critical drivers. Increasingly stringent emission standards are mandating the development of more fuel-efficient and environmentally friendly vehicles, thereby increasing the adoption of heat shields to safeguard critical components from high temperatures. The burgeoning electric vehicle (EV) sector presents a substantial growth avenue for heat shield manufacturers, as EVs necessitate sophisticated thermal management systems for optimal battery performance, safety, and longevity. The automotive industry, encompassing both passenger and commercial vehicles, represents a dominant market segment for heat shields, with original equipment manufacturers (OEMs) being key consumers. Concurrently, the aftermarket is also witnessing growth due to rising demand for replacements and repairs.
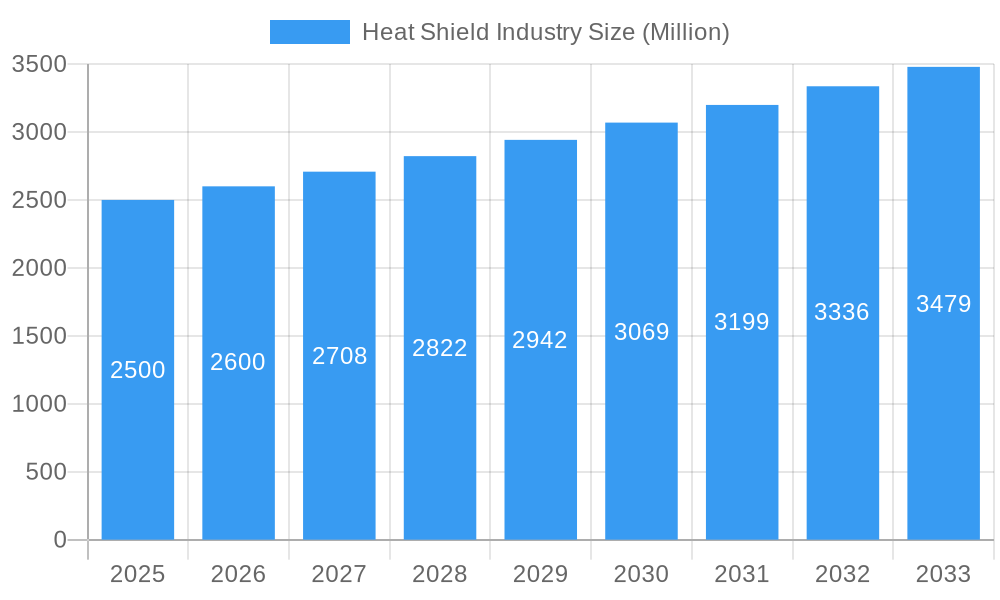
Heat Shield Industry Market Size (In Billion)
Innovations in heat shield materials, yielding lighter, more resilient, and cost-effective products, are further catalyzing market expansion. While challenges such as increasing raw material costs and supply chain volatility persist, the market's overall outlook remains robust. Geographically, North America and Asia Pacific are demonstrating strong growth, driven by substantial automotive manufacturing output and a growing middle-income population with enhanced spending capacity. Europe also holds considerable market share, primarily influenced by stringent environmental legislation. The competitive environment is characterized by a blend of established industry leaders and innovative new entrants, fostering continuous development and market diversification. The projected growth trajectory for the heat shield market indicates sustained expansion, presenting lucrative opportunities for stakeholders across its value chain, including production, distribution, and application.
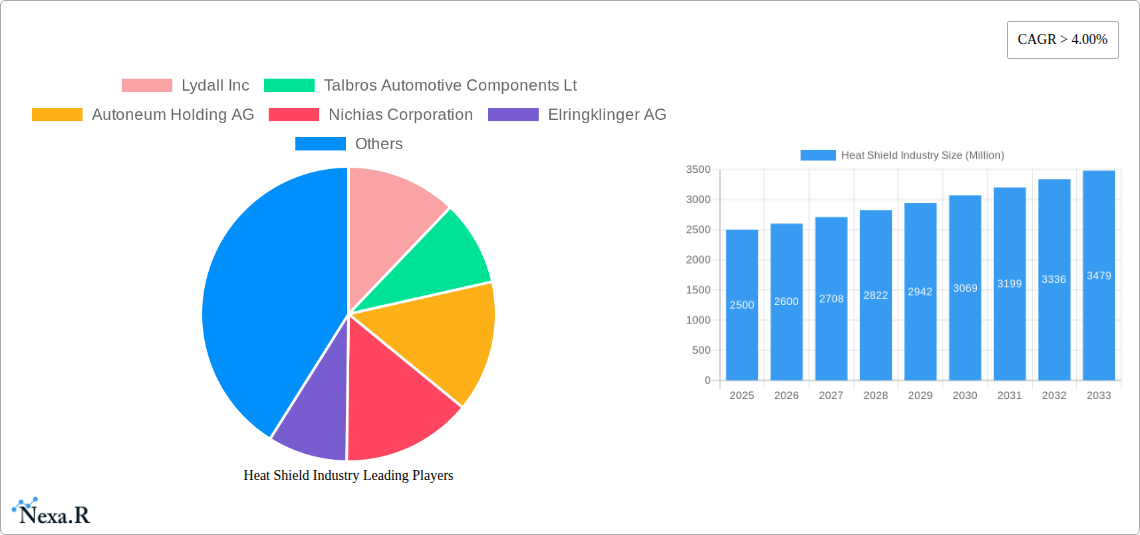
Heat Shield Industry Company Market Share
Heat Shield Industry Market Report: 2019-2033
This comprehensive report provides an in-depth analysis of the global heat shield industry, covering market dynamics, growth trends, regional segmentation, product landscape, key players, and future outlook. With a focus on the parent market (Automotive) and child markets (Passenger Cars, Commercial Vehicles), this report offers invaluable insights for industry professionals, investors, and strategic decision-makers. The study period spans 2019-2033, with a base year of 2025 and a forecast period of 2025-2033.
Heat Shield Industry Market Dynamics & Structure
The heat shield industry is characterized by a moderately concentrated market structure, with key players like Lydall Inc, Talbros Automotive Components Ltd, Autoneum Holding AG, Nichias Corporation, Elringklinger AG, Morgan Advanced Materials, Dana Incorporated, and Federal-Mogul Corporation holding significant market share. Technological innovation, particularly in materials science and manufacturing processes, is a primary growth driver. Stringent emission regulations globally are further pushing the demand for efficient heat shielding solutions. The industry faces competition from alternative thermal management technologies, but advancements in lightweight, high-performance materials continue to expand the market. M&A activity within the sector has been moderate, with xx deals recorded between 2019 and 2024, resulting in a xx% market share consolidation among the top players.
- Market Concentration: Moderately concentrated, with top 8 players holding xx% market share in 2024.
- Innovation Drivers: Lightweight materials, improved thermal performance, enhanced durability.
- Regulatory Framework: Stringent emission standards drive demand for efficient heat shielding.
- Competitive Substitutes: Alternative thermal management technologies pose a moderate threat.
- End-User Demographics: Primarily automotive OEMs and aftermarket suppliers.
- M&A Trends: Moderate activity, with xx deals resulting in xx% market share consolidation (2019-2024).
Heat Shield Industry Growth Trends & Insights
The global heat shield market experienced a CAGR of xx% during the historical period (2019-2024), reaching a market size of xx Million units in 2024. This growth is attributed to the increasing adoption of heat shields in various vehicle types, driven by stricter emission regulations and the rising demand for fuel efficiency and improved performance. The market is expected to continue its growth trajectory, with a projected CAGR of xx% during the forecast period (2025-2033), reaching xx Million units by 2033. Technological advancements, such as the introduction of innovative materials like ZircoFlex SHIELD, are significantly contributing to market expansion. Consumer preference for fuel-efficient vehicles and heightened awareness of environmental concerns further fuels this market growth. Market penetration in developing economies presents a significant opportunity for future expansion.
Dominant Regions, Countries, or Segments in Heat Shield Industry
The Asia Pacific region is currently the dominant market for heat shields, driven by rapid automotive production growth in countries like China and India. Within the segment breakdown, the Engine Compartment segment holds the largest market share, followed by the Exhaust Compartment segment. Passenger cars account for a larger market share than commercial vehicles due to higher production volumes. OEMs dominate the sales channel, representing xx% of the total market.
- Key Drivers (Asia Pacific): Rapid automotive production, increasing disposable income, government support for the automotive industry.
- Engine Compartment Dominance: Highest demand due to critical engine protection requirements.
- Passenger Car Segment: High production volume fuels market dominance.
- OEM Channel Dominance: Direct supply chains with automotive manufacturers.
Heat Shield Industry Product Landscape
The heat shield industry offers a variety of products tailored to specific applications and performance requirements. Innovations focus on reducing weight, improving thermal performance, and enhancing durability. Materials like ceramic fiber, metallic foils, and composite materials are commonly used, each offering unique selling propositions concerning heat resistance, weight, and cost. Recent advancements include the development of lighter and more efficient heat shields, such as ZircoFlex SHIELD, which provides significant improvements in thermal performance with reduced weight and volume.
Key Drivers, Barriers & Challenges in Heat Shield Industry
Key Drivers:
- Rising demand for fuel-efficient vehicles.
- Stringent emission regulations.
- Technological advancements in materials science.
- Growth of the electric vehicle market (requiring advanced thermal management).
Key Challenges:
- Fluctuations in raw material prices.
- Intense competition among established players.
- Stringent quality standards and certifications.
- Supply chain disruptions impacting material availability and costs.
Emerging Opportunities in Heat Shield Industry
Emerging opportunities lie in developing lightweight and high-performance heat shields for electric and hybrid vehicles, leveraging advanced materials and manufacturing techniques. Expanding into untapped markets in developing economies presents substantial growth potential. Furthermore, integrating smart technologies, such as sensors and thermal management systems, into heat shields could open new avenues for value creation.
Growth Accelerators in the Heat Shield Industry Industry
Strategic partnerships between material suppliers and automotive manufacturers are driving growth. Technological breakthroughs in materials science, leading to lighter, more efficient heat shields, are also crucial. Furthermore, expansion into new applications, such as aerospace and industrial sectors, will further accelerate market growth.
Key Players Shaping the Heat Shield Industry Market
- Lydall Inc
- Talbros Automotive Components Ltd
- Autoneum Holding AG
- Nichias Corporation
- Elringklinger AG
- Morgan Advanced Materials
- Dana Incorporated
- Federal-Mogul Corporation
Notable Milestones in Heat Shield Industry Sector
- March 2021: Zircotec launched ZircoFlex SHIELD, offering improved thermal performance with 40% lower weight and 46% lower volume.
- 2021 (Month not specified): DuPont invested USD 30 million in a new manufacturing facility in China for BETAFORCE and BETATECH thermal interface materials for EV battery thermal management.
In-Depth Heat Shield Industry Market Outlook
The future of the heat shield industry appears promising, driven by sustained growth in the automotive sector, particularly in electric and hybrid vehicles. Strategic investments in R&D, focusing on innovative materials and manufacturing processes, will be crucial for maintaining a competitive edge. Expansion into new geographical markets and diversification into related applications present significant opportunities for future growth and market expansion.
Heat Shield Industry Segmentation
-
1. Type
- 1.1. Engine Compartment
- 1.2. Exhaust Compartment
- 1.3. Other Types
-
2. Vehicle Type
- 2.1. Passenger Cars
- 2.2. Commercial Vehicles
-
3. Sales Channel
- 3.1. OEMs
- 3.2. Aftermarket
Heat Shield Industry Segmentation By Geography
-
1. North America
- 1.1. United States
- 1.2. Canada
- 1.3. Rest of North America
-
2. Europe
- 2.1. Germany
- 2.2. United Kingdom
- 2.3. France
- 2.4. Spain
- 2.5. Rest of Europe
-
3. Asia Pacific
- 3.1. India
- 3.2. China
- 3.3. Japan
- 3.4. South Korea
- 3.5. Rest of Asia Pacific
-
4. South America
- 4.1. Brazil
- 4.2. Argentina
- 4.3. Rest of South America
- 5. Middle East
-
6. United Arab Emirates
- 6.1. Saudi Arabia
- 6.2. Rest of Middle East
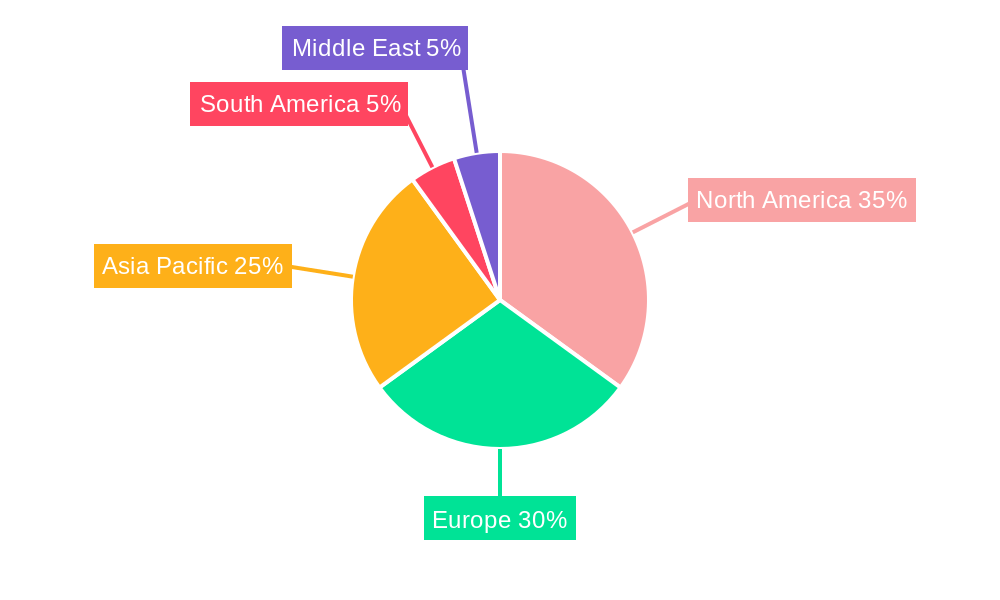
Heat Shield Industry Regional Market Share
Geographic Coverage of Heat Shield Industry
Heat Shield Industry REPORT HIGHLIGHTS
| Aspects | Details |
|---|---|
| Study Period | 2020-2034 |
| Base Year | 2025 |
| Estimated Year | 2026 |
| Forecast Period | 2026-2034 |
| Historical Period | 2020-2025 |
| Growth Rate | CAGR of 5.5% from 2020-2034 |
| Segmentation |
|
Table of Contents
- 1. Introduction
- 1.1. Research Scope
- 1.2. Market Segmentation
- 1.3. Research Objective
- 1.4. Definitions and Assumptions
- 2. Executive Summary
- 2.1. Market Snapshot
- 3. Market Dynamics
- 3.1. Market Drivers
- 3.2. Market Restrains
- 3.3. Market Trends
- 3.4. Market Opportunities
- 4. Market Factor Analysis
- 4.1. Porters Five Forces
- 4.1.1. Bargaining Power of Suppliers
- 4.1.2. Bargaining Power of Buyers
- 4.1.3. Threat of New Entrants
- 4.1.4. Threat of Substitutes
- 4.1.5. Competitive Rivalry
- 4.2. PESTEL analysis
- 4.3. BCG Analysis
- 4.3.1. Stars (High Growth, High Market Share)
- 4.3.2. Cash Cows (Low Growth, High Market Share)
- 4.3.3. Question Mark (High Growth, Low Market Share)
- 4.3.4. Dogs (Low Growth, Low Market Share)
- 4.4. Ansoff Matrix Analysis
- 4.5. Supply Chain Analysis
- 4.6. Regulatory Landscape
- 4.7. Current Market Potential and Opportunity Assessment (TAM–SAM–SOM Framework)
- 4.8. NRP Analyst Note
- 4.1. Porters Five Forces
- 5. Market Analysis, Insights and Forecast 2021-2033
- 5.1. Market Analysis, Insights and Forecast - by Type
- 5.1.1. Engine Compartment
- 5.1.2. Exhaust Compartment
- 5.1.3. Other Types
- 5.2. Market Analysis, Insights and Forecast - by Vehicle Type
- 5.2.1. Passenger Cars
- 5.2.2. Commercial Vehicles
- 5.3. Market Analysis, Insights and Forecast - by Sales Channel
- 5.3.1. OEMs
- 5.3.2. Aftermarket
- 5.4. Market Analysis, Insights and Forecast - by Region
- 5.4.1. North America
- 5.4.2. Europe
- 5.4.3. Asia Pacific
- 5.4.4. South America
- 5.4.5. Middle East
- 5.4.6. United Arab Emirates
- 5.1. Market Analysis, Insights and Forecast - by Type
- 6. Global Heat Shield Industry Analysis, Insights and Forecast, 2021-2033
- 6.1. Market Analysis, Insights and Forecast - by Type
- 6.1.1. Engine Compartment
- 6.1.2. Exhaust Compartment
- 6.1.3. Other Types
- 6.2. Market Analysis, Insights and Forecast - by Vehicle Type
- 6.2.1. Passenger Cars
- 6.2.2. Commercial Vehicles
- 6.3. Market Analysis, Insights and Forecast - by Sales Channel
- 6.3.1. OEMs
- 6.3.2. Aftermarket
- 6.1. Market Analysis, Insights and Forecast - by Type
- 7. North America Heat Shield Industry Analysis, Insights and Forecast, 2020-2032
- 7.1. Market Analysis, Insights and Forecast - by Type
- 7.1.1. Engine Compartment
- 7.1.2. Exhaust Compartment
- 7.1.3. Other Types
- 7.2. Market Analysis, Insights and Forecast - by Vehicle Type
- 7.2.1. Passenger Cars
- 7.2.2. Commercial Vehicles
- 7.3. Market Analysis, Insights and Forecast - by Sales Channel
- 7.3.1. OEMs
- 7.3.2. Aftermarket
- 7.1. Market Analysis, Insights and Forecast - by Type
- 8. Europe Heat Shield Industry Analysis, Insights and Forecast, 2020-2032
- 8.1. Market Analysis, Insights and Forecast - by Type
- 8.1.1. Engine Compartment
- 8.1.2. Exhaust Compartment
- 8.1.3. Other Types
- 8.2. Market Analysis, Insights and Forecast - by Vehicle Type
- 8.2.1. Passenger Cars
- 8.2.2. Commercial Vehicles
- 8.3. Market Analysis, Insights and Forecast - by Sales Channel
- 8.3.1. OEMs
- 8.3.2. Aftermarket
- 8.1. Market Analysis, Insights and Forecast - by Type
- 9. Asia Pacific Heat Shield Industry Analysis, Insights and Forecast, 2020-2032
- 9.1. Market Analysis, Insights and Forecast - by Type
- 9.1.1. Engine Compartment
- 9.1.2. Exhaust Compartment
- 9.1.3. Other Types
- 9.2. Market Analysis, Insights and Forecast - by Vehicle Type
- 9.2.1. Passenger Cars
- 9.2.2. Commercial Vehicles
- 9.3. Market Analysis, Insights and Forecast - by Sales Channel
- 9.3.1. OEMs
- 9.3.2. Aftermarket
- 9.1. Market Analysis, Insights and Forecast - by Type
- 10. South America Heat Shield Industry Analysis, Insights and Forecast, 2020-2032
- 10.1. Market Analysis, Insights and Forecast - by Type
- 10.1.1. Engine Compartment
- 10.1.2. Exhaust Compartment
- 10.1.3. Other Types
- 10.2. Market Analysis, Insights and Forecast - by Vehicle Type
- 10.2.1. Passenger Cars
- 10.2.2. Commercial Vehicles
- 10.3. Market Analysis, Insights and Forecast - by Sales Channel
- 10.3.1. OEMs
- 10.3.2. Aftermarket
- 10.1. Market Analysis, Insights and Forecast - by Type
- 11. Middle East Heat Shield Industry Analysis, Insights and Forecast, 2020-2032
- 11.1. Market Analysis, Insights and Forecast - by Type
- 11.1.1. Engine Compartment
- 11.1.2. Exhaust Compartment
- 11.1.3. Other Types
- 11.2. Market Analysis, Insights and Forecast - by Vehicle Type
- 11.2.1. Passenger Cars
- 11.2.2. Commercial Vehicles
- 11.3. Market Analysis, Insights and Forecast - by Sales Channel
- 11.3.1. OEMs
- 11.3.2. Aftermarket
- 11.1. Market Analysis, Insights and Forecast - by Type
- 12. United Arab Emirates Heat Shield Industry Analysis, Insights and Forecast, 2020-2032
- 12.1. Market Analysis, Insights and Forecast - by Type
- 12.1.1. Engine Compartment
- 12.1.2. Exhaust Compartment
- 12.1.3. Other Types
- 12.2. Market Analysis, Insights and Forecast - by Vehicle Type
- 12.2.1. Passenger Cars
- 12.2.2. Commercial Vehicles
- 12.3. Market Analysis, Insights and Forecast - by Sales Channel
- 12.3.1. OEMs
- 12.3.2. Aftermarket
- 12.1. Market Analysis, Insights and Forecast - by Type
- 13. Competitive Analysis
- 13.1. Company Profiles
- 13.1.1 Lydall Inc
- 13.1.1.1. Company Overview
- 13.1.1.2. Products
- 13.1.1.3. Company Financials
- 13.1.1.4. SWOT Analysis
- 13.1.2 Talbros Automotive Components Lt
- 13.1.2.1. Company Overview
- 13.1.2.2. Products
- 13.1.2.3. Company Financials
- 13.1.2.4. SWOT Analysis
- 13.1.3 Autoneum Holding AG
- 13.1.3.1. Company Overview
- 13.1.3.2. Products
- 13.1.3.3. Company Financials
- 13.1.3.4. SWOT Analysis
- 13.1.4 Nichias Corporation
- 13.1.4.1. Company Overview
- 13.1.4.2. Products
- 13.1.4.3. Company Financials
- 13.1.4.4. SWOT Analysis
- 13.1.5 Elringklinger AG
- 13.1.5.1. Company Overview
- 13.1.5.2. Products
- 13.1.5.3. Company Financials
- 13.1.5.4. SWOT Analysis
- 13.1.6 Morgan Advanced Materials
- 13.1.6.1. Company Overview
- 13.1.6.2. Products
- 13.1.6.3. Company Financials
- 13.1.6.4. SWOT Analysis
- 13.1.7 Dana Incorporated
- 13.1.7.1. Company Overview
- 13.1.7.2. Products
- 13.1.7.3. Company Financials
- 13.1.7.4. SWOT Analysis
- 13.1.8 Federal-Mogul Corporation
- 13.1.8.1. Company Overview
- 13.1.8.2. Products
- 13.1.8.3. Company Financials
- 13.1.8.4. SWOT Analysis
- 13.1.1 Lydall Inc
- 13.2. Market Entropy
- 13.2.1 Company's Key Areas Served
- 13.2.2 Recent Developments
- 13.3. Company Market Share Analysis 2025
- 13.3.1 Top 5 Companies Market Share Analysis
- 13.3.2 Top 3 Companies Market Share Analysis
- 13.4. List of Potential Customers
- 14. Research Methodology
List of Figures
- Figure 1: Global Heat Shield Industry Revenue Breakdown (billion, %) by Region 2025 & 2033
- Figure 2: North America Heat Shield Industry Revenue (billion), by Type 2025 & 2033
- Figure 3: North America Heat Shield Industry Revenue Share (%), by Type 2025 & 2033
- Figure 4: North America Heat Shield Industry Revenue (billion), by Vehicle Type 2025 & 2033
- Figure 5: North America Heat Shield Industry Revenue Share (%), by Vehicle Type 2025 & 2033
- Figure 6: North America Heat Shield Industry Revenue (billion), by Sales Channel 2025 & 2033
- Figure 7: North America Heat Shield Industry Revenue Share (%), by Sales Channel 2025 & 2033
- Figure 8: North America Heat Shield Industry Revenue (billion), by Country 2025 & 2033
- Figure 9: North America Heat Shield Industry Revenue Share (%), by Country 2025 & 2033
- Figure 10: Europe Heat Shield Industry Revenue (billion), by Type 2025 & 2033
- Figure 11: Europe Heat Shield Industry Revenue Share (%), by Type 2025 & 2033
- Figure 12: Europe Heat Shield Industry Revenue (billion), by Vehicle Type 2025 & 2033
- Figure 13: Europe Heat Shield Industry Revenue Share (%), by Vehicle Type 2025 & 2033
- Figure 14: Europe Heat Shield Industry Revenue (billion), by Sales Channel 2025 & 2033
- Figure 15: Europe Heat Shield Industry Revenue Share (%), by Sales Channel 2025 & 2033
- Figure 16: Europe Heat Shield Industry Revenue (billion), by Country 2025 & 2033
- Figure 17: Europe Heat Shield Industry Revenue Share (%), by Country 2025 & 2033
- Figure 18: Asia Pacific Heat Shield Industry Revenue (billion), by Type 2025 & 2033
- Figure 19: Asia Pacific Heat Shield Industry Revenue Share (%), by Type 2025 & 2033
- Figure 20: Asia Pacific Heat Shield Industry Revenue (billion), by Vehicle Type 2025 & 2033
- Figure 21: Asia Pacific Heat Shield Industry Revenue Share (%), by Vehicle Type 2025 & 2033
- Figure 22: Asia Pacific Heat Shield Industry Revenue (billion), by Sales Channel 2025 & 2033
- Figure 23: Asia Pacific Heat Shield Industry Revenue Share (%), by Sales Channel 2025 & 2033
- Figure 24: Asia Pacific Heat Shield Industry Revenue (billion), by Country 2025 & 2033
- Figure 25: Asia Pacific Heat Shield Industry Revenue Share (%), by Country 2025 & 2033
- Figure 26: South America Heat Shield Industry Revenue (billion), by Type 2025 & 2033
- Figure 27: South America Heat Shield Industry Revenue Share (%), by Type 2025 & 2033
- Figure 28: South America Heat Shield Industry Revenue (billion), by Vehicle Type 2025 & 2033
- Figure 29: South America Heat Shield Industry Revenue Share (%), by Vehicle Type 2025 & 2033
- Figure 30: South America Heat Shield Industry Revenue (billion), by Sales Channel 2025 & 2033
- Figure 31: South America Heat Shield Industry Revenue Share (%), by Sales Channel 2025 & 2033
- Figure 32: South America Heat Shield Industry Revenue (billion), by Country 2025 & 2033
- Figure 33: South America Heat Shield Industry Revenue Share (%), by Country 2025 & 2033
- Figure 34: Middle East Heat Shield Industry Revenue (billion), by Type 2025 & 2033
- Figure 35: Middle East Heat Shield Industry Revenue Share (%), by Type 2025 & 2033
- Figure 36: Middle East Heat Shield Industry Revenue (billion), by Vehicle Type 2025 & 2033
- Figure 37: Middle East Heat Shield Industry Revenue Share (%), by Vehicle Type 2025 & 2033
- Figure 38: Middle East Heat Shield Industry Revenue (billion), by Sales Channel 2025 & 2033
- Figure 39: Middle East Heat Shield Industry Revenue Share (%), by Sales Channel 2025 & 2033
- Figure 40: Middle East Heat Shield Industry Revenue (billion), by Country 2025 & 2033
- Figure 41: Middle East Heat Shield Industry Revenue Share (%), by Country 2025 & 2033
- Figure 42: United Arab Emirates Heat Shield Industry Revenue (billion), by Type 2025 & 2033
- Figure 43: United Arab Emirates Heat Shield Industry Revenue Share (%), by Type 2025 & 2033
- Figure 44: United Arab Emirates Heat Shield Industry Revenue (billion), by Vehicle Type 2025 & 2033
- Figure 45: United Arab Emirates Heat Shield Industry Revenue Share (%), by Vehicle Type 2025 & 2033
- Figure 46: United Arab Emirates Heat Shield Industry Revenue (billion), by Sales Channel 2025 & 2033
- Figure 47: United Arab Emirates Heat Shield Industry Revenue Share (%), by Sales Channel 2025 & 2033
- Figure 48: United Arab Emirates Heat Shield Industry Revenue (billion), by Country 2025 & 2033
- Figure 49: United Arab Emirates Heat Shield Industry Revenue Share (%), by Country 2025 & 2033
List of Tables
- Table 1: Global Heat Shield Industry Revenue billion Forecast, by Type 2020 & 2033
- Table 2: Global Heat Shield Industry Revenue billion Forecast, by Vehicle Type 2020 & 2033
- Table 3: Global Heat Shield Industry Revenue billion Forecast, by Sales Channel 2020 & 2033
- Table 4: Global Heat Shield Industry Revenue billion Forecast, by Region 2020 & 2033
- Table 5: Global Heat Shield Industry Revenue billion Forecast, by Type 2020 & 2033
- Table 6: Global Heat Shield Industry Revenue billion Forecast, by Vehicle Type 2020 & 2033
- Table 7: Global Heat Shield Industry Revenue billion Forecast, by Sales Channel 2020 & 2033
- Table 8: Global Heat Shield Industry Revenue billion Forecast, by Country 2020 & 2033
- Table 9: United States Heat Shield Industry Revenue (billion) Forecast, by Application 2020 & 2033
- Table 10: Canada Heat Shield Industry Revenue (billion) Forecast, by Application 2020 & 2033
- Table 11: Rest of North America Heat Shield Industry Revenue (billion) Forecast, by Application 2020 & 2033
- Table 12: Global Heat Shield Industry Revenue billion Forecast, by Type 2020 & 2033
- Table 13: Global Heat Shield Industry Revenue billion Forecast, by Vehicle Type 2020 & 2033
- Table 14: Global Heat Shield Industry Revenue billion Forecast, by Sales Channel 2020 & 2033
- Table 15: Global Heat Shield Industry Revenue billion Forecast, by Country 2020 & 2033
- Table 16: Germany Heat Shield Industry Revenue (billion) Forecast, by Application 2020 & 2033
- Table 17: United Kingdom Heat Shield Industry Revenue (billion) Forecast, by Application 2020 & 2033
- Table 18: France Heat Shield Industry Revenue (billion) Forecast, by Application 2020 & 2033
- Table 19: Spain Heat Shield Industry Revenue (billion) Forecast, by Application 2020 & 2033
- Table 20: Rest of Europe Heat Shield Industry Revenue (billion) Forecast, by Application 2020 & 2033
- Table 21: Global Heat Shield Industry Revenue billion Forecast, by Type 2020 & 2033
- Table 22: Global Heat Shield Industry Revenue billion Forecast, by Vehicle Type 2020 & 2033
- Table 23: Global Heat Shield Industry Revenue billion Forecast, by Sales Channel 2020 & 2033
- Table 24: Global Heat Shield Industry Revenue billion Forecast, by Country 2020 & 2033
- Table 25: India Heat Shield Industry Revenue (billion) Forecast, by Application 2020 & 2033
- Table 26: China Heat Shield Industry Revenue (billion) Forecast, by Application 2020 & 2033
- Table 27: Japan Heat Shield Industry Revenue (billion) Forecast, by Application 2020 & 2033
- Table 28: South Korea Heat Shield Industry Revenue (billion) Forecast, by Application 2020 & 2033
- Table 29: Rest of Asia Pacific Heat Shield Industry Revenue (billion) Forecast, by Application 2020 & 2033
- Table 30: Global Heat Shield Industry Revenue billion Forecast, by Type 2020 & 2033
- Table 31: Global Heat Shield Industry Revenue billion Forecast, by Vehicle Type 2020 & 2033
- Table 32: Global Heat Shield Industry Revenue billion Forecast, by Sales Channel 2020 & 2033
- Table 33: Global Heat Shield Industry Revenue billion Forecast, by Country 2020 & 2033
- Table 34: Brazil Heat Shield Industry Revenue (billion) Forecast, by Application 2020 & 2033
- Table 35: Argentina Heat Shield Industry Revenue (billion) Forecast, by Application 2020 & 2033
- Table 36: Rest of South America Heat Shield Industry Revenue (billion) Forecast, by Application 2020 & 2033
- Table 37: Global Heat Shield Industry Revenue billion Forecast, by Type 2020 & 2033
- Table 38: Global Heat Shield Industry Revenue billion Forecast, by Vehicle Type 2020 & 2033
- Table 39: Global Heat Shield Industry Revenue billion Forecast, by Sales Channel 2020 & 2033
- Table 40: Global Heat Shield Industry Revenue billion Forecast, by Country 2020 & 2033
- Table 41: Global Heat Shield Industry Revenue billion Forecast, by Type 2020 & 2033
- Table 42: Global Heat Shield Industry Revenue billion Forecast, by Vehicle Type 2020 & 2033
- Table 43: Global Heat Shield Industry Revenue billion Forecast, by Sales Channel 2020 & 2033
- Table 44: Global Heat Shield Industry Revenue billion Forecast, by Country 2020 & 2033
- Table 45: Saudi Arabia Heat Shield Industry Revenue (billion) Forecast, by Application 2020 & 2033
- Table 46: Rest of Middle East Heat Shield Industry Revenue (billion) Forecast, by Application 2020 & 2033
Frequently Asked Questions
1. What is the projected Compound Annual Growth Rate (CAGR) of the Heat Shield Industry?
The projected CAGR is approximately 5.5%.
2. Which companies are prominent players in the Heat Shield Industry?
Key companies in the market include Lydall Inc, Talbros Automotive Components Lt, Autoneum Holding AG, Nichias Corporation, Elringklinger AG, Morgan Advanced Materials, Dana Incorporated, Federal-Mogul Corporation.
3. What are the main segments of the Heat Shield Industry?
The market segments include Type, Vehicle Type, Sales Channel.
4. Can you provide details about the market size?
The market size is estimated to be USD 5.18 billion as of 2022.
5. What are some drivers contributing to market growth?
Rising Demand for Small Boats; Expanding Recreational Boating Opportunities.
6. What are the notable trends driving market growth?
High Cost of Heat Shield in Aftermarket and Increasing Electric Vehicle Sales Restraining the Market Growth.
7. Are there any restraints impacting market growth?
Strict Emission Norms for Recreation Boats Likely to Have Negative Impact.
8. Can you provide examples of recent developments in the market?
In March 2021, Zircotec launched ZircoFlex SHIELD. ZircoFlex SHIELD reportedly achieves better thermal performance at 40% lower weight and 46% lower volume than competing heat-shield products.
9. What pricing options are available for accessing the report?
Pricing options include single-user, multi-user, and enterprise licenses priced at USD 4750, USD 5250, and USD 8750 respectively.
10. Is the market size provided in terms of value or volume?
The market size is provided in terms of value, measured in billion.
11. Are there any specific market keywords associated with the report?
Yes, the market keyword associated with the report is "Heat Shield Industry," which aids in identifying and referencing the specific market segment covered.
12. How do I determine which pricing option suits my needs best?
The pricing options vary based on user requirements and access needs. Individual users may opt for single-user licenses, while businesses requiring broader access may choose multi-user or enterprise licenses for cost-effective access to the report.
13. Are there any additional resources or data provided in the Heat Shield Industry report?
While the report offers comprehensive insights, it's advisable to review the specific contents or supplementary materials provided to ascertain if additional resources or data are available.
14. How can I stay updated on further developments or reports in the Heat Shield Industry?
To stay informed about further developments, trends, and reports in the Heat Shield Industry, consider subscribing to industry newsletters, following relevant companies and organizations, or regularly checking reputable industry news sources and publications.
Methodology
Step 1 - Identification of Relevant Samples Size from Population Database


Step 2 - Approaches for Defining Global Market Size (Value, Volume* & Price*)

Note*: In applicable scenarios
Step 3 - Data Sources
Primary Research
- Web Analytics
- Survey Reports
- Research Institute
- Latest Research Reports
- Opinion Leaders
Secondary Research
- Annual Reports
- White Paper
- Latest Press Release
- Industry Association
- Paid Database
- Investor Presentations

Step 4 - Data Triangulation
Involves using different sources of information in order to increase the validity of a study
These sources are likely to be stakeholders in a program - participants, other researchers, program staff, other community members, and so on.
Then we put all data in single framework & apply various statistical tools to find out the dynamic on the market.
During the analysis stage, feedback from the stakeholder groups would be compared to determine areas of agreement as well as areas of divergence