

Key Insights
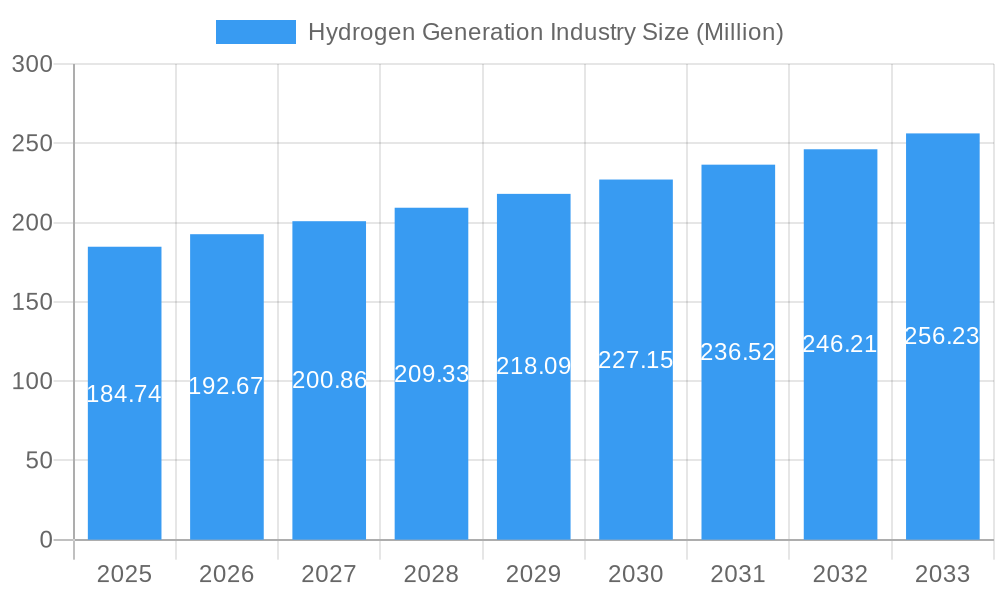
The hydrogen generation industry is experiencing robust growth, projected to reach a market size of $184.74 million in 2025 and expand at a compound annual growth rate (CAGR) of 4.23% from 2025 to 2033. Several factors fuel this expansion. Increasing government support for renewable energy initiatives, driven by the urgent need to reduce carbon emissions and mitigate climate change, is a primary driver. The rising adoption of hydrogen fuel cells in transportation and the burgeoning demand for hydrogen in industrial applications, particularly oil refining and chemical processing, further contribute to market growth. Technological advancements, including improvements in electrolysis efficiency for green hydrogen production and cost reductions in steam methane reforming, are also making hydrogen a more economically viable energy carrier. However, the market faces challenges such as the high initial investment costs associated with hydrogen production infrastructure and the intermittent nature of renewable energy sources used in green hydrogen production. Furthermore, ensuring safe and efficient hydrogen storage and transportation remains a critical hurdle to overcome for widespread adoption. The market is segmented by hydrogen type (blue, green, grey), production technology (steam methane reforming, coal gasification, others), and application (oil refining, chemical processing, iron & steel, others). Geographic distribution reveals strong growth potential across North America, Europe, and the Asia-Pacific region, driven by differing levels of renewable energy penetration and industrial hydrogen demand. Competition is intense, with major players including McPhy Energy, Engie SA, Taiyo Nippon Sanso, and Air Liquide vying for market share.
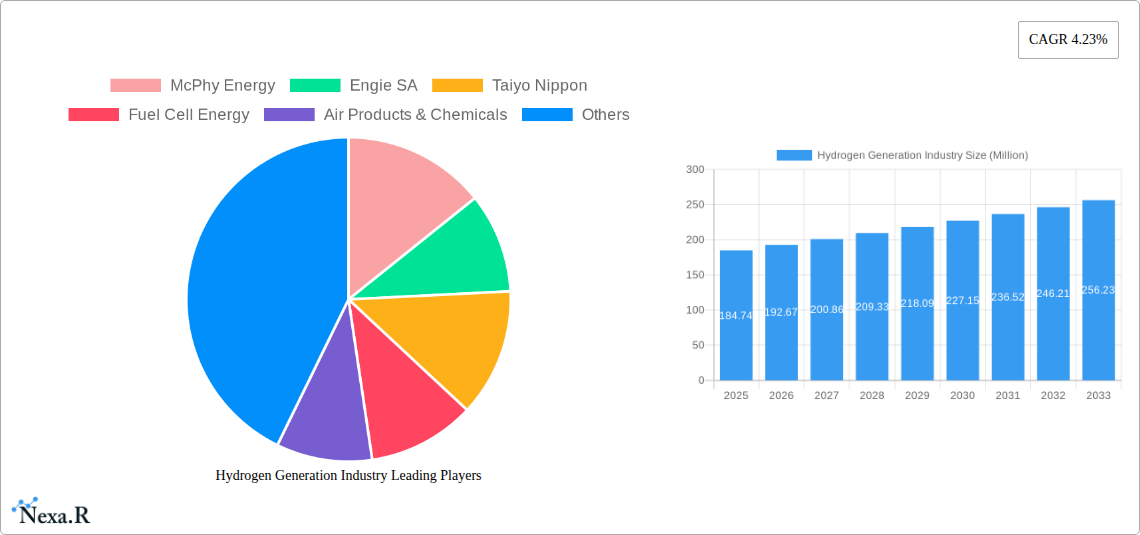
Hydrogen Generation Industry Market Size (In Million)
The forecast period of 2025-2033 presents significant opportunities for industry players to capitalize on the growing demand for hydrogen. Strategic partnerships, technological innovations, and efficient supply chain management will be crucial for success. Furthermore, addressing the challenges related to cost reduction, safety, and infrastructure development is essential to unlock the full potential of the hydrogen generation market. The shift towards cleaner energy sources will continue to drive demand, making investments in the industry increasingly attractive. The ongoing research and development efforts focused on improving the efficiency and reducing the cost of hydrogen production will be key to sustaining the market’s impressive growth trajectory. Focus on developing sustainable and environmentally friendly hydrogen production methods will play a pivotal role in shaping the future landscape of the industry.
Hydrogen Generation Industry Company Market Share
Hydrogen Generation Industry Market Report: 2019-2033
This comprehensive report provides a detailed analysis of the Hydrogen Generation Industry, encompassing market dynamics, growth trends, regional analysis, product landscape, and key players. With a study period spanning 2019-2033, a base year of 2025, and a forecast period of 2025-2033, this report is an indispensable resource for industry professionals, investors, and strategists seeking to navigate this rapidly evolving sector. The report analyzes the parent market of renewable energy and its child market, hydrogen generation, to offer a complete overview.
Hydrogen Generation Industry Market Dynamics & Structure
The hydrogen generation market is characterized by a moderately concentrated landscape, with several major players holding significant market share. The market is driven by technological innovations in electrolysis and reforming technologies, coupled with supportive government policies and regulations aimed at reducing carbon emissions. However, high capital costs, infrastructure limitations, and the availability of alternative energy sources pose challenges. Mergers and acquisitions are frequent, reflecting the consolidation within the industry and the quest for technological advancements.
- Market Concentration: The top 10 players account for approximately XX% of the global market in 2025.
- Technological Innovation: Significant advancements in PEM electrolysis and alkaline electrolysis are driving down costs and improving efficiency.
- Regulatory Framework: Government incentives and carbon pricing mechanisms are stimulating market growth, while safety regulations influence technology adoption.
- Competitive Substitutes: Natural gas and other fossil fuels remain significant competitors, although their dominance is expected to decline.
- End-User Demographics: The primary end-users are the oil refining, chemical processing, and iron & steel production sectors.
- M&A Trends: The number of M&A deals in the hydrogen generation industry reached XX in 2024, primarily focused on technology acquisition and market expansion.
Hydrogen Generation Industry Growth Trends & Insights
The hydrogen generation market is experiencing robust growth, driven by the increasing demand for clean energy and the urgent need to decarbonize various industries. The market size is projected to expand from XX million in 2025 to XX million by 2033, exhibiting a CAGR of XX%. This growth is fueled by rising investments in renewable energy sources, technological advancements leading to cost reductions, and stringent environmental regulations. Consumer behavior is shifting towards sustainable practices, further bolstering the demand for green hydrogen. Adoption rates are increasing across various sectors, with the early adoption being observed in the chemical and oil refining industries. Disruptive technologies, such as solid oxide electrolysis, are poised to further accelerate market expansion in the forecast period.
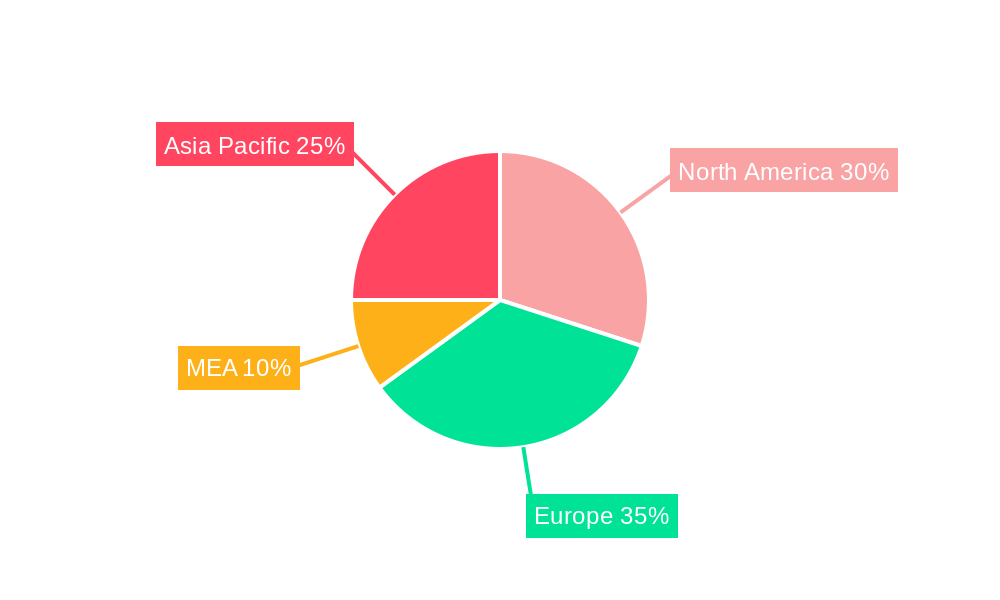
Dominant Regions, Countries, or Segments in Hydrogen Generation Industry
Europe and North America currently dominate the hydrogen generation market, driven by strong government support, significant investments in renewable energy infrastructure, and a robust industrial base. However, Asia Pacific is poised for rapid growth, fueled by increasing industrialization and a growing emphasis on clean energy initiatives. Within the segments, green hydrogen is experiencing the fastest growth, driven by environmental concerns and government policies.
- Leading Region: Europe holds the largest market share in 2025, accounting for approximately XX%.
- Fastest-Growing Region: Asia Pacific is projected to exhibit the highest CAGR during the forecast period (XX%).
- Dominant Source: Grey hydrogen currently holds the largest market share, but green hydrogen's share is projected to increase significantly by 2033.
- Dominant Technology: Steam Methane Reforming (SMR) is the dominant technology in 2025 due to its established infrastructure, but electrolysis technologies are gaining traction.
- Dominant Application: Oil refining is the largest application segment in 2025, while chemical processing and steel production are also significant.
Hydrogen Generation Industry Product Landscape
The hydrogen generation industry offers a variety of products, including electrolyzers (alkaline, PEM, SOEC), reformers (SMR, coal gasification), and related equipment for purification and storage. Technological advancements are focused on improving efficiency, reducing costs, and enhancing scalability. Unique selling propositions include higher purity levels, reduced energy consumption, and enhanced durability.
Key Drivers, Barriers & Challenges in Hydrogen Generation Industry
Key Drivers:
- Increasing government regulations to curb carbon emissions.
- Rising demand for clean energy across various industries.
- Technological advancements leading to cost reductions and improved efficiency.
Challenges:
- High capital costs associated with hydrogen production technologies.
- Limited infrastructure for hydrogen storage and transportation.
- Competition from established fossil fuel-based energy sources. The shift from grey to green hydrogen is also significantly impacted by the overall energy cost. If electricity prices remain high, the economics of green hydrogen become less competitive.
Emerging Opportunities in Hydrogen Generation Industry
- Growing demand for green hydrogen in transportation and energy storage.
- Development of innovative applications in sectors such as ammonia production and power generation.
- Expansion into emerging markets with substantial renewable energy potential.
Growth Accelerators in the Hydrogen Generation Industry
Technological breakthroughs, including advancements in electrolysis and fuel cell technology, are significant growth catalysts. Strategic partnerships between energy companies, technology providers, and end-users are driving innovation and market expansion. Government policies, such as tax credits and subsidies, are further accelerating the adoption of hydrogen generation technologies.
Key Players Shaping the Hydrogen Generation Industry Market
- McPhy Energy
- Engie SA
- Taiyo Nippon Sanso
- Fuel Cell Energy
- Air Products & Chemicals
- Linde plc
- Cummins
- Messer Group GmbH
- Air Liquide
- ITM Power plc
- Enapter
Notable Milestones in Hydrogen Generation Industry Sector
- October 2023: H2B2 unveils the SoHyCal green hydrogen plant in Fresno, California, utilizing PEM technology.
- October 2023: Hygenco Green Energies announces plans for a green hydrogen plant in Maharashtra, India, supplying green hydrogen and oxygen to Sterlite Technologies Ltd.
- May 2023: RWE and Westfalen Group announce plans to develop up to 70 hydrogen stations in Germany by 2030.
In-Depth Hydrogen Generation Industry Market Outlook
The hydrogen generation market is poised for significant expansion in the coming years, driven by the increasing urgency to decarbonize various industries and the growing availability of renewable energy sources. Strategic partnerships, technological advancements, and supportive government policies will further accelerate market growth. The focus on green hydrogen production, coupled with advancements in storage and transportation technologies, will unlock new market opportunities and create a sustainable energy future. The market is expected to witness continued consolidation through mergers and acquisitions, further shaping the industry landscape.
Hydrogen Generation Industry Segmentation
-
1. Source
- 1.1. Blue hydrogen
- 1.2. Green hydrogen
- 1.3. Grey Hydrogen
-
2. Technology
- 2.1. Steam Methane Reforming (SMR)
- 2.2. Coal Gasification
- 2.3. Other Technologies
-
3. Application
- 3.1. Oil Refining
- 3.2. Chemical Processing
- 3.3. Iron & Steel Production
- 3.4. Other Applications
Hydrogen Generation Industry Segmentation By Geography
-
1. North America
- 1.1. United States
- 1.2. Canada
- 1.3. Rest of North America
-
2. Europe
- 2.1. Germany
- 2.2. France
- 2.3. Italy
- 2.4. United Kingdom
- 2.5. Russian Federation
- 2.6. Rest of Europe
- 3. Middle East
-
4. Saudi Arabia
- 4.1. United Arab Emirates
- 4.2. South Africa
- 4.3. Rest of Middle East and Africa
-
5. Asia Pacific
- 5.1. China
- 5.2. India
- 5.3. Japan
- 5.4. South Korea
- 5.5. Rest of Asia Pacific
-
6. South America
- 6.1. Brazil
- 6.2. Argentina
- 6.3. Rest of South America
Hydrogen Generation Industry Regional Market Share
Geographic Coverage of Hydrogen Generation Industry
Hydrogen Generation Industry REPORT HIGHLIGHTS
| Aspects | Details |
|---|---|
| Study Period | 2020-2034 |
| Base Year | 2025 |
| Estimated Year | 2026 |
| Forecast Period | 2026-2034 |
| Historical Period | 2020-2025 |
| Growth Rate | CAGR of 4.23% from 2020-2034 |
| Segmentation |
|
Table of Contents
- 1. Introduction
- 1.1. Research Scope
- 1.2. Market Segmentation
- 1.3. Research Objective
- 1.4. Definitions and Assumptions
- 2. Executive Summary
- 2.1. Market Snapshot
- 3. Market Dynamics
- 3.1. Market Drivers
- 3.2. Market Restrains
- 3.3. Market Trends
- 3.4. Market Opportunities
- 4. Market Factor Analysis
- 4.1. Porters Five Forces
- 4.1.1. Bargaining Power of Suppliers
- 4.1.2. Bargaining Power of Buyers
- 4.1.3. Threat of New Entrants
- 4.1.4. Threat of Substitutes
- 4.1.5. Competitive Rivalry
- 4.2. PESTEL analysis
- 4.3. BCG Analysis
- 4.3.1. Stars (High Growth, High Market Share)
- 4.3.2. Cash Cows (Low Growth, High Market Share)
- 4.3.3. Question Mark (High Growth, Low Market Share)
- 4.3.4. Dogs (Low Growth, Low Market Share)
- 4.4. Ansoff Matrix Analysis
- 4.5. Supply Chain Analysis
- 4.6. Regulatory Landscape
- 4.7. Current Market Potential and Opportunity Assessment (TAM–SAM–SOM Framework)
- 4.8. NRP Analyst Note
- 4.1. Porters Five Forces
- 5. Market Analysis, Insights and Forecast 2021-2033
- 5.1. Market Analysis, Insights and Forecast - by Source
- 5.1.1. Blue hydrogen
- 5.1.2. Green hydrogen
- 5.1.3. Grey Hydrogen
- 5.2. Market Analysis, Insights and Forecast - by Technology
- 5.2.1. Steam Methane Reforming (SMR)
- 5.2.2. Coal Gasification
- 5.2.3. Other Technologies
- 5.3. Market Analysis, Insights and Forecast - by Application
- 5.3.1. Oil Refining
- 5.3.2. Chemical Processing
- 5.3.3. Iron & Steel Production
- 5.3.4. Other Applications
- 5.4. Market Analysis, Insights and Forecast - by Region
- 5.4.1. North America
- 5.4.2. Europe
- 5.4.3. Middle East
- 5.4.4. Saudi Arabia
- 5.4.5. Asia Pacific
- 5.4.6. South America
- 5.1. Market Analysis, Insights and Forecast - by Source
- 6. Global Hydrogen Generation Industry Analysis, Insights and Forecast, 2021-2033
- 6.1. Market Analysis, Insights and Forecast - by Source
- 6.1.1. Blue hydrogen
- 6.1.2. Green hydrogen
- 6.1.3. Grey Hydrogen
- 6.2. Market Analysis, Insights and Forecast - by Technology
- 6.2.1. Steam Methane Reforming (SMR)
- 6.2.2. Coal Gasification
- 6.2.3. Other Technologies
- 6.3. Market Analysis, Insights and Forecast - by Application
- 6.3.1. Oil Refining
- 6.3.2. Chemical Processing
- 6.3.3. Iron & Steel Production
- 6.3.4. Other Applications
- 6.1. Market Analysis, Insights and Forecast - by Source
- 7. North America Hydrogen Generation Industry Analysis, Insights and Forecast, 2020-2032
- 7.1. Market Analysis, Insights and Forecast - by Source
- 7.1.1. Blue hydrogen
- 7.1.2. Green hydrogen
- 7.1.3. Grey Hydrogen
- 7.2. Market Analysis, Insights and Forecast - by Technology
- 7.2.1. Steam Methane Reforming (SMR)
- 7.2.2. Coal Gasification
- 7.2.3. Other Technologies
- 7.3. Market Analysis, Insights and Forecast - by Application
- 7.3.1. Oil Refining
- 7.3.2. Chemical Processing
- 7.3.3. Iron & Steel Production
- 7.3.4. Other Applications
- 7.1. Market Analysis, Insights and Forecast - by Source
- 8. Europe Hydrogen Generation Industry Analysis, Insights and Forecast, 2020-2032
- 8.1. Market Analysis, Insights and Forecast - by Source
- 8.1.1. Blue hydrogen
- 8.1.2. Green hydrogen
- 8.1.3. Grey Hydrogen
- 8.2. Market Analysis, Insights and Forecast - by Technology
- 8.2.1. Steam Methane Reforming (SMR)
- 8.2.2. Coal Gasification
- 8.2.3. Other Technologies
- 8.3. Market Analysis, Insights and Forecast - by Application
- 8.3.1. Oil Refining
- 8.3.2. Chemical Processing
- 8.3.3. Iron & Steel Production
- 8.3.4. Other Applications
- 8.1. Market Analysis, Insights and Forecast - by Source
- 9. Middle East Hydrogen Generation Industry Analysis, Insights and Forecast, 2020-2032
- 9.1. Market Analysis, Insights and Forecast - by Source
- 9.1.1. Blue hydrogen
- 9.1.2. Green hydrogen
- 9.1.3. Grey Hydrogen
- 9.2. Market Analysis, Insights and Forecast - by Technology
- 9.2.1. Steam Methane Reforming (SMR)
- 9.2.2. Coal Gasification
- 9.2.3. Other Technologies
- 9.3. Market Analysis, Insights and Forecast - by Application
- 9.3.1. Oil Refining
- 9.3.2. Chemical Processing
- 9.3.3. Iron & Steel Production
- 9.3.4. Other Applications
- 9.1. Market Analysis, Insights and Forecast - by Source
- 10. Saudi Arabia Hydrogen Generation Industry Analysis, Insights and Forecast, 2020-2032
- 10.1. Market Analysis, Insights and Forecast - by Source
- 10.1.1. Blue hydrogen
- 10.1.2. Green hydrogen
- 10.1.3. Grey Hydrogen
- 10.2. Market Analysis, Insights and Forecast - by Technology
- 10.2.1. Steam Methane Reforming (SMR)
- 10.2.2. Coal Gasification
- 10.2.3. Other Technologies
- 10.3. Market Analysis, Insights and Forecast - by Application
- 10.3.1. Oil Refining
- 10.3.2. Chemical Processing
- 10.3.3. Iron & Steel Production
- 10.3.4. Other Applications
- 10.1. Market Analysis, Insights and Forecast - by Source
- 11. Asia Pacific Hydrogen Generation Industry Analysis, Insights and Forecast, 2020-2032
- 11.1. Market Analysis, Insights and Forecast - by Source
- 11.1.1. Blue hydrogen
- 11.1.2. Green hydrogen
- 11.1.3. Grey Hydrogen
- 11.2. Market Analysis, Insights and Forecast - by Technology
- 11.2.1. Steam Methane Reforming (SMR)
- 11.2.2. Coal Gasification
- 11.2.3. Other Technologies
- 11.3. Market Analysis, Insights and Forecast - by Application
- 11.3.1. Oil Refining
- 11.3.2. Chemical Processing
- 11.3.3. Iron & Steel Production
- 11.3.4. Other Applications
- 11.1. Market Analysis, Insights and Forecast - by Source
- 12. South America Hydrogen Generation Industry Analysis, Insights and Forecast, 2020-2032
- 12.1. Market Analysis, Insights and Forecast - by Source
- 12.1.1. Blue hydrogen
- 12.1.2. Green hydrogen
- 12.1.3. Grey Hydrogen
- 12.2. Market Analysis, Insights and Forecast - by Technology
- 12.2.1. Steam Methane Reforming (SMR)
- 12.2.2. Coal Gasification
- 12.2.3. Other Technologies
- 12.3. Market Analysis, Insights and Forecast - by Application
- 12.3.1. Oil Refining
- 12.3.2. Chemical Processing
- 12.3.3. Iron & Steel Production
- 12.3.4. Other Applications
- 12.1. Market Analysis, Insights and Forecast - by Source
- 13. Competitive Analysis
- 13.1. Company Profiles
- 13.1.1 McPhy Energy
- 13.1.1.1. Company Overview
- 13.1.1.2. Products
- 13.1.1.3. Company Financials
- 13.1.1.4. SWOT Analysis
- 13.1.2 Engie SA
- 13.1.2.1. Company Overview
- 13.1.2.2. Products
- 13.1.2.3. Company Financials
- 13.1.2.4. SWOT Analysis
- 13.1.3 Taiyo Nippon
- 13.1.3.1. Company Overview
- 13.1.3.2. Products
- 13.1.3.3. Company Financials
- 13.1.3.4. SWOT Analysis
- 13.1.4 Fuel Cell Energy
- 13.1.4.1. Company Overview
- 13.1.4.2. Products
- 13.1.4.3. Company Financials
- 13.1.4.4. SWOT Analysis
- 13.1.5 Air Products & Chemicals
- 13.1.5.1. Company Overview
- 13.1.5.2. Products
- 13.1.5.3. Company Financials
- 13.1.5.4. SWOT Analysis
- 13.1.6 Linde plc
- 13.1.6.1. Company Overview
- 13.1.6.2. Products
- 13.1.6.3. Company Financials
- 13.1.6.4. SWOT Analysis
- 13.1.7 Cummins
- 13.1.7.1. Company Overview
- 13.1.7.2. Products
- 13.1.7.3. Company Financials
- 13.1.7.4. SWOT Analysis
- 13.1.8 Messer Group GmbH
- 13.1.8.1. Company Overview
- 13.1.8.2. Products
- 13.1.8.3. Company Financials
- 13.1.8.4. SWOT Analysis
- 13.1.9 Air Liquide
- 13.1.9.1. Company Overview
- 13.1.9.2. Products
- 13.1.9.3. Company Financials
- 13.1.9.4. SWOT Analysis
- 13.1.10 ITM Power plc
- 13.1.10.1. Company Overview
- 13.1.10.2. Products
- 13.1.10.3. Company Financials
- 13.1.10.4. SWOT Analysis
- 13.1.11 Enapter
- 13.1.11.1. Company Overview
- 13.1.11.2. Products
- 13.1.11.3. Company Financials
- 13.1.11.4. SWOT Analysis
- 13.1.1 McPhy Energy
- 13.2. Market Entropy
- 13.2.1 Company's Key Areas Served
- 13.2.2 Recent Developments
- 13.3. Company Market Share Analysis 2025
- 13.3.1 Top 5 Companies Market Share Analysis
- 13.3.2 Top 3 Companies Market Share Analysis
- 13.4. List of Potential Customers
- 14. Research Methodology
List of Figures
- Figure 1: Global Hydrogen Generation Industry Revenue Breakdown (Million, %) by Region 2025 & 2033
- Figure 2: North America Hydrogen Generation Industry Revenue (Million), by Source 2025 & 2033
- Figure 3: North America Hydrogen Generation Industry Revenue Share (%), by Source 2025 & 2033
- Figure 4: North America Hydrogen Generation Industry Revenue (Million), by Technology 2025 & 2033
- Figure 5: North America Hydrogen Generation Industry Revenue Share (%), by Technology 2025 & 2033
- Figure 6: North America Hydrogen Generation Industry Revenue (Million), by Application 2025 & 2033
- Figure 7: North America Hydrogen Generation Industry Revenue Share (%), by Application 2025 & 2033
- Figure 8: North America Hydrogen Generation Industry Revenue (Million), by Country 2025 & 2033
- Figure 9: North America Hydrogen Generation Industry Revenue Share (%), by Country 2025 & 2033
- Figure 10: Europe Hydrogen Generation Industry Revenue (Million), by Source 2025 & 2033
- Figure 11: Europe Hydrogen Generation Industry Revenue Share (%), by Source 2025 & 2033
- Figure 12: Europe Hydrogen Generation Industry Revenue (Million), by Technology 2025 & 2033
- Figure 13: Europe Hydrogen Generation Industry Revenue Share (%), by Technology 2025 & 2033
- Figure 14: Europe Hydrogen Generation Industry Revenue (Million), by Application 2025 & 2033
- Figure 15: Europe Hydrogen Generation Industry Revenue Share (%), by Application 2025 & 2033
- Figure 16: Europe Hydrogen Generation Industry Revenue (Million), by Country 2025 & 2033
- Figure 17: Europe Hydrogen Generation Industry Revenue Share (%), by Country 2025 & 2033
- Figure 18: Middle East Hydrogen Generation Industry Revenue (Million), by Source 2025 & 2033
- Figure 19: Middle East Hydrogen Generation Industry Revenue Share (%), by Source 2025 & 2033
- Figure 20: Middle East Hydrogen Generation Industry Revenue (Million), by Technology 2025 & 2033
- Figure 21: Middle East Hydrogen Generation Industry Revenue Share (%), by Technology 2025 & 2033
- Figure 22: Middle East Hydrogen Generation Industry Revenue (Million), by Application 2025 & 2033
- Figure 23: Middle East Hydrogen Generation Industry Revenue Share (%), by Application 2025 & 2033
- Figure 24: Middle East Hydrogen Generation Industry Revenue (Million), by Country 2025 & 2033
- Figure 25: Middle East Hydrogen Generation Industry Revenue Share (%), by Country 2025 & 2033
- Figure 26: Saudi Arabia Hydrogen Generation Industry Revenue (Million), by Source 2025 & 2033
- Figure 27: Saudi Arabia Hydrogen Generation Industry Revenue Share (%), by Source 2025 & 2033
- Figure 28: Saudi Arabia Hydrogen Generation Industry Revenue (Million), by Technology 2025 & 2033
- Figure 29: Saudi Arabia Hydrogen Generation Industry Revenue Share (%), by Technology 2025 & 2033
- Figure 30: Saudi Arabia Hydrogen Generation Industry Revenue (Million), by Application 2025 & 2033
- Figure 31: Saudi Arabia Hydrogen Generation Industry Revenue Share (%), by Application 2025 & 2033
- Figure 32: Saudi Arabia Hydrogen Generation Industry Revenue (Million), by Country 2025 & 2033
- Figure 33: Saudi Arabia Hydrogen Generation Industry Revenue Share (%), by Country 2025 & 2033
- Figure 34: Asia Pacific Hydrogen Generation Industry Revenue (Million), by Source 2025 & 2033
- Figure 35: Asia Pacific Hydrogen Generation Industry Revenue Share (%), by Source 2025 & 2033
- Figure 36: Asia Pacific Hydrogen Generation Industry Revenue (Million), by Technology 2025 & 2033
- Figure 37: Asia Pacific Hydrogen Generation Industry Revenue Share (%), by Technology 2025 & 2033
- Figure 38: Asia Pacific Hydrogen Generation Industry Revenue (Million), by Application 2025 & 2033
- Figure 39: Asia Pacific Hydrogen Generation Industry Revenue Share (%), by Application 2025 & 2033
- Figure 40: Asia Pacific Hydrogen Generation Industry Revenue (Million), by Country 2025 & 2033
- Figure 41: Asia Pacific Hydrogen Generation Industry Revenue Share (%), by Country 2025 & 2033
- Figure 42: South America Hydrogen Generation Industry Revenue (Million), by Source 2025 & 2033
- Figure 43: South America Hydrogen Generation Industry Revenue Share (%), by Source 2025 & 2033
- Figure 44: South America Hydrogen Generation Industry Revenue (Million), by Technology 2025 & 2033
- Figure 45: South America Hydrogen Generation Industry Revenue Share (%), by Technology 2025 & 2033
- Figure 46: South America Hydrogen Generation Industry Revenue (Million), by Application 2025 & 2033
- Figure 47: South America Hydrogen Generation Industry Revenue Share (%), by Application 2025 & 2033
- Figure 48: South America Hydrogen Generation Industry Revenue (Million), by Country 2025 & 2033
- Figure 49: South America Hydrogen Generation Industry Revenue Share (%), by Country 2025 & 2033
List of Tables
- Table 1: Global Hydrogen Generation Industry Revenue Million Forecast, by Source 2020 & 2033
- Table 2: Global Hydrogen Generation Industry Revenue Million Forecast, by Technology 2020 & 2033
- Table 3: Global Hydrogen Generation Industry Revenue Million Forecast, by Application 2020 & 2033
- Table 4: Global Hydrogen Generation Industry Revenue Million Forecast, by Region 2020 & 2033
- Table 5: Global Hydrogen Generation Industry Revenue Million Forecast, by Source 2020 & 2033
- Table 6: Global Hydrogen Generation Industry Revenue Million Forecast, by Technology 2020 & 2033
- Table 7: Global Hydrogen Generation Industry Revenue Million Forecast, by Application 2020 & 2033
- Table 8: Global Hydrogen Generation Industry Revenue Million Forecast, by Country 2020 & 2033
- Table 9: United States Hydrogen Generation Industry Revenue (Million) Forecast, by Application 2020 & 2033
- Table 10: Canada Hydrogen Generation Industry Revenue (Million) Forecast, by Application 2020 & 2033
- Table 11: Rest of North America Hydrogen Generation Industry Revenue (Million) Forecast, by Application 2020 & 2033
- Table 12: Global Hydrogen Generation Industry Revenue Million Forecast, by Source 2020 & 2033
- Table 13: Global Hydrogen Generation Industry Revenue Million Forecast, by Technology 2020 & 2033
- Table 14: Global Hydrogen Generation Industry Revenue Million Forecast, by Application 2020 & 2033
- Table 15: Global Hydrogen Generation Industry Revenue Million Forecast, by Country 2020 & 2033
- Table 16: Germany Hydrogen Generation Industry Revenue (Million) Forecast, by Application 2020 & 2033
- Table 17: France Hydrogen Generation Industry Revenue (Million) Forecast, by Application 2020 & 2033
- Table 18: Italy Hydrogen Generation Industry Revenue (Million) Forecast, by Application 2020 & 2033
- Table 19: United Kingdom Hydrogen Generation Industry Revenue (Million) Forecast, by Application 2020 & 2033
- Table 20: Russian Federation Hydrogen Generation Industry Revenue (Million) Forecast, by Application 2020 & 2033
- Table 21: Rest of Europe Hydrogen Generation Industry Revenue (Million) Forecast, by Application 2020 & 2033
- Table 22: Global Hydrogen Generation Industry Revenue Million Forecast, by Source 2020 & 2033
- Table 23: Global Hydrogen Generation Industry Revenue Million Forecast, by Technology 2020 & 2033
- Table 24: Global Hydrogen Generation Industry Revenue Million Forecast, by Application 2020 & 2033
- Table 25: Global Hydrogen Generation Industry Revenue Million Forecast, by Country 2020 & 2033
- Table 26: Global Hydrogen Generation Industry Revenue Million Forecast, by Source 2020 & 2033
- Table 27: Global Hydrogen Generation Industry Revenue Million Forecast, by Technology 2020 & 2033
- Table 28: Global Hydrogen Generation Industry Revenue Million Forecast, by Application 2020 & 2033
- Table 29: Global Hydrogen Generation Industry Revenue Million Forecast, by Country 2020 & 2033
- Table 30: United Arab Emirates Hydrogen Generation Industry Revenue (Million) Forecast, by Application 2020 & 2033
- Table 31: South Africa Hydrogen Generation Industry Revenue (Million) Forecast, by Application 2020 & 2033
- Table 32: Rest of Middle East and Africa Hydrogen Generation Industry Revenue (Million) Forecast, by Application 2020 & 2033
- Table 33: Global Hydrogen Generation Industry Revenue Million Forecast, by Source 2020 & 2033
- Table 34: Global Hydrogen Generation Industry Revenue Million Forecast, by Technology 2020 & 2033
- Table 35: Global Hydrogen Generation Industry Revenue Million Forecast, by Application 2020 & 2033
- Table 36: Global Hydrogen Generation Industry Revenue Million Forecast, by Country 2020 & 2033
- Table 37: China Hydrogen Generation Industry Revenue (Million) Forecast, by Application 2020 & 2033
- Table 38: India Hydrogen Generation Industry Revenue (Million) Forecast, by Application 2020 & 2033
- Table 39: Japan Hydrogen Generation Industry Revenue (Million) Forecast, by Application 2020 & 2033
- Table 40: South Korea Hydrogen Generation Industry Revenue (Million) Forecast, by Application 2020 & 2033
- Table 41: Rest of Asia Pacific Hydrogen Generation Industry Revenue (Million) Forecast, by Application 2020 & 2033
- Table 42: Global Hydrogen Generation Industry Revenue Million Forecast, by Source 2020 & 2033
- Table 43: Global Hydrogen Generation Industry Revenue Million Forecast, by Technology 2020 & 2033
- Table 44: Global Hydrogen Generation Industry Revenue Million Forecast, by Application 2020 & 2033
- Table 45: Global Hydrogen Generation Industry Revenue Million Forecast, by Country 2020 & 2033
- Table 46: Brazil Hydrogen Generation Industry Revenue (Million) Forecast, by Application 2020 & 2033
- Table 47: Argentina Hydrogen Generation Industry Revenue (Million) Forecast, by Application 2020 & 2033
- Table 48: Rest of South America Hydrogen Generation Industry Revenue (Million) Forecast, by Application 2020 & 2033
Frequently Asked Questions
1. What is the projected Compound Annual Growth Rate (CAGR) of the Hydrogen Generation Industry?
The projected CAGR is approximately 4.23%.
2. Which companies are prominent players in the Hydrogen Generation Industry?
Key companies in the market include McPhy Energy, Engie SA, Taiyo Nippon, Fuel Cell Energy, Air Products & Chemicals, Linde plc, Cummins, Messer Group GmbH, Air Liquide, ITM Power plc, Enapter.
3. What are the main segments of the Hydrogen Generation Industry?
The market segments include Source, Technology, Application.
4. Can you provide details about the market size?
The market size is estimated to be USD 184.74 Million as of 2022.
5. What are some drivers contributing to market growth?
4.; Favorable Government Policies4.; Increasing Demand From Refinery and Industrial Sector.
6. What are the notable trends driving market growth?
Oil Refining Segment Expected to Dominate the Market.
7. Are there any restraints impacting market growth?
4.; Higher Production Cost.
8. Can you provide examples of recent developments in the market?
October 2023: H2B2, a technology company with a portfolio in Hydrogen production systems, unveiled the green hydrogen plant, which is expected to become operational in North America, the SoHyCal facility located in Fresno, California, United States. The project envisages 100 percent clean hydrogen production using PEM technology.
9. What pricing options are available for accessing the report?
Pricing options include single-user, multi-user, and enterprise licenses priced at USD 4750, USD 5250, and USD 8750 respectively.
10. Is the market size provided in terms of value or volume?
The market size is provided in terms of value, measured in Million.
11. Are there any specific market keywords associated with the report?
Yes, the market keyword associated with the report is "Hydrogen Generation Industry," which aids in identifying and referencing the specific market segment covered.
12. How do I determine which pricing option suits my needs best?
The pricing options vary based on user requirements and access needs. Individual users may opt for single-user licenses, while businesses requiring broader access may choose multi-user or enterprise licenses for cost-effective access to the report.
13. Are there any additional resources or data provided in the Hydrogen Generation Industry report?
While the report offers comprehensive insights, it's advisable to review the specific contents or supplementary materials provided to ascertain if additional resources or data are available.
14. How can I stay updated on further developments or reports in the Hydrogen Generation Industry?
To stay informed about further developments, trends, and reports in the Hydrogen Generation Industry, consider subscribing to industry newsletters, following relevant companies and organizations, or regularly checking reputable industry news sources and publications.
Methodology
Step 1 - Identification of Relevant Samples Size from Population Database


Step 2 - Approaches for Defining Global Market Size (Value, Volume* & Price*)

Note*: In applicable scenarios
Step 3 - Data Sources
Primary Research
- Web Analytics
- Survey Reports
- Research Institute
- Latest Research Reports
- Opinion Leaders
Secondary Research
- Annual Reports
- White Paper
- Latest Press Release
- Industry Association
- Paid Database
- Investor Presentations

Step 4 - Data Triangulation
Involves using different sources of information in order to increase the validity of a study
These sources are likely to be stakeholders in a program - participants, other researchers, program staff, other community members, and so on.
Then we put all data in single framework & apply various statistical tools to find out the dynamic on the market.
During the analysis stage, feedback from the stakeholder groups would be compared to determine areas of agreement as well as areas of divergence