

Key Insights
The insurance advertising market is a dynamic landscape experiencing significant growth, driven by increasing competition, the rising adoption of digital channels, and a growing need for targeted customer acquisition. The market's expansion is fueled by insurers' strategic investments in innovative advertising strategies, including programmatic advertising, social media marketing, and personalized online campaigns. These tactics allow for more precise targeting of specific demographics and consumer segments, ultimately improving return on investment (ROI) and brand awareness. Furthermore, the evolving regulatory environment and increasing consumer demand for transparency are forcing insurers to refine their advertising practices and focus on building trust and enhancing customer relationships. We project a robust growth trajectory over the forecast period (2025-2033), with a Compound Annual Growth Rate (CAGR) likely exceeding 5%, based on current market dynamics and historical trends in the advertising sector. This growth will be further influenced by technological advancements like AI-powered personalization and the integration of data analytics for optimized campaign performance.
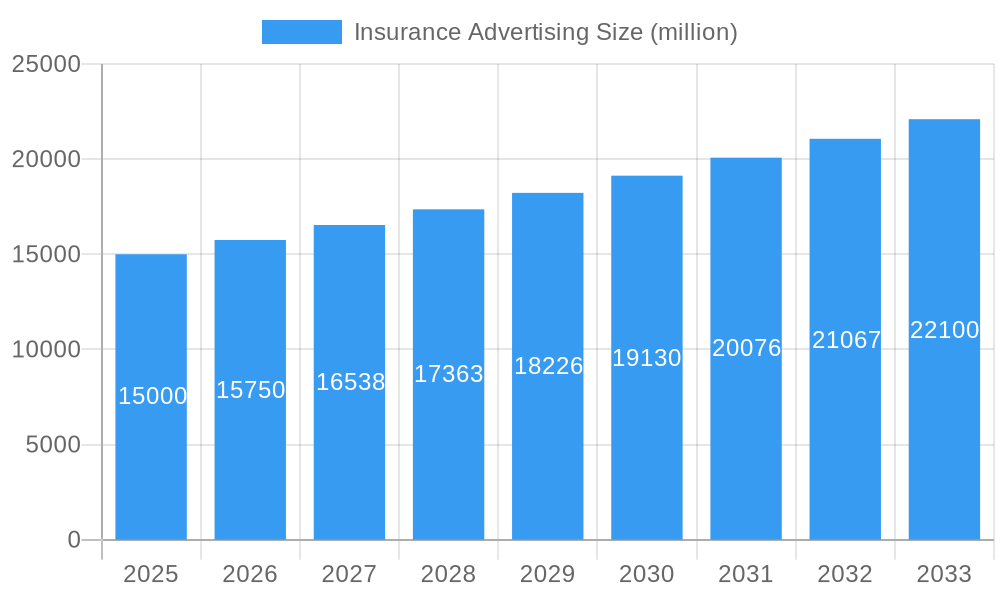
Insurance Advertising Market Size (In Billion)
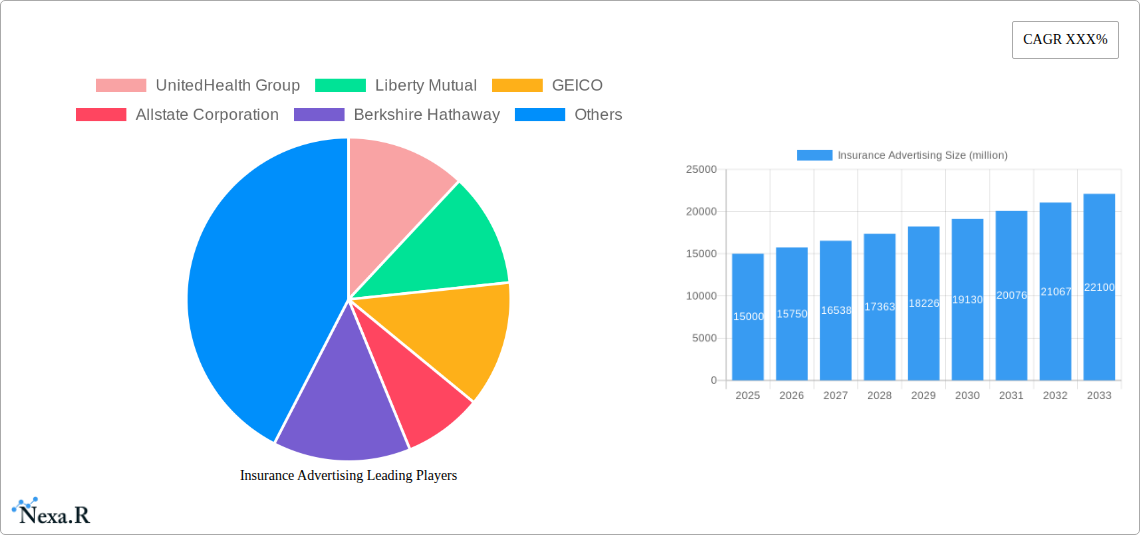
The competitive landscape is dominated by major players such as UnitedHealth Group, Liberty Mutual, GEICO, Allstate, Berkshire Hathaway, Progressive, MetLife, State Farm, Nationwide, Admiral Group, American Family, Farmers Insurance, and Hastings Insurance. These companies are investing heavily in digital marketing and data-driven strategies to gain a competitive edge. While these established players hold significant market share, smaller, agile insurers are also leveraging niche marketing approaches and cost-effective digital tactics to carve out their own segments. The market is segmented by various factors, including advertising channels (digital, print, television, radio), target customer segments (age, income, risk profile), and insurance product type (auto, home, life, health). Regional variations in market dynamics also exist, with North America and Europe currently dominating the market but opportunities for growth in emerging economies becoming increasingly apparent. Future growth will be contingent on adapting to evolving consumer preferences, maintaining compliance with advertising regulations, and harnessing the potential of emerging technologies.
Insurance Advertising Company Market Share
Insurance Advertising Market Report: 2019-2033
This comprehensive report provides a detailed analysis of the Insurance Advertising market, projecting robust growth from 2025 to 2033. Targeting industry professionals, investors, and strategic planners, this report offers invaluable insights into market dynamics, key players, and future trends. The report covers the parent market of Advertising and the child market of Insurance Advertising, providing a granular view of this dynamic sector. The study period spans 2019-2033, with a base year of 2025 and a forecast period of 2025-2033. The historical period analyzed is 2019-2024. Market values are presented in millions.
Insurance Advertising Market Dynamics & Structure
The Insurance Advertising market, valued at $XX million in 2025, exhibits a moderately consolidated structure. Key players such as UnitedHealth Group, Liberty Mutual, GEICO, Allstate Corporation, and Berkshire Hathaway hold significant market share, driving innovation and shaping industry trends. Technological advancements, particularly in digital marketing and data analytics, are reshaping advertising strategies. Regulatory frameworks, varying across regions, significantly impact advertising practices, particularly concerning data privacy and transparency. The market faces competition from substitute advertising channels and is influenced by evolving end-user demographics and preferences. The historical period (2019-2024) witnessed a notable increase in M&A activity, with an estimated XX number of deals. This consolidation is anticipated to continue, with projected XX million deals during the forecast period.
- Market Concentration: Highly concentrated, with top 5 players holding XX% market share in 2025.
- Technological Innovation: Digital marketing, AI-powered targeting, programmatic advertising are key drivers.
- Regulatory Framework: Varying regulations across geographies pose challenges for consistent strategies.
- Competitive Substitutes: Other marketing channels, such as social media, present competition.
- End-User Demographics: Shifting demographics impact targeting strategies and campaign effectiveness.
- M&A Trends: Consolidation expected to continue, leading to larger, more integrated players.
Insurance Advertising Growth Trends & Insights
The Insurance Advertising market demonstrates a strong growth trajectory, driven by the increasing adoption of digital channels, sophisticated targeting techniques, and evolving consumer preferences. The market size is projected to reach $XX million by 2033, exhibiting a CAGR of XX% during the forecast period (2025-2033). This growth is fueled by factors such as increased online insurance purchases, the rise of personalized marketing, and the effectiveness of data-driven advertising strategies. Technological disruptions, including the use of AI and machine learning in ad optimization and campaign measurement, are further enhancing market growth and efficiency. Consumer behavior shifts, particularly towards digital engagement and personalized experiences, are creating significant opportunities for innovative advertising approaches. Market penetration is expected to increase from XX% in 2025 to XX% by 2033.
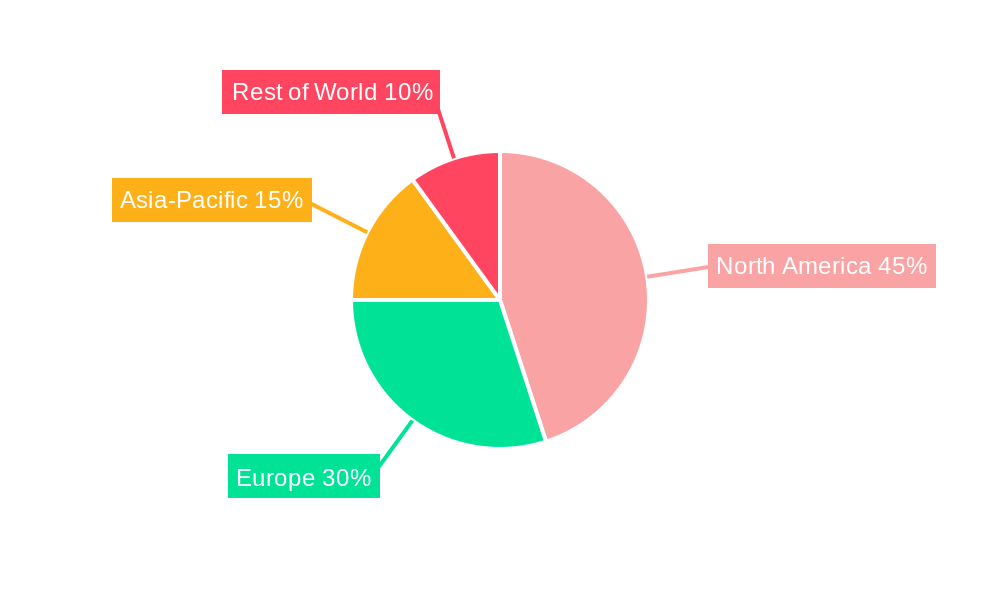
Dominant Regions, Countries, or Segments in Insurance Advertising
North America currently dominates the Insurance Advertising market, holding approximately XX% of the global market share in 2025, driven by factors like high insurance penetration rates, advanced digital infrastructure, and a robust advertising ecosystem. The region's strong economic conditions and favorable regulatory environment also contribute to its dominance. Europe and Asia Pacific are projected to experience significant growth during the forecast period, driven by increasing insurance adoption, expanding internet penetration, and the growing adoption of digital marketing techniques.
- North America: High insurance penetration, advanced digital infrastructure, favorable regulatory environment.
- Europe: Increasing insurance adoption, rising digital marketing adoption.
- Asia Pacific: High growth potential due to expanding internet penetration and a young population.
Insurance Advertising Product Landscape
The Insurance Advertising product landscape encompasses a diverse range of offerings, from traditional print and television advertising to advanced digital marketing solutions. Programmatic advertising, search engine optimization (SEO), and social media marketing are prevalent strategies. These solutions leverage data analytics to optimize campaign performance, enhance targeting accuracy, and measure the return on investment (ROI) effectively. Innovative technologies like AI-powered chatbots and personalized video ads are gaining traction, providing unique selling propositions and enhancing user engagement. The focus is shifting towards data-driven strategies and hyper-personalized campaigns.
Key Drivers, Barriers & Challenges in Insurance Advertising
Key Drivers: Increased insurance penetration, growing digitalization, rising consumer demand for personalized experiences, and advancements in data analytics and AI.
Challenges: Stringent regulatory compliance, data privacy concerns, increasing competition, and the need to effectively measure ROI across diverse channels. These challenges are estimated to impact market growth by approximately XX% in 2033 if not addressed effectively.
Emerging Opportunities in Insurance Advertising
Untapped markets in emerging economies, the growing use of augmented reality (AR) and virtual reality (VR) in advertising, and the increased adoption of omnichannel marketing strategies present significant opportunities. The focus on personalized experiences and improved customer engagement is crucial.
Growth Accelerators in the Insurance Advertising Industry
Technological advancements, such as AI and machine learning, will drive efficiency and optimization in advertising campaigns. Strategic partnerships between insurers and advertising technology companies will further accelerate market growth, fostering innovation and enhancing capabilities. Expansion into underpenetrated markets globally will create significant growth opportunities.
Key Players Shaping the Insurance Advertising Market
- UnitedHealth Group
- Liberty Mutual
- GEICO
- Allstate Corporation
- Berkshire Hathaway
- The Progressive Corporation
- MetLife
- State Farm Mutual
- Nationwide Mutual
- Admiral Group
- American Family Mutual
- Farmers Insurance Group
- Hastings Insurance
Notable Milestones in Insurance Advertising Sector
- 2020: Increased adoption of digital advertising strategies due to the pandemic.
- 2022: Significant investments in AI-powered advertising technologies.
- 2023: Growing focus on data privacy and compliance regulations.
- 2024: Several mergers and acquisitions among advertising technology companies.
In-Depth Insurance Advertising Market Outlook
The Insurance Advertising market is poised for sustained growth, driven by technological innovation, changing consumer behavior, and the expansion of digital channels. Strategic partnerships and investments in data analytics will be key factors determining market leadership. The market's potential is significant, particularly in emerging markets, offering substantial opportunities for growth and innovation in the years to come.
Insurance Advertising Segmentation
-
1. Application
- 1.1. Direct Marketing
- 1.2. Network Marketing
- 1.3. Mobile Marketing
- 1.4. Other
-
2. Type
- 2.1. Non-health Insurance
- 2.2. Life Insurance
Insurance Advertising Segmentation By Geography
-
1. North America
- 1.1. United States
- 1.2. Canada
- 1.3. Mexico
-
2. South America
- 2.1. Brazil
- 2.2. Argentina
- 2.3. Rest of South America
-
3. Europe
- 3.1. United Kingdom
- 3.2. Germany
- 3.3. France
- 3.4. Italy
- 3.5. Spain
- 3.6. Russia
- 3.7. Benelux
- 3.8. Nordics
- 3.9. Rest of Europe
-
4. Middle East & Africa
- 4.1. Turkey
- 4.2. Israel
- 4.3. GCC
- 4.4. North Africa
- 4.5. South Africa
- 4.6. Rest of Middle East & Africa
-
5. Asia Pacific
- 5.1. China
- 5.2. India
- 5.3. Japan
- 5.4. South Korea
- 5.5. ASEAN
- 5.6. Oceania
- 5.7. Rest of Asia Pacific
Insurance Advertising Regional Market Share
Geographic Coverage of Insurance Advertising
Insurance Advertising REPORT HIGHLIGHTS
| Aspects | Details |
|---|---|
| Study Period | 2020-2034 |
| Base Year | 2025 |
| Estimated Year | 2026 |
| Forecast Period | 2026-2034 |
| Historical Period | 2020-2025 |
| Growth Rate | CAGR of XXX% from 2020-2034 |
| Segmentation |
|
Table of Contents
- 1. Introduction
- 1.1. Research Scope
- 1.2. Market Segmentation
- 1.3. Research Methodology
- 1.4. Definitions and Assumptions
- 2. Executive Summary
- 2.1. Introduction
- 3. Market Dynamics
- 3.1. Introduction
- 3.2. Market Drivers
- 3.3. Market Restrains
- 3.4. Market Trends
- 4. Market Factor Analysis
- 4.1. Porters Five Forces
- 4.2. Supply/Value Chain
- 4.3. PESTEL analysis
- 4.4. Market Entropy
- 4.5. Patent/Trademark Analysis
- 5. Global Insurance Advertising Analysis, Insights and Forecast, 2020-2032
- 5.1. Market Analysis, Insights and Forecast - by Application
- 5.1.1. Direct Marketing
- 5.1.2. Network Marketing
- 5.1.3. Mobile Marketing
- 5.1.4. Other
- 5.2. Market Analysis, Insights and Forecast - by Type
- 5.2.1. Non-health Insurance
- 5.2.2. Life Insurance
- 5.3. Market Analysis, Insights and Forecast - by Region
- 5.3.1. North America
- 5.3.2. South America
- 5.3.3. Europe
- 5.3.4. Middle East & Africa
- 5.3.5. Asia Pacific
- 5.1. Market Analysis, Insights and Forecast - by Application
- 6. North America Insurance Advertising Analysis, Insights and Forecast, 2020-2032
- 6.1. Market Analysis, Insights and Forecast - by Application
- 6.1.1. Direct Marketing
- 6.1.2. Network Marketing
- 6.1.3. Mobile Marketing
- 6.1.4. Other
- 6.2. Market Analysis, Insights and Forecast - by Type
- 6.2.1. Non-health Insurance
- 6.2.2. Life Insurance
- 6.1. Market Analysis, Insights and Forecast - by Application
- 7. South America Insurance Advertising Analysis, Insights and Forecast, 2020-2032
- 7.1. Market Analysis, Insights and Forecast - by Application
- 7.1.1. Direct Marketing
- 7.1.2. Network Marketing
- 7.1.3. Mobile Marketing
- 7.1.4. Other
- 7.2. Market Analysis, Insights and Forecast - by Type
- 7.2.1. Non-health Insurance
- 7.2.2. Life Insurance
- 7.1. Market Analysis, Insights and Forecast - by Application
- 8. Europe Insurance Advertising Analysis, Insights and Forecast, 2020-2032
- 8.1. Market Analysis, Insights and Forecast - by Application
- 8.1.1. Direct Marketing
- 8.1.2. Network Marketing
- 8.1.3. Mobile Marketing
- 8.1.4. Other
- 8.2. Market Analysis, Insights and Forecast - by Type
- 8.2.1. Non-health Insurance
- 8.2.2. Life Insurance
- 8.1. Market Analysis, Insights and Forecast - by Application
- 9. Middle East & Africa Insurance Advertising Analysis, Insights and Forecast, 2020-2032
- 9.1. Market Analysis, Insights and Forecast - by Application
- 9.1.1. Direct Marketing
- 9.1.2. Network Marketing
- 9.1.3. Mobile Marketing
- 9.1.4. Other
- 9.2. Market Analysis, Insights and Forecast - by Type
- 9.2.1. Non-health Insurance
- 9.2.2. Life Insurance
- 9.1. Market Analysis, Insights and Forecast - by Application
- 10. Asia Pacific Insurance Advertising Analysis, Insights and Forecast, 2020-2032
- 10.1. Market Analysis, Insights and Forecast - by Application
- 10.1.1. Direct Marketing
- 10.1.2. Network Marketing
- 10.1.3. Mobile Marketing
- 10.1.4. Other
- 10.2. Market Analysis, Insights and Forecast - by Type
- 10.2.1. Non-health Insurance
- 10.2.2. Life Insurance
- 10.1. Market Analysis, Insights and Forecast - by Application
- 11. Competitive Analysis
- 11.1. Global Market Share Analysis 2025
- 11.2. Company Profiles
- 11.2.1 UnitedHealth Group
- 11.2.1.1. Overview
- 11.2.1.2. Products
- 11.2.1.3. SWOT Analysis
- 11.2.1.4. Recent Developments
- 11.2.1.5. Financials (Based on Availability)
- 11.2.2 Liberty Mutual
- 11.2.2.1. Overview
- 11.2.2.2. Products
- 11.2.2.3. SWOT Analysis
- 11.2.2.4. Recent Developments
- 11.2.2.5. Financials (Based on Availability)
- 11.2.3 GEICO
- 11.2.3.1. Overview
- 11.2.3.2. Products
- 11.2.3.3. SWOT Analysis
- 11.2.3.4. Recent Developments
- 11.2.3.5. Financials (Based on Availability)
- 11.2.4 Allstate Corporation
- 11.2.4.1. Overview
- 11.2.4.2. Products
- 11.2.4.3. SWOT Analysis
- 11.2.4.4. Recent Developments
- 11.2.4.5. Financials (Based on Availability)
- 11.2.5 Berkshire Hathaway
- 11.2.5.1. Overview
- 11.2.5.2. Products
- 11.2.5.3. SWOT Analysis
- 11.2.5.4. Recent Developments
- 11.2.5.5. Financials (Based on Availability)
- 11.2.6 The Progressive Corporation
- 11.2.6.1. Overview
- 11.2.6.2. Products
- 11.2.6.3. SWOT Analysis
- 11.2.6.4. Recent Developments
- 11.2.6.5. Financials (Based on Availability)
- 11.2.7 MetLife
- 11.2.7.1. Overview
- 11.2.7.2. Products
- 11.2.7.3. SWOT Analysis
- 11.2.7.4. Recent Developments
- 11.2.7.5. Financials (Based on Availability)
- 11.2.8 State Farm Mutual
- 11.2.8.1. Overview
- 11.2.8.2. Products
- 11.2.8.3. SWOT Analysis
- 11.2.8.4. Recent Developments
- 11.2.8.5. Financials (Based on Availability)
- 11.2.9 Nationwide Mutua
- 11.2.9.1. Overview
- 11.2.9.2. Products
- 11.2.9.3. SWOT Analysis
- 11.2.9.4. Recent Developments
- 11.2.9.5. Financials (Based on Availability)
- 11.2.10 Admiral Group
- 11.2.10.1. Overview
- 11.2.10.2. Products
- 11.2.10.3. SWOT Analysis
- 11.2.10.4. Recent Developments
- 11.2.10.5. Financials (Based on Availability)
- 11.2.11 American Family Mutual
- 11.2.11.1. Overview
- 11.2.11.2. Products
- 11.2.11.3. SWOT Analysis
- 11.2.11.4. Recent Developments
- 11.2.11.5. Financials (Based on Availability)
- 11.2.12 Farmers Insurance Group
- 11.2.12.1. Overview
- 11.2.12.2. Products
- 11.2.12.3. SWOT Analysis
- 11.2.12.4. Recent Developments
- 11.2.12.5. Financials (Based on Availability)
- 11.2.13 Hastings Insurance
- 11.2.13.1. Overview
- 11.2.13.2. Products
- 11.2.13.3. SWOT Analysis
- 11.2.13.4. Recent Developments
- 11.2.13.5. Financials (Based on Availability)
- 11.2.1 UnitedHealth Group
List of Figures
- Figure 1: Global Insurance Advertising Revenue Breakdown (million, %) by Region 2025 & 2033
- Figure 2: North America Insurance Advertising Revenue (million), by Application 2025 & 2033
- Figure 3: North America Insurance Advertising Revenue Share (%), by Application 2025 & 2033
- Figure 4: North America Insurance Advertising Revenue (million), by Type 2025 & 2033
- Figure 5: North America Insurance Advertising Revenue Share (%), by Type 2025 & 2033
- Figure 6: North America Insurance Advertising Revenue (million), by Country 2025 & 2033
- Figure 7: North America Insurance Advertising Revenue Share (%), by Country 2025 & 2033
- Figure 8: South America Insurance Advertising Revenue (million), by Application 2025 & 2033
- Figure 9: South America Insurance Advertising Revenue Share (%), by Application 2025 & 2033
- Figure 10: South America Insurance Advertising Revenue (million), by Type 2025 & 2033
- Figure 11: South America Insurance Advertising Revenue Share (%), by Type 2025 & 2033
- Figure 12: South America Insurance Advertising Revenue (million), by Country 2025 & 2033
- Figure 13: South America Insurance Advertising Revenue Share (%), by Country 2025 & 2033
- Figure 14: Europe Insurance Advertising Revenue (million), by Application 2025 & 2033
- Figure 15: Europe Insurance Advertising Revenue Share (%), by Application 2025 & 2033
- Figure 16: Europe Insurance Advertising Revenue (million), by Type 2025 & 2033
- Figure 17: Europe Insurance Advertising Revenue Share (%), by Type 2025 & 2033
- Figure 18: Europe Insurance Advertising Revenue (million), by Country 2025 & 2033
- Figure 19: Europe Insurance Advertising Revenue Share (%), by Country 2025 & 2033
- Figure 20: Middle East & Africa Insurance Advertising Revenue (million), by Application 2025 & 2033
- Figure 21: Middle East & Africa Insurance Advertising Revenue Share (%), by Application 2025 & 2033
- Figure 22: Middle East & Africa Insurance Advertising Revenue (million), by Type 2025 & 2033
- Figure 23: Middle East & Africa Insurance Advertising Revenue Share (%), by Type 2025 & 2033
- Figure 24: Middle East & Africa Insurance Advertising Revenue (million), by Country 2025 & 2033
- Figure 25: Middle East & Africa Insurance Advertising Revenue Share (%), by Country 2025 & 2033
- Figure 26: Asia Pacific Insurance Advertising Revenue (million), by Application 2025 & 2033
- Figure 27: Asia Pacific Insurance Advertising Revenue Share (%), by Application 2025 & 2033
- Figure 28: Asia Pacific Insurance Advertising Revenue (million), by Type 2025 & 2033
- Figure 29: Asia Pacific Insurance Advertising Revenue Share (%), by Type 2025 & 2033
- Figure 30: Asia Pacific Insurance Advertising Revenue (million), by Country 2025 & 2033
- Figure 31: Asia Pacific Insurance Advertising Revenue Share (%), by Country 2025 & 2033
List of Tables
- Table 1: Global Insurance Advertising Revenue million Forecast, by Application 2020 & 2033
- Table 2: Global Insurance Advertising Revenue million Forecast, by Type 2020 & 2033
- Table 3: Global Insurance Advertising Revenue million Forecast, by Region 2020 & 2033
- Table 4: Global Insurance Advertising Revenue million Forecast, by Application 2020 & 2033
- Table 5: Global Insurance Advertising Revenue million Forecast, by Type 2020 & 2033
- Table 6: Global Insurance Advertising Revenue million Forecast, by Country 2020 & 2033
- Table 7: United States Insurance Advertising Revenue (million) Forecast, by Application 2020 & 2033
- Table 8: Canada Insurance Advertising Revenue (million) Forecast, by Application 2020 & 2033
- Table 9: Mexico Insurance Advertising Revenue (million) Forecast, by Application 2020 & 2033
- Table 10: Global Insurance Advertising Revenue million Forecast, by Application 2020 & 2033
- Table 11: Global Insurance Advertising Revenue million Forecast, by Type 2020 & 2033
- Table 12: Global Insurance Advertising Revenue million Forecast, by Country 2020 & 2033
- Table 13: Brazil Insurance Advertising Revenue (million) Forecast, by Application 2020 & 2033
- Table 14: Argentina Insurance Advertising Revenue (million) Forecast, by Application 2020 & 2033
- Table 15: Rest of South America Insurance Advertising Revenue (million) Forecast, by Application 2020 & 2033
- Table 16: Global Insurance Advertising Revenue million Forecast, by Application 2020 & 2033
- Table 17: Global Insurance Advertising Revenue million Forecast, by Type 2020 & 2033
- Table 18: Global Insurance Advertising Revenue million Forecast, by Country 2020 & 2033
- Table 19: United Kingdom Insurance Advertising Revenue (million) Forecast, by Application 2020 & 2033
- Table 20: Germany Insurance Advertising Revenue (million) Forecast, by Application 2020 & 2033
- Table 21: France Insurance Advertising Revenue (million) Forecast, by Application 2020 & 2033
- Table 22: Italy Insurance Advertising Revenue (million) Forecast, by Application 2020 & 2033
- Table 23: Spain Insurance Advertising Revenue (million) Forecast, by Application 2020 & 2033
- Table 24: Russia Insurance Advertising Revenue (million) Forecast, by Application 2020 & 2033
- Table 25: Benelux Insurance Advertising Revenue (million) Forecast, by Application 2020 & 2033
- Table 26: Nordics Insurance Advertising Revenue (million) Forecast, by Application 2020 & 2033
- Table 27: Rest of Europe Insurance Advertising Revenue (million) Forecast, by Application 2020 & 2033
- Table 28: Global Insurance Advertising Revenue million Forecast, by Application 2020 & 2033
- Table 29: Global Insurance Advertising Revenue million Forecast, by Type 2020 & 2033
- Table 30: Global Insurance Advertising Revenue million Forecast, by Country 2020 & 2033
- Table 31: Turkey Insurance Advertising Revenue (million) Forecast, by Application 2020 & 2033
- Table 32: Israel Insurance Advertising Revenue (million) Forecast, by Application 2020 & 2033
- Table 33: GCC Insurance Advertising Revenue (million) Forecast, by Application 2020 & 2033
- Table 34: North Africa Insurance Advertising Revenue (million) Forecast, by Application 2020 & 2033
- Table 35: South Africa Insurance Advertising Revenue (million) Forecast, by Application 2020 & 2033
- Table 36: Rest of Middle East & Africa Insurance Advertising Revenue (million) Forecast, by Application 2020 & 2033
- Table 37: Global Insurance Advertising Revenue million Forecast, by Application 2020 & 2033
- Table 38: Global Insurance Advertising Revenue million Forecast, by Type 2020 & 2033
- Table 39: Global Insurance Advertising Revenue million Forecast, by Country 2020 & 2033
- Table 40: China Insurance Advertising Revenue (million) Forecast, by Application 2020 & 2033
- Table 41: India Insurance Advertising Revenue (million) Forecast, by Application 2020 & 2033
- Table 42: Japan Insurance Advertising Revenue (million) Forecast, by Application 2020 & 2033
- Table 43: South Korea Insurance Advertising Revenue (million) Forecast, by Application 2020 & 2033
- Table 44: ASEAN Insurance Advertising Revenue (million) Forecast, by Application 2020 & 2033
- Table 45: Oceania Insurance Advertising Revenue (million) Forecast, by Application 2020 & 2033
- Table 46: Rest of Asia Pacific Insurance Advertising Revenue (million) Forecast, by Application 2020 & 2033
Frequently Asked Questions
1. What is the projected Compound Annual Growth Rate (CAGR) of the Insurance Advertising?
The projected CAGR is approximately XXX%.
2. Which companies are prominent players in the Insurance Advertising?
Key companies in the market include UnitedHealth Group, Liberty Mutual, GEICO, Allstate Corporation, Berkshire Hathaway, The Progressive Corporation, MetLife, State Farm Mutual, Nationwide Mutua, Admiral Group, American Family Mutual, Farmers Insurance Group, Hastings Insurance.
3. What are the main segments of the Insurance Advertising?
The market segments include Application, Type.
4. Can you provide details about the market size?
The market size is estimated to be USD XXX million as of 2022.
5. What are some drivers contributing to market growth?
N/A
6. What are the notable trends driving market growth?
N/A
7. Are there any restraints impacting market growth?
N/A
8. Can you provide examples of recent developments in the market?
N/A
9. What pricing options are available for accessing the report?
Pricing options include single-user, multi-user, and enterprise licenses priced at USD 2900.00, USD 4350.00, and USD 5800.00 respectively.
10. Is the market size provided in terms of value or volume?
The market size is provided in terms of value, measured in million.
11. Are there any specific market keywords associated with the report?
Yes, the market keyword associated with the report is "Insurance Advertising," which aids in identifying and referencing the specific market segment covered.
12. How do I determine which pricing option suits my needs best?
The pricing options vary based on user requirements and access needs. Individual users may opt for single-user licenses, while businesses requiring broader access may choose multi-user or enterprise licenses for cost-effective access to the report.
13. Are there any additional resources or data provided in the Insurance Advertising report?
While the report offers comprehensive insights, it's advisable to review the specific contents or supplementary materials provided to ascertain if additional resources or data are available.
14. How can I stay updated on further developments or reports in the Insurance Advertising?
To stay informed about further developments, trends, and reports in the Insurance Advertising, consider subscribing to industry newsletters, following relevant companies and organizations, or regularly checking reputable industry news sources and publications.
Methodology
Step 1 - Identification of Relevant Samples Size from Population Database


Step 2 - Approaches for Defining Global Market Size (Value, Volume* & Price*)

Note*: In applicable scenarios
Step 3 - Data Sources
Primary Research
- Web Analytics
- Survey Reports
- Research Institute
- Latest Research Reports
- Opinion Leaders
Secondary Research
- Annual Reports
- White Paper
- Latest Press Release
- Industry Association
- Paid Database
- Investor Presentations

Step 4 - Data Triangulation
Involves using different sources of information in order to increase the validity of a study
These sources are likely to be stakeholders in a program - participants, other researchers, program staff, other community members, and so on.
Then we put all data in single framework & apply various statistical tools to find out the dynamic on the market.
During the analysis stage, feedback from the stakeholder groups would be compared to determine areas of agreement as well as areas of divergence