

Key Insights
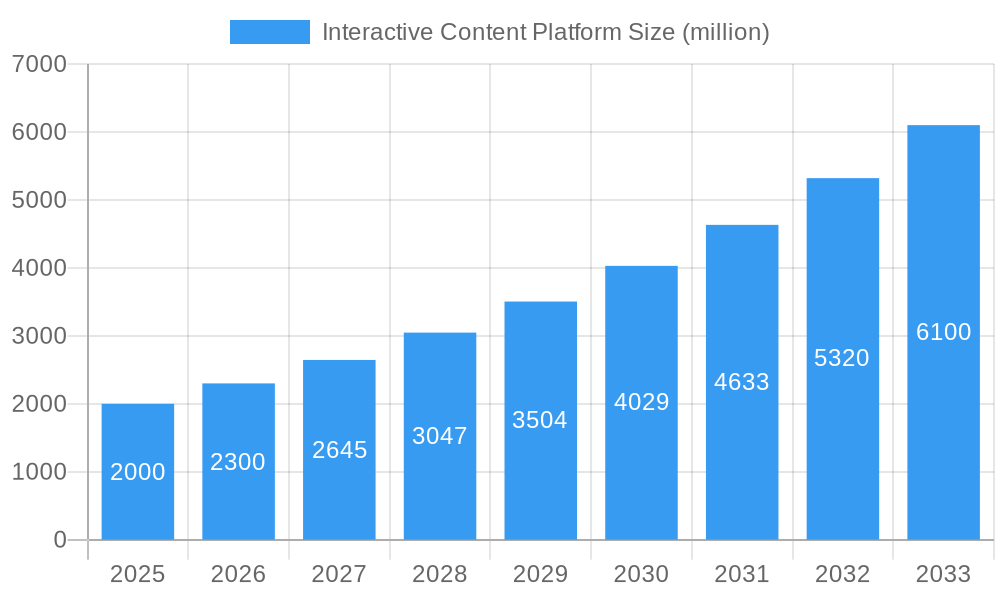
The interactive content platform market is experiencing robust growth, driven by the increasing demand for engaging and immersive digital experiences. Businesses across various sectors are adopting interactive content – including quizzes, polls, calculators, and 360° experiences – to enhance customer engagement, improve lead generation, and boost conversion rates. The market's expansion is fueled by advancements in technology, offering more sophisticated tools and easier integration with existing marketing and communication systems. Furthermore, the rising popularity of personalized marketing strategies contributes significantly to the market's growth, as interactive content allows for tailored experiences that resonate more effectively with individual consumers. We estimate the market size in 2025 to be approximately $2 billion, based on observed growth trends in related digital marketing sectors and the expanding adoption of interactive content across industries. A projected Compound Annual Growth Rate (CAGR) of 15% over the forecast period (2025-2033) indicates substantial future market expansion.
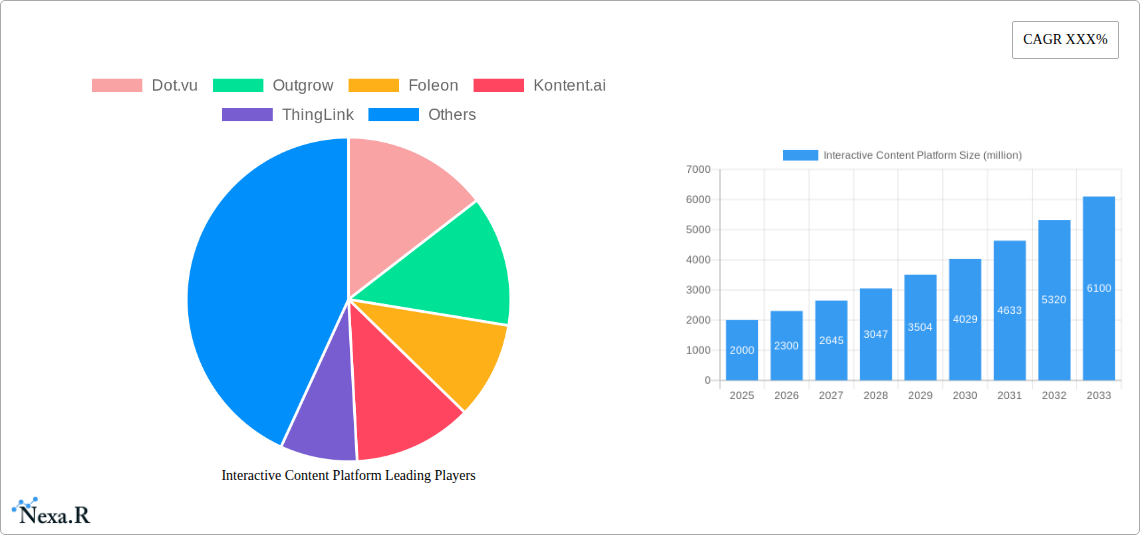
Interactive Content Platform Market Size (In Billion)
Key restraints include the initial investment required for implementing interactive content strategies and the need for specialized skills to create and manage these platforms effectively. However, these challenges are being mitigated by the emergence of user-friendly platforms and readily available resources, including training and support services. The market is segmented by content type (e.g., quizzes, calculators, interactive videos), industry (e.g., education, marketing, healthcare), and deployment mode (e.g., cloud-based, on-premise). Competitive analysis reveals a landscape populated by both established players like SurveyMonkey and emerging innovative companies like Outgrow and Kontent.ai, all vying for market share through product differentiation and strategic partnerships. The continued adoption of interactive content across various industries and the development of increasingly sophisticated platforms suggest a promising trajectory for this market sector.
Interactive Content Platform Company Market Share
Interactive Content Platform Market Report: 2019-2033
This comprehensive report provides an in-depth analysis of the Interactive Content Platform market, encompassing market dynamics, growth trends, regional analysis, competitive landscape, and future outlook. The study period covers 2019-2033, with a base year of 2025 and a forecast period of 2025-2033. The report leverages extensive data analysis to deliver actionable insights for industry professionals, investors, and businesses operating within the parent market of digital marketing and the child market of content marketing. Market values are presented in millions of units.
Interactive Content Platform Market Dynamics & Structure
The interactive content platform market is characterized by a moderately fragmented landscape, with several key players competing for market share. The market size in 2025 is estimated at $XX million, projected to reach $XX million by 2033, exhibiting a CAGR of XX%. Technological advancements, such as AI-powered personalization and immersive experiences, are major drivers. Regulatory frameworks concerning data privacy and accessibility influence platform development and adoption. Competitive substitutes include traditional static content formats and other digital engagement tools. The end-user demographic encompasses businesses of all sizes and industries, increasingly utilizing these platforms for marketing, training, and internal communications. M&A activity has been moderate, with approximately XX deals recorded in the historical period, indicating a consolidating trend.
- Market Concentration: Moderately fragmented, with no single dominant player holding more than XX% market share in 2025.
- Technological Innovation Drivers: AI-powered personalization, VR/AR integration, improved analytics dashboards.
- Regulatory Frameworks: GDPR, CCPA, and other data privacy regulations influence platform development.
- Competitive Product Substitutes: Static content, email marketing, social media engagement.
- End-User Demographics: Businesses across various sectors (education, marketing, training).
- M&A Trends: XX deals in 2019-2024, suggesting a gradual market consolidation.
Interactive Content Platform Growth Trends & Insights
The interactive content platform market has witnessed substantial growth driven by increasing demand for engaging content and enhanced user experiences. Adoption rates have accelerated in recent years, fueled by the rising need for effective digital marketing strategies and improved lead generation. Technological advancements, such as the integration of AI and machine learning, have further propelled market growth, enabling personalized and data-driven content experiences. Consumer behavior is shifting towards interactive content formats that offer greater engagement and value. The market size is expected to grow significantly during the forecast period, driven by the continued adoption of interactive content across various sectors. The CAGR during 2025-2033 is projected to be XX%, indicating a strong growth trajectory.
- Market Size (2025): $XX million
- Market Size (2033): $XX million
- CAGR (2025-2033): XX%
- Market Penetration (2025): XX%
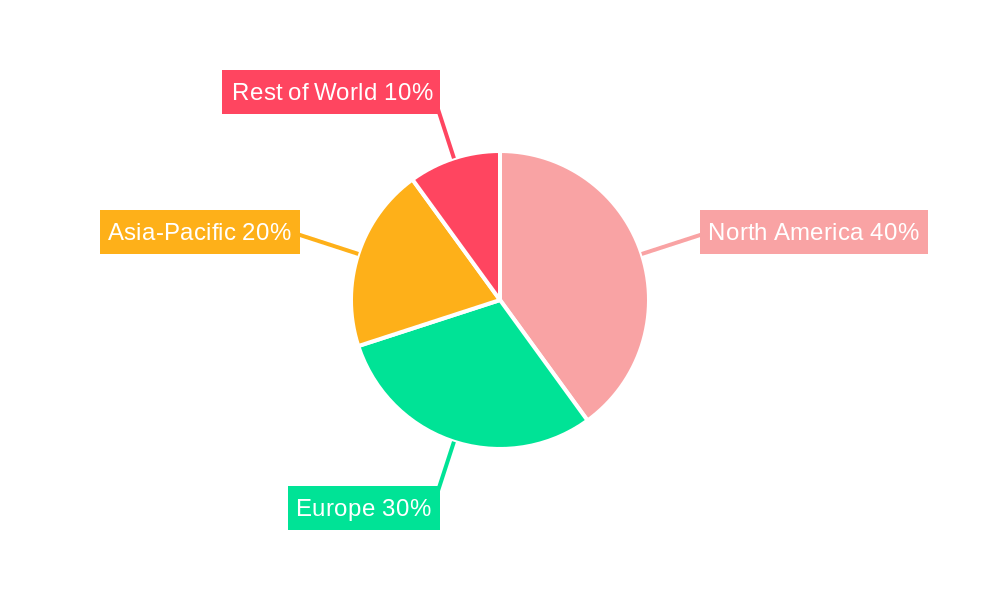
Dominant Regions, Countries, or Segments in Interactive Content Platform
North America currently holds the largest market share in the interactive content platform market, driven by high technological adoption, strong digital marketing spending, and the presence of major players. The region's advanced digital infrastructure and favorable economic conditions contribute to its dominance. Europe is another significant market, exhibiting steady growth. Asia-Pacific is expected to witness the fastest growth rate during the forecast period, driven by the rising adoption of internet and mobile technologies across emerging economies. Specific countries like the US, UK, Germany, Japan, and China are prominent markets within their respective regions. The education segment is showing rapid adoption due to its flexibility and engagement potential.
- North America: High adoption rates, strong digital infrastructure, significant market spending.
- Europe: Steady growth, driven by increasing demand for interactive learning and marketing.
- Asia-Pacific: Fastest-growing region, driven by rising internet and mobile penetration.
Interactive Content Platform Product Landscape
The interactive content platform market offers a diverse range of products catering to various needs and preferences. Platforms range from simple quiz builders to sophisticated tools offering immersive experiences, branching scenarios, and robust analytics. Key innovations include AI-driven personalization, gamification features, and seamless integration with existing marketing platforms. Unique selling propositions include ease of use, advanced analytics capabilities, and flexible customization options. Performance metrics are primarily focused on engagement rates, conversion rates, and user experience. Continuous technological advancements are leading to enhanced functionalities, such as improved user interfaces and increased integration with other business tools.
Key Drivers, Barriers & Challenges in Interactive Content Platform
Key Drivers: The increasing demand for engaging and interactive content is a primary driver, coupled with the need for improved lead generation and brand awareness. Technological advancements, such as AI-powered personalization and immersive experiences, are also accelerating market growth. Government initiatives promoting digital literacy and adoption of digital tools further enhance the market.
Key Challenges and Restraints: High implementation costs, lack of technical expertise among users, and concerns regarding data privacy and security pose significant challenges. Competition from established digital marketing tools and the need for continuous platform updates present ongoing hurdles. Supply chain disruptions can impact the availability of specialized components, impacting production and distribution.
Emerging Opportunities in Interactive Content Platform
Untapped markets in developing economies present significant growth opportunities. The integration of emerging technologies like AR/VR will unlock new avenues for interactive experiences. The increasing demand for personalized learning experiences will drive the adoption of interactive platforms within the education sector. The evolution of consumer preferences towards engaging digital content will continue to fuel market growth. The development of innovative applications in fields like e-commerce and healthcare will further expand the market reach.
Growth Accelerators in the Interactive Content Platform Industry
Technological breakthroughs, strategic partnerships, and aggressive market expansion strategies are key catalysts driving long-term growth in the interactive content platform industry. Continuous product innovation, such as AI-powered personalization and immersive technologies, will propel market expansion. Strategic partnerships with leading marketing and technology companies will extend market reach and enhance product offerings. Expansion into new geographic regions and market segments will unlock untapped growth potential.
Key Players Shaping the Interactive Content Platform Market
- Dot.vu
- Outgrow
- Foleon
- Kontent.ai
- ThingLink
- Ceros
- Zembula
- Apester
- SurveyMonkey
- Shorthand
- Flourish
- Calculoid
- involve.me
- PandaSuite
- Interacty
- Genially
- EX.CO
- Tiled
- Joomag
- Maglr
- Smartella
- Mindstamp
- Turtl
- Quizoom
- 5 Vidya
- Vepple
Notable Milestones in Interactive Content Platform Sector
- 2020: Increased adoption of interactive content due to remote work and digital transformation.
- 2021: Launch of several AI-powered interactive content platforms.
- 2022: Growing integration of interactive content with CRM and marketing automation platforms.
- 2023: Significant investment in the development of immersive interactive experiences.
- 2024: Several key mergers and acquisitions consolidating market share.
In-Depth Interactive Content Platform Market Outlook
The interactive content platform market is poised for sustained growth, driven by continuous technological advancements, increasing demand for engaging content, and expanding market adoption across various industries. Strategic partnerships and innovations in personalization will further accelerate market expansion. The potential for immersive experiences and the integration of new technologies like AR/VR will unlock significant opportunities. The market's future potential is substantial, with ample scope for growth and innovation.
Interactive Content Platform Segmentation
-
1. Application
- 1.1. Education
- 1.2. Marketing
- 1.3. Publisher
- 1.4. Other
-
2. Type
- 2.1. Calculators
- 2.2. Quizzes
- 2.3. Assessments
- 2.4. Recommendations
- 2.5. Polls
- 2.6. Other
Interactive Content Platform Segmentation By Geography
-
1. North America
- 1.1. United States
- 1.2. Canada
- 1.3. Mexico
-
2. South America
- 2.1. Brazil
- 2.2. Argentina
- 2.3. Rest of South America
-
3. Europe
- 3.1. United Kingdom
- 3.2. Germany
- 3.3. France
- 3.4. Italy
- 3.5. Spain
- 3.6. Russia
- 3.7. Benelux
- 3.8. Nordics
- 3.9. Rest of Europe
-
4. Middle East & Africa
- 4.1. Turkey
- 4.2. Israel
- 4.3. GCC
- 4.4. North Africa
- 4.5. South Africa
- 4.6. Rest of Middle East & Africa
-
5. Asia Pacific
- 5.1. China
- 5.2. India
- 5.3. Japan
- 5.4. South Korea
- 5.5. ASEAN
- 5.6. Oceania
- 5.7. Rest of Asia Pacific
Interactive Content Platform Regional Market Share
Geographic Coverage of Interactive Content Platform
Interactive Content Platform REPORT HIGHLIGHTS
| Aspects | Details |
|---|---|
| Study Period | 2020-2034 |
| Base Year | 2025 |
| Estimated Year | 2026 |
| Forecast Period | 2026-2034 |
| Historical Period | 2020-2025 |
| Growth Rate | CAGR of 12.1% from 2020-2034 |
| Segmentation |
|
Table of Contents
- 1. Introduction
- 1.1. Research Scope
- 1.2. Market Segmentation
- 1.3. Research Objective
- 1.4. Definitions and Assumptions
- 2. Executive Summary
- 2.1. Market Snapshot
- 3. Market Dynamics
- 3.1. Market Drivers
- 3.2. Market Restrains
- 3.3. Market Trends
- 3.4. Market Opportunities
- 4. Market Factor Analysis
- 4.1. Porters Five Forces
- 4.1.1. Bargaining Power of Suppliers
- 4.1.2. Bargaining Power of Buyers
- 4.1.3. Threat of New Entrants
- 4.1.4. Threat of Substitutes
- 4.1.5. Competitive Rivalry
- 4.2. PESTEL analysis
- 4.3. BCG Analysis
- 4.3.1. Stars (High Growth, High Market Share)
- 4.3.2. Cash Cows (Low Growth, High Market Share)
- 4.3.3. Question Mark (High Growth, Low Market Share)
- 4.3.4. Dogs (Low Growth, Low Market Share)
- 4.4. Ansoff Matrix Analysis
- 4.5. Supply Chain Analysis
- 4.6. Regulatory Landscape
- 4.7. Current Market Potential and Opportunity Assessment (TAM–SAM–SOM Framework)
- 4.8. NRP Analyst Note
- 4.1. Porters Five Forces
- 5. Market Analysis, Insights and Forecast 2021-2033
- 5.1. Market Analysis, Insights and Forecast - by Application
- 5.1.1. Education
- 5.1.2. Marketing
- 5.1.3. Publisher
- 5.1.4. Other
- 5.2. Market Analysis, Insights and Forecast - by Type
- 5.2.1. Calculators
- 5.2.2. Quizzes
- 5.2.3. Assessments
- 5.2.4. Recommendations
- 5.2.5. Polls
- 5.2.6. Other
- 5.3. Market Analysis, Insights and Forecast - by Region
- 5.3.1. North America
- 5.3.2. South America
- 5.3.3. Europe
- 5.3.4. Middle East & Africa
- 5.3.5. Asia Pacific
- 5.1. Market Analysis, Insights and Forecast - by Application
- 6. Global Interactive Content Platform Analysis, Insights and Forecast, 2021-2033
- 6.1. Market Analysis, Insights and Forecast - by Application
- 6.1.1. Education
- 6.1.2. Marketing
- 6.1.3. Publisher
- 6.1.4. Other
- 6.2. Market Analysis, Insights and Forecast - by Type
- 6.2.1. Calculators
- 6.2.2. Quizzes
- 6.2.3. Assessments
- 6.2.4. Recommendations
- 6.2.5. Polls
- 6.2.6. Other
- 6.1. Market Analysis, Insights and Forecast - by Application
- 7. North America Interactive Content Platform Analysis, Insights and Forecast, 2020-2032
- 7.1. Market Analysis, Insights and Forecast - by Application
- 7.1.1. Education
- 7.1.2. Marketing
- 7.1.3. Publisher
- 7.1.4. Other
- 7.2. Market Analysis, Insights and Forecast - by Type
- 7.2.1. Calculators
- 7.2.2. Quizzes
- 7.2.3. Assessments
- 7.2.4. Recommendations
- 7.2.5. Polls
- 7.2.6. Other
- 7.1. Market Analysis, Insights and Forecast - by Application
- 8. South America Interactive Content Platform Analysis, Insights and Forecast, 2020-2032
- 8.1. Market Analysis, Insights and Forecast - by Application
- 8.1.1. Education
- 8.1.2. Marketing
- 8.1.3. Publisher
- 8.1.4. Other
- 8.2. Market Analysis, Insights and Forecast - by Type
- 8.2.1. Calculators
- 8.2.2. Quizzes
- 8.2.3. Assessments
- 8.2.4. Recommendations
- 8.2.5. Polls
- 8.2.6. Other
- 8.1. Market Analysis, Insights and Forecast - by Application
- 9. Europe Interactive Content Platform Analysis, Insights and Forecast, 2020-2032
- 9.1. Market Analysis, Insights and Forecast - by Application
- 9.1.1. Education
- 9.1.2. Marketing
- 9.1.3. Publisher
- 9.1.4. Other
- 9.2. Market Analysis, Insights and Forecast - by Type
- 9.2.1. Calculators
- 9.2.2. Quizzes
- 9.2.3. Assessments
- 9.2.4. Recommendations
- 9.2.5. Polls
- 9.2.6. Other
- 9.1. Market Analysis, Insights and Forecast - by Application
- 10. Middle East & Africa Interactive Content Platform Analysis, Insights and Forecast, 2020-2032
- 10.1. Market Analysis, Insights and Forecast - by Application
- 10.1.1. Education
- 10.1.2. Marketing
- 10.1.3. Publisher
- 10.1.4. Other
- 10.2. Market Analysis, Insights and Forecast - by Type
- 10.2.1. Calculators
- 10.2.2. Quizzes
- 10.2.3. Assessments
- 10.2.4. Recommendations
- 10.2.5. Polls
- 10.2.6. Other
- 10.1. Market Analysis, Insights and Forecast - by Application
- 11. Asia Pacific Interactive Content Platform Analysis, Insights and Forecast, 2020-2032
- 11.1. Market Analysis, Insights and Forecast - by Application
- 11.1.1. Education
- 11.1.2. Marketing
- 11.1.3. Publisher
- 11.1.4. Other
- 11.2. Market Analysis, Insights and Forecast - by Type
- 11.2.1. Calculators
- 11.2.2. Quizzes
- 11.2.3. Assessments
- 11.2.4. Recommendations
- 11.2.5. Polls
- 11.2.6. Other
- 11.1. Market Analysis, Insights and Forecast - by Application
- 12. Competitive Analysis
- 12.1. Company Profiles
- 12.1.1 Dot.vu
- 12.1.1.1. Company Overview
- 12.1.1.2. Products
- 12.1.1.3. Company Financials
- 12.1.1.4. SWOT Analysis
- 12.1.2 Outgrow
- 12.1.2.1. Company Overview
- 12.1.2.2. Products
- 12.1.2.3. Company Financials
- 12.1.2.4. SWOT Analysis
- 12.1.3 Foleon
- 12.1.3.1. Company Overview
- 12.1.3.2. Products
- 12.1.3.3. Company Financials
- 12.1.3.4. SWOT Analysis
- 12.1.4 Kontent.ai
- 12.1.4.1. Company Overview
- 12.1.4.2. Products
- 12.1.4.3. Company Financials
- 12.1.4.4. SWOT Analysis
- 12.1.5 ThingLink
- 12.1.5.1. Company Overview
- 12.1.5.2. Products
- 12.1.5.3. Company Financials
- 12.1.5.4. SWOT Analysis
- 12.1.6 Ceros
- 12.1.6.1. Company Overview
- 12.1.6.2. Products
- 12.1.6.3. Company Financials
- 12.1.6.4. SWOT Analysis
- 12.1.7 Zembula
- 12.1.7.1. Company Overview
- 12.1.7.2. Products
- 12.1.7.3. Company Financials
- 12.1.7.4. SWOT Analysis
- 12.1.8 Apester
- 12.1.8.1. Company Overview
- 12.1.8.2. Products
- 12.1.8.3. Company Financials
- 12.1.8.4. SWOT Analysis
- 12.1.9 SurveyMonkey
- 12.1.9.1. Company Overview
- 12.1.9.2. Products
- 12.1.9.3. Company Financials
- 12.1.9.4. SWOT Analysis
- 12.1.10 Shorthand
- 12.1.10.1. Company Overview
- 12.1.10.2. Products
- 12.1.10.3. Company Financials
- 12.1.10.4. SWOT Analysis
- 12.1.11 Flourish
- 12.1.11.1. Company Overview
- 12.1.11.2. Products
- 12.1.11.3. Company Financials
- 12.1.11.4. SWOT Analysis
- 12.1.12 Calculoid
- 12.1.12.1. Company Overview
- 12.1.12.2. Products
- 12.1.12.3. Company Financials
- 12.1.12.4. SWOT Analysis
- 12.1.13 involve.me
- 12.1.13.1. Company Overview
- 12.1.13.2. Products
- 12.1.13.3. Company Financials
- 12.1.13.4. SWOT Analysis
- 12.1.14 PandaSuite
- 12.1.14.1. Company Overview
- 12.1.14.2. Products
- 12.1.14.3. Company Financials
- 12.1.14.4. SWOT Analysis
- 12.1.15 Interacty
- 12.1.15.1. Company Overview
- 12.1.15.2. Products
- 12.1.15.3. Company Financials
- 12.1.15.4. SWOT Analysis
- 12.1.16 Genially
- 12.1.16.1. Company Overview
- 12.1.16.2. Products
- 12.1.16.3. Company Financials
- 12.1.16.4. SWOT Analysis
- 12.1.17 EX.CO
- 12.1.17.1. Company Overview
- 12.1.17.2. Products
- 12.1.17.3. Company Financials
- 12.1.17.4. SWOT Analysis
- 12.1.18 Tiled
- 12.1.18.1. Company Overview
- 12.1.18.2. Products
- 12.1.18.3. Company Financials
- 12.1.18.4. SWOT Analysis
- 12.1.19 Joomag
- 12.1.19.1. Company Overview
- 12.1.19.2. Products
- 12.1.19.3. Company Financials
- 12.1.19.4. SWOT Analysis
- 12.1.20 Maglr
- 12.1.20.1. Company Overview
- 12.1.20.2. Products
- 12.1.20.3. Company Financials
- 12.1.20.4. SWOT Analysis
- 12.1.21 Smartella
- 12.1.21.1. Company Overview
- 12.1.21.2. Products
- 12.1.21.3. Company Financials
- 12.1.21.4. SWOT Analysis
- 12.1.22 Mindstamp
- 12.1.22.1. Company Overview
- 12.1.22.2. Products
- 12.1.22.3. Company Financials
- 12.1.22.4. SWOT Analysis
- 12.1.23 Turtl
- 12.1.23.1. Company Overview
- 12.1.23.2. Products
- 12.1.23.3. Company Financials
- 12.1.23.4. SWOT Analysis
- 12.1.24 Quizoom
- 12.1.24.1. Company Overview
- 12.1.24.2. Products
- 12.1.24.3. Company Financials
- 12.1.24.4. SWOT Analysis
- 12.1.25 5 Vidya
- 12.1.25.1. Company Overview
- 12.1.25.2. Products
- 12.1.25.3. Company Financials
- 12.1.25.4. SWOT Analysis
- 12.1.26 Vepple
- 12.1.26.1. Company Overview
- 12.1.26.2. Products
- 12.1.26.3. Company Financials
- 12.1.26.4. SWOT Analysis
- 12.1.1 Dot.vu
- 12.2. Market Entropy
- 12.2.1 Company's Key Areas Served
- 12.2.2 Recent Developments
- 12.3. Company Market Share Analysis 2025
- 12.3.1 Top 5 Companies Market Share Analysis
- 12.3.2 Top 3 Companies Market Share Analysis
- 12.4. List of Potential Customers
- 13. Research Methodology
List of Figures
- Figure 1: Global Interactive Content Platform Revenue Breakdown (billion, %) by Region 2025 & 2033
- Figure 2: North America Interactive Content Platform Revenue (billion), by Application 2025 & 2033
- Figure 3: North America Interactive Content Platform Revenue Share (%), by Application 2025 & 2033
- Figure 4: North America Interactive Content Platform Revenue (billion), by Type 2025 & 2033
- Figure 5: North America Interactive Content Platform Revenue Share (%), by Type 2025 & 2033
- Figure 6: North America Interactive Content Platform Revenue (billion), by Country 2025 & 2033
- Figure 7: North America Interactive Content Platform Revenue Share (%), by Country 2025 & 2033
- Figure 8: South America Interactive Content Platform Revenue (billion), by Application 2025 & 2033
- Figure 9: South America Interactive Content Platform Revenue Share (%), by Application 2025 & 2033
- Figure 10: South America Interactive Content Platform Revenue (billion), by Type 2025 & 2033
- Figure 11: South America Interactive Content Platform Revenue Share (%), by Type 2025 & 2033
- Figure 12: South America Interactive Content Platform Revenue (billion), by Country 2025 & 2033
- Figure 13: South America Interactive Content Platform Revenue Share (%), by Country 2025 & 2033
- Figure 14: Europe Interactive Content Platform Revenue (billion), by Application 2025 & 2033
- Figure 15: Europe Interactive Content Platform Revenue Share (%), by Application 2025 & 2033
- Figure 16: Europe Interactive Content Platform Revenue (billion), by Type 2025 & 2033
- Figure 17: Europe Interactive Content Platform Revenue Share (%), by Type 2025 & 2033
- Figure 18: Europe Interactive Content Platform Revenue (billion), by Country 2025 & 2033
- Figure 19: Europe Interactive Content Platform Revenue Share (%), by Country 2025 & 2033
- Figure 20: Middle East & Africa Interactive Content Platform Revenue (billion), by Application 2025 & 2033
- Figure 21: Middle East & Africa Interactive Content Platform Revenue Share (%), by Application 2025 & 2033
- Figure 22: Middle East & Africa Interactive Content Platform Revenue (billion), by Type 2025 & 2033
- Figure 23: Middle East & Africa Interactive Content Platform Revenue Share (%), by Type 2025 & 2033
- Figure 24: Middle East & Africa Interactive Content Platform Revenue (billion), by Country 2025 & 2033
- Figure 25: Middle East & Africa Interactive Content Platform Revenue Share (%), by Country 2025 & 2033
- Figure 26: Asia Pacific Interactive Content Platform Revenue (billion), by Application 2025 & 2033
- Figure 27: Asia Pacific Interactive Content Platform Revenue Share (%), by Application 2025 & 2033
- Figure 28: Asia Pacific Interactive Content Platform Revenue (billion), by Type 2025 & 2033
- Figure 29: Asia Pacific Interactive Content Platform Revenue Share (%), by Type 2025 & 2033
- Figure 30: Asia Pacific Interactive Content Platform Revenue (billion), by Country 2025 & 2033
- Figure 31: Asia Pacific Interactive Content Platform Revenue Share (%), by Country 2025 & 2033
List of Tables
- Table 1: Global Interactive Content Platform Revenue billion Forecast, by Application 2020 & 2033
- Table 2: Global Interactive Content Platform Revenue billion Forecast, by Type 2020 & 2033
- Table 3: Global Interactive Content Platform Revenue billion Forecast, by Region 2020 & 2033
- Table 4: Global Interactive Content Platform Revenue billion Forecast, by Application 2020 & 2033
- Table 5: Global Interactive Content Platform Revenue billion Forecast, by Type 2020 & 2033
- Table 6: Global Interactive Content Platform Revenue billion Forecast, by Country 2020 & 2033
- Table 7: United States Interactive Content Platform Revenue (billion) Forecast, by Application 2020 & 2033
- Table 8: Canada Interactive Content Platform Revenue (billion) Forecast, by Application 2020 & 2033
- Table 9: Mexico Interactive Content Platform Revenue (billion) Forecast, by Application 2020 & 2033
- Table 10: Global Interactive Content Platform Revenue billion Forecast, by Application 2020 & 2033
- Table 11: Global Interactive Content Platform Revenue billion Forecast, by Type 2020 & 2033
- Table 12: Global Interactive Content Platform Revenue billion Forecast, by Country 2020 & 2033
- Table 13: Brazil Interactive Content Platform Revenue (billion) Forecast, by Application 2020 & 2033
- Table 14: Argentina Interactive Content Platform Revenue (billion) Forecast, by Application 2020 & 2033
- Table 15: Rest of South America Interactive Content Platform Revenue (billion) Forecast, by Application 2020 & 2033
- Table 16: Global Interactive Content Platform Revenue billion Forecast, by Application 2020 & 2033
- Table 17: Global Interactive Content Platform Revenue billion Forecast, by Type 2020 & 2033
- Table 18: Global Interactive Content Platform Revenue billion Forecast, by Country 2020 & 2033
- Table 19: United Kingdom Interactive Content Platform Revenue (billion) Forecast, by Application 2020 & 2033
- Table 20: Germany Interactive Content Platform Revenue (billion) Forecast, by Application 2020 & 2033
- Table 21: France Interactive Content Platform Revenue (billion) Forecast, by Application 2020 & 2033
- Table 22: Italy Interactive Content Platform Revenue (billion) Forecast, by Application 2020 & 2033
- Table 23: Spain Interactive Content Platform Revenue (billion) Forecast, by Application 2020 & 2033
- Table 24: Russia Interactive Content Platform Revenue (billion) Forecast, by Application 2020 & 2033
- Table 25: Benelux Interactive Content Platform Revenue (billion) Forecast, by Application 2020 & 2033
- Table 26: Nordics Interactive Content Platform Revenue (billion) Forecast, by Application 2020 & 2033
- Table 27: Rest of Europe Interactive Content Platform Revenue (billion) Forecast, by Application 2020 & 2033
- Table 28: Global Interactive Content Platform Revenue billion Forecast, by Application 2020 & 2033
- Table 29: Global Interactive Content Platform Revenue billion Forecast, by Type 2020 & 2033
- Table 30: Global Interactive Content Platform Revenue billion Forecast, by Country 2020 & 2033
- Table 31: Turkey Interactive Content Platform Revenue (billion) Forecast, by Application 2020 & 2033
- Table 32: Israel Interactive Content Platform Revenue (billion) Forecast, by Application 2020 & 2033
- Table 33: GCC Interactive Content Platform Revenue (billion) Forecast, by Application 2020 & 2033
- Table 34: North Africa Interactive Content Platform Revenue (billion) Forecast, by Application 2020 & 2033
- Table 35: South Africa Interactive Content Platform Revenue (billion) Forecast, by Application 2020 & 2033
- Table 36: Rest of Middle East & Africa Interactive Content Platform Revenue (billion) Forecast, by Application 2020 & 2033
- Table 37: Global Interactive Content Platform Revenue billion Forecast, by Application 2020 & 2033
- Table 38: Global Interactive Content Platform Revenue billion Forecast, by Type 2020 & 2033
- Table 39: Global Interactive Content Platform Revenue billion Forecast, by Country 2020 & 2033
- Table 40: China Interactive Content Platform Revenue (billion) Forecast, by Application 2020 & 2033
- Table 41: India Interactive Content Platform Revenue (billion) Forecast, by Application 2020 & 2033
- Table 42: Japan Interactive Content Platform Revenue (billion) Forecast, by Application 2020 & 2033
- Table 43: South Korea Interactive Content Platform Revenue (billion) Forecast, by Application 2020 & 2033
- Table 44: ASEAN Interactive Content Platform Revenue (billion) Forecast, by Application 2020 & 2033
- Table 45: Oceania Interactive Content Platform Revenue (billion) Forecast, by Application 2020 & 2033
- Table 46: Rest of Asia Pacific Interactive Content Platform Revenue (billion) Forecast, by Application 2020 & 2033
Frequently Asked Questions
1. What is the projected Compound Annual Growth Rate (CAGR) of the Interactive Content Platform?
The projected CAGR is approximately 12.1%.
2. Which companies are prominent players in the Interactive Content Platform?
Key companies in the market include Dot.vu, Outgrow, Foleon, Kontent.ai, ThingLink, Ceros, Zembula, Apester, SurveyMonkey, Shorthand, Flourish, Calculoid, involve.me, PandaSuite, Interacty, Genially, EX.CO, Tiled, Joomag, Maglr, Smartella, Mindstamp, Turtl, Quizoom, 5 Vidya, Vepple.
3. What are the main segments of the Interactive Content Platform?
The market segments include Application, Type.
4. Can you provide details about the market size?
The market size is estimated to be USD 3.8 billion as of 2022.
5. What are some drivers contributing to market growth?
N/A
6. What are the notable trends driving market growth?
N/A
7. Are there any restraints impacting market growth?
N/A
8. Can you provide examples of recent developments in the market?
N/A
9. What pricing options are available for accessing the report?
Pricing options include single-user, multi-user, and enterprise licenses priced at USD 2900.00, USD 4350.00, and USD 5800.00 respectively.
10. Is the market size provided in terms of value or volume?
The market size is provided in terms of value, measured in billion.
11. Are there any specific market keywords associated with the report?
Yes, the market keyword associated with the report is "Interactive Content Platform," which aids in identifying and referencing the specific market segment covered.
12. How do I determine which pricing option suits my needs best?
The pricing options vary based on user requirements and access needs. Individual users may opt for single-user licenses, while businesses requiring broader access may choose multi-user or enterprise licenses for cost-effective access to the report.
13. Are there any additional resources or data provided in the Interactive Content Platform report?
While the report offers comprehensive insights, it's advisable to review the specific contents or supplementary materials provided to ascertain if additional resources or data are available.
14. How can I stay updated on further developments or reports in the Interactive Content Platform?
To stay informed about further developments, trends, and reports in the Interactive Content Platform, consider subscribing to industry newsletters, following relevant companies and organizations, or regularly checking reputable industry news sources and publications.
Methodology
Step 1 - Identification of Relevant Samples Size from Population Database


Step 2 - Approaches for Defining Global Market Size (Value, Volume* & Price*)

Note*: In applicable scenarios
Step 3 - Data Sources
Primary Research
- Web Analytics
- Survey Reports
- Research Institute
- Latest Research Reports
- Opinion Leaders
Secondary Research
- Annual Reports
- White Paper
- Latest Press Release
- Industry Association
- Paid Database
- Investor Presentations

Step 4 - Data Triangulation
Involves using different sources of information in order to increase the validity of a study
These sources are likely to be stakeholders in a program - participants, other researchers, program staff, other community members, and so on.
Then we put all data in single framework & apply various statistical tools to find out the dynamic on the market.
During the analysis stage, feedback from the stakeholder groups would be compared to determine areas of agreement as well as areas of divergence