

Key Insights
The global Lighting as a Service (LaaS) market is experiencing robust expansion, propelled by the widespread adoption of energy-efficient LED technology and a strategic shift towards Operational Expenditure (OPEX) models. With a projected Compound Annual Growth Rate (CAGR) of 34.8%, the market demonstrates significant investor confidence and a growing client base seeking cost-effective, sustainable lighting solutions. Key growth drivers include reduced upfront capital expenditure, predictable monthly costs, guaranteed performance, and substantial energy savings facilitated by advanced smart lighting technologies. The commercial sector currently leads market adoption, driven by the potential for significant energy cost reductions in large-scale installations. However, the outdoor and industrial segments are rapidly emerging, spurred by smart city initiatives and the demand for reliable, high-performance lighting in challenging environments. Leading industry players are actively developing comprehensive LaaS offerings, integrating hardware, software, and maintenance services to meet evolving market demands. Potential market restraints involve initial infrastructure investment and long-term contract commitments, though the long-term advantages of energy efficiency, operational optimization, and improved lighting quality are increasingly outweighing these concerns.
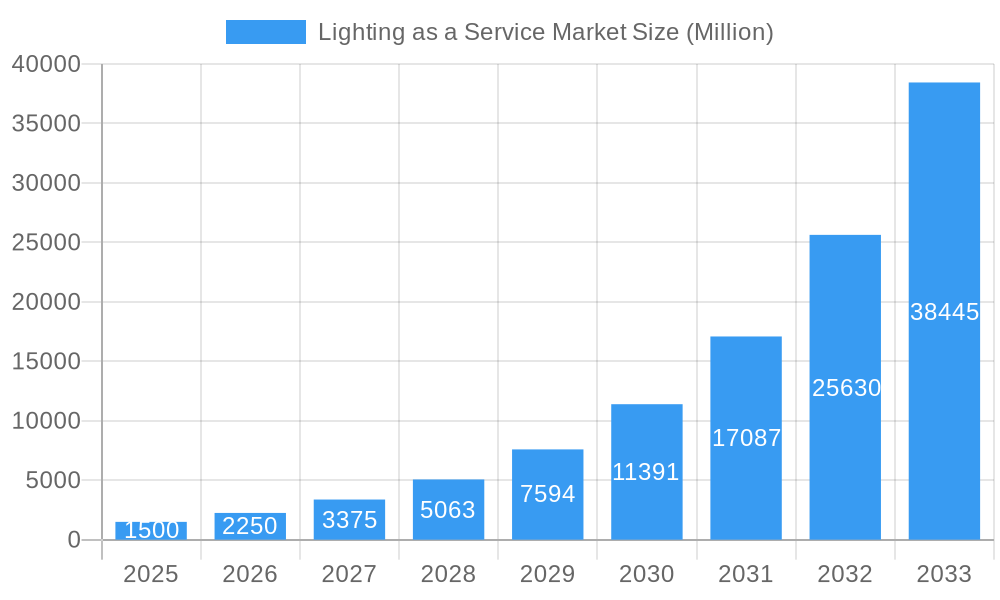
Lighting as a Service Market Market Size (In Billion)
Geographically, the LaaS market mirrors global infrastructure development and technology adoption trends. North America and Europe currently hold substantial market shares, attributed to early adoption and supportive energy efficiency regulations. Nevertheless, the Asia-Pacific region is anticipated to exhibit the most rapid growth, fueled by rapid urbanization and escalating demand for advanced lighting solutions in emerging economies. As LaaS providers expand their global presence and customize offerings for regional needs, market expansion and consolidation are expected. The competitive landscape comprises established lighting manufacturers transitioning to LaaS, alongside specialized providers focused solely on this sector. Future market trajectory will be influenced by technological innovations, government policies promoting energy efficiency, and evolving customer preferences towards sustainable business practices.
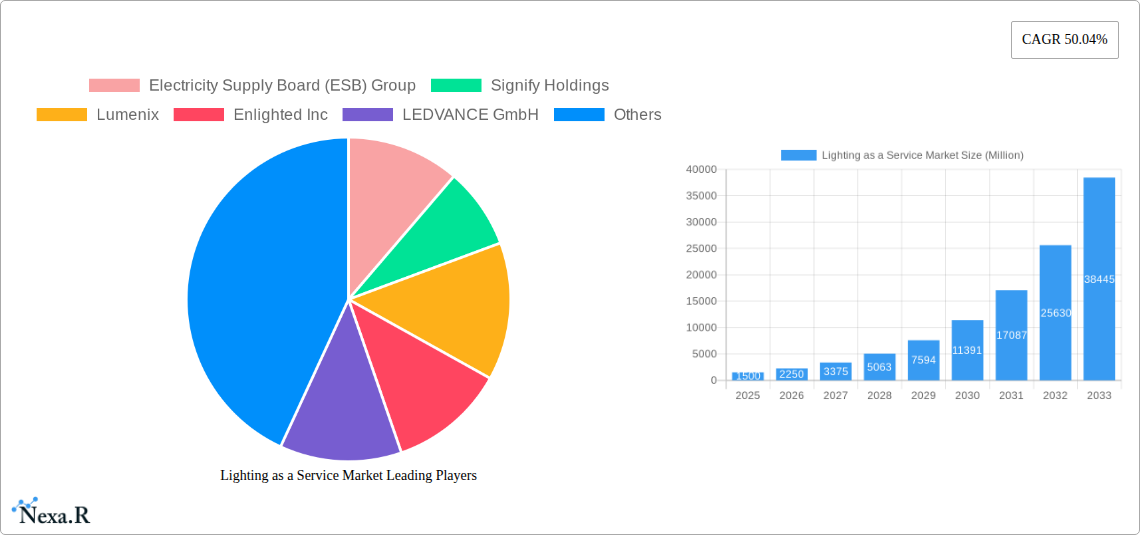
Lighting as a Service Market Company Market Share
Lighting as a Service (LaaS) Market: Comprehensive Analysis and Forecast (2025-2033)
This comprehensive report offers an in-depth analysis of the Lighting as a Service (LaaS) market, examining market dynamics, growth trajectories, regional leadership, product offerings, challenges, opportunities, and key market participants. The analysis covers the base year of 2025 and provides projections through 2033, delivering critical insights for industry professionals, investors, and strategic decision-makers. The estimated market size in 2025 is $3.5 billion, with projections indicating a significant increase by 2033.
Lighting as a Service Market Market Dynamics & Structure
The Lighting as a Service (LaaS) market is characterized by a moderately concentrated landscape, with several key players vying for market share. Technological innovation, particularly in LED lighting and smart technologies, is a primary growth driver. Regulatory frameworks promoting energy efficiency and sustainability are also influential, while the rise of smart building technologies creates significant opportunities. Competition from traditional lighting solutions remains a challenge. Mergers and acquisitions (M&A) activity has been moderate, with larger players strategically acquiring smaller companies with specialized technologies or geographic reach.
- Market Concentration: Moderately concentrated, with top 5 players holding approximately xx% market share in 2025.
- Technological Innovation: Significant advancements in LED technology, IoT integration, and smart lighting controls are driving market growth.
- Regulatory Landscape: Government regulations promoting energy efficiency are fostering adoption of LaaS solutions.
- Competitive Substitutes: Traditional lighting solutions and other energy-saving technologies pose some competition.
- End-User Demographics: The commercial sector dominates the LaaS market, followed by industrial and outdoor applications.
- M&A Trends: A moderate level of M&A activity is observed, primarily focused on strategic acquisitions of innovative technology companies. xx M&A deals were recorded between 2019 and 2024.
Lighting as a Service Market Growth Trends & Insights
The LaaS market has witnessed substantial growth over the past few years, driven by increasing awareness of energy efficiency, cost savings, and the integration of smart lighting systems. The commercial sector is a primary driver of adoption, with businesses seeking to reduce operating costs and improve workplace efficiency. Adoption rates are growing steadily, particularly in developed economies with robust infrastructure and supportive government policies. Technological advancements, such as the integration of IoT and AI, are further accelerating market expansion. Consumer behavior is shifting towards sustainable and smart solutions, contributing to increased demand. The Compound Annual Growth Rate (CAGR) for the LaaS market is estimated at xx% during the forecast period (2025-2033), with market penetration expected to reach xx% by 2033. The analysis leverages extensive market research data, incorporating industry reports and financial statements from listed companies.
Dominant Regions, Countries, or Segments in Lighting as a Service Market
The commercial sector represents the largest segment in the LaaS market, driven by high adoption rates across various industries like offices, retail spaces, and hospitality. North America currently holds a significant market share, followed by Europe and Asia-Pacific. Key factors driving this dominance include established infrastructure, increased environmental awareness, and supportive government initiatives. The commercial sector's potential for cost savings and improved energy efficiency fuels rapid LaaS adoption, whereas countries with strong economic growth show a faster uptake of this technology.
Key Drivers (Commercial Sector):
- Cost savings from reduced energy consumption.
- Enhanced operational efficiency through smart lighting management.
- Improved employee productivity and comfort.
- Enhanced building security and safety features.
- Government incentives and regulations promoting energy efficiency.
Growth Potential: Significant growth is projected in emerging economies, especially in regions with rapid urbanization and infrastructure development.
Lighting as a Service Market Product Landscape
The LaaS market offers a diverse range of products, including smart LED lighting systems, control software, energy management platforms, and remote monitoring tools. These products provide features like dimming capabilities, occupancy sensing, daylight harvesting, and remote diagnostics. Unique selling propositions often focus on enhanced energy efficiency, reduced maintenance costs, and improved operational insights. Recent technological advancements include the integration of artificial intelligence (AI) for personalized lighting experiences and predictive maintenance capabilities.
Key Drivers, Barriers & Challenges in Lighting as a Service Market
Key Drivers: The primary drivers include rising energy costs, increasing demand for energy-efficient solutions, government regulations promoting sustainability, and technological advancements in LED and smart lighting technologies. For example, government tax incentives for energy-efficient upgrades have significantly boosted LaaS adoption in several regions.
Challenges & Restraints: High initial investment costs and complex implementation processes can act as barriers. Concerns about data security and privacy in interconnected systems also need addressing. Furthermore, a shortage of skilled labor for installation and maintenance can hamper market growth. Competition from traditional lighting solutions can further restrict LaaS market penetration, although the shift towards sustainability favors LaaS in the long-term. Supply chain disruptions, observed post-2020, can potentially impact market growth if not effectively managed.
Emerging Opportunities in Lighting as a Service Market
Emerging opportunities lie in expanding LaaS into untapped markets, such as developing countries with rapidly growing infrastructure needs. Innovative applications, like smart street lighting and agricultural lighting, are also gaining traction. The increasing demand for personalized lighting experiences and integration with smart home ecosystems offer additional growth avenues. Furthermore, LaaS's contribution to smart city initiatives creates substantial opportunities.
Growth Accelerators in the Lighting as a Service Market Industry
Long-term growth is further fueled by continuous advancements in LED technology, offering higher efficiency and longer lifespan. Strategic partnerships between lighting providers and energy service companies expand LaaS reach and market penetration. Aggressive expansion strategies focusing on emerging markets and underserved segments will contribute to sustained market growth.
Key Players Shaping the Lighting as a Service Market Market
- Electricity Supply Board (ESB) Group
- Signify Holdings
- Lumenix (Note: This link may not be the global site)
- Enlighted Inc
- LEDVANCE GmbH
- Lighthouse List Not Exhaustive
- Stouch Lighting
- Every Watt Matters
- General Electric Company
- LumenServe Inc
Notable Milestones in Lighting as a Service Market Sector
- 2020: Several key players launched updated LaaS platforms incorporating IoT and AI capabilities.
- 2021: Significant investments were made in research and development for next-generation smart lighting technologies.
- 2022: A major LaaS provider announced a strategic partnership with a large energy company to expand market reach.
- 2023: Increased regulatory support for energy-efficient lighting solutions in several countries.
- 2024: Several M&A deals reshaped the competitive landscape, creating larger, more integrated players.
In-Depth Lighting as a Service Market Market Outlook
The LaaS market is poised for significant growth in the coming years, driven by technological advancements, supportive government policies, and increasing demand for energy-efficient solutions. Strategic opportunities exist for companies focused on innovation, strategic partnerships, and expansion into emerging markets. The long-term outlook remains positive, with continuous market expansion and sustained growth across various regions and sectors.
Lighting as a Service Market Segmentation
-
1. End User
- 1.1. Commercial
- 1.2. Outdoor
- 1.3. Industrial
Lighting as a Service Market Segmentation By Geography
- 1. North America
- 2. Europe
- 3. Asia Pacific
- 4. Latin America
- 5. Middle East
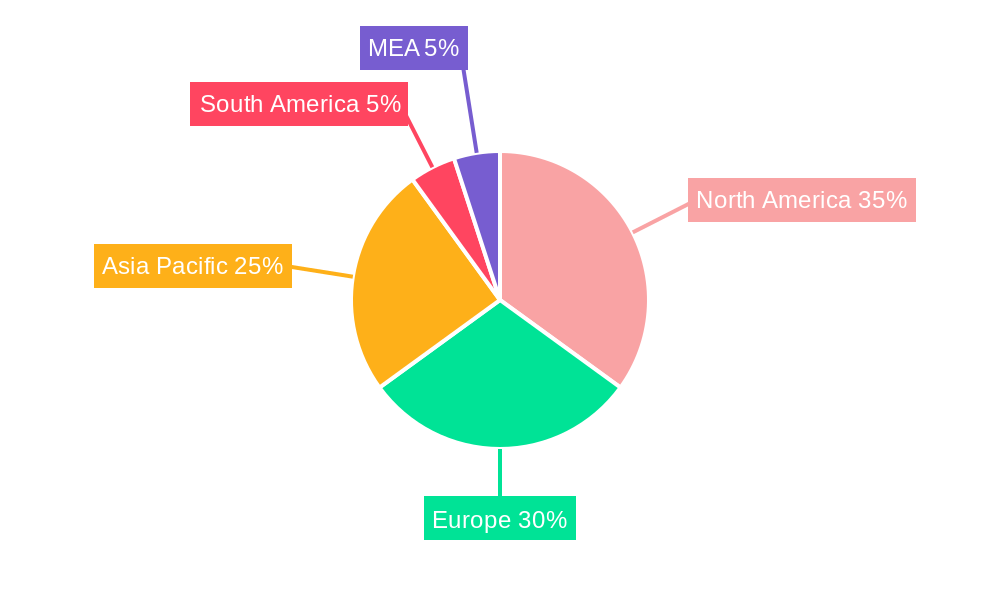
Lighting as a Service Market Regional Market Share
Geographic Coverage of Lighting as a Service Market
Lighting as a Service Market REPORT HIGHLIGHTS
| Aspects | Details |
|---|---|
| Study Period | 2020-2034 |
| Base Year | 2025 |
| Estimated Year | 2026 |
| Forecast Period | 2026-2034 |
| Historical Period | 2020-2025 |
| Growth Rate | CAGR of 34.8% from 2020-2034 |
| Segmentation |
|
Table of Contents
- 1. Introduction
- 1.1. Research Scope
- 1.2. Market Segmentation
- 1.3. Research Objective
- 1.4. Definitions and Assumptions
- 2. Executive Summary
- 2.1. Market Snapshot
- 3. Market Dynamics
- 3.1. Market Drivers
- 3.2. Market Restrains
- 3.3. Market Trends
- 3.4. Market Opportunities
- 4. Market Factor Analysis
- 4.1. Porters Five Forces
- 4.1.1. Bargaining Power of Suppliers
- 4.1.2. Bargaining Power of Buyers
- 4.1.3. Threat of New Entrants
- 4.1.4. Threat of Substitutes
- 4.1.5. Competitive Rivalry
- 4.2. PESTEL analysis
- 4.3. BCG Analysis
- 4.3.1. Stars (High Growth, High Market Share)
- 4.3.2. Cash Cows (Low Growth, High Market Share)
- 4.3.3. Question Mark (High Growth, Low Market Share)
- 4.3.4. Dogs (Low Growth, Low Market Share)
- 4.4. Ansoff Matrix Analysis
- 4.5. Supply Chain Analysis
- 4.6. Regulatory Landscape
- 4.7. Current Market Potential and Opportunity Assessment (TAM–SAM–SOM Framework)
- 4.8. NRP Analyst Note
- 4.1. Porters Five Forces
- 5. Market Analysis, Insights and Forecast 2021-2033
- 5.1. Market Analysis, Insights and Forecast - by End User
- 5.1.1. Commercial
- 5.1.2. Outdoor
- 5.1.3. Industrial
- 5.2. Market Analysis, Insights and Forecast - by Region
- 5.2.1. North America
- 5.2.2. Europe
- 5.2.3. Asia Pacific
- 5.2.4. Latin America
- 5.2.5. Middle East
- 5.1. Market Analysis, Insights and Forecast - by End User
- 6. Global Lighting as a Service Market Analysis, Insights and Forecast, 2021-2033
- 6.1. Market Analysis, Insights and Forecast - by End User
- 6.1.1. Commercial
- 6.1.2. Outdoor
- 6.1.3. Industrial
- 6.1. Market Analysis, Insights and Forecast - by End User
- 7. North America Lighting as a Service Market Analysis, Insights and Forecast, 2020-2032
- 7.1. Market Analysis, Insights and Forecast - by End User
- 7.1.1. Commercial
- 7.1.2. Outdoor
- 7.1.3. Industrial
- 7.1. Market Analysis, Insights and Forecast - by End User
- 8. Europe Lighting as a Service Market Analysis, Insights and Forecast, 2020-2032
- 8.1. Market Analysis, Insights and Forecast - by End User
- 8.1.1. Commercial
- 8.1.2. Outdoor
- 8.1.3. Industrial
- 8.1. Market Analysis, Insights and Forecast - by End User
- 9. Asia Pacific Lighting as a Service Market Analysis, Insights and Forecast, 2020-2032
- 9.1. Market Analysis, Insights and Forecast - by End User
- 9.1.1. Commercial
- 9.1.2. Outdoor
- 9.1.3. Industrial
- 9.1. Market Analysis, Insights and Forecast - by End User
- 10. Latin America Lighting as a Service Market Analysis, Insights and Forecast, 2020-2032
- 10.1. Market Analysis, Insights and Forecast - by End User
- 10.1.1. Commercial
- 10.1.2. Outdoor
- 10.1.3. Industrial
- 10.1. Market Analysis, Insights and Forecast - by End User
- 11. Middle East Lighting as a Service Market Analysis, Insights and Forecast, 2020-2032
- 11.1. Market Analysis, Insights and Forecast - by End User
- 11.1.1. Commercial
- 11.1.2. Outdoor
- 11.1.3. Industrial
- 11.1. Market Analysis, Insights and Forecast - by End User
- 12. Competitive Analysis
- 12.1. Company Profiles
- 12.1.1 Electricity Supply Board (ESB) Group
- 12.1.1.1. Company Overview
- 12.1.1.2. Products
- 12.1.1.3. Company Financials
- 12.1.1.4. SWOT Analysis
- 12.1.2 Signify Holdings
- 12.1.2.1. Company Overview
- 12.1.2.2. Products
- 12.1.2.3. Company Financials
- 12.1.2.4. SWOT Analysis
- 12.1.3 Lumenix
- 12.1.3.1. Company Overview
- 12.1.3.2. Products
- 12.1.3.3. Company Financials
- 12.1.3.4. SWOT Analysis
- 12.1.4 Enlighted Inc
- 12.1.4.1. Company Overview
- 12.1.4.2. Products
- 12.1.4.3. Company Financials
- 12.1.4.4. SWOT Analysis
- 12.1.5 LEDVANCE GmbH
- 12.1.5.1. Company Overview
- 12.1.5.2. Products
- 12.1.5.3. Company Financials
- 12.1.5.4. SWOT Analysis
- 12.1.6 Lighthouse*List Not Exhaustive
- 12.1.6.1. Company Overview
- 12.1.6.2. Products
- 12.1.6.3. Company Financials
- 12.1.6.4. SWOT Analysis
- 12.1.7 Stouch Lighting
- 12.1.7.1. Company Overview
- 12.1.7.2. Products
- 12.1.7.3. Company Financials
- 12.1.7.4. SWOT Analysis
- 12.1.8 Every Watt Matters
- 12.1.8.1. Company Overview
- 12.1.8.2. Products
- 12.1.8.3. Company Financials
- 12.1.8.4. SWOT Analysis
- 12.1.9 General Electric Company
- 12.1.9.1. Company Overview
- 12.1.9.2. Products
- 12.1.9.3. Company Financials
- 12.1.9.4. SWOT Analysis
- 12.1.10 LumenServe Inc
- 12.1.10.1. Company Overview
- 12.1.10.2. Products
- 12.1.10.3. Company Financials
- 12.1.10.4. SWOT Analysis
- 12.1.1 Electricity Supply Board (ESB) Group
- 12.2. Market Entropy
- 12.2.1 Company's Key Areas Served
- 12.2.2 Recent Developments
- 12.3. Company Market Share Analysis 2025
- 12.3.1 Top 5 Companies Market Share Analysis
- 12.3.2 Top 3 Companies Market Share Analysis
- 12.4. List of Potential Customers
- 13. Research Methodology
List of Figures
- Figure 1: Global Lighting as a Service Market Revenue Breakdown (billion, %) by Region 2025 & 2033
- Figure 2: North America Lighting as a Service Market Revenue (billion), by End User 2025 & 2033
- Figure 3: North America Lighting as a Service Market Revenue Share (%), by End User 2025 & 2033
- Figure 4: North America Lighting as a Service Market Revenue (billion), by Country 2025 & 2033
- Figure 5: North America Lighting as a Service Market Revenue Share (%), by Country 2025 & 2033
- Figure 6: Europe Lighting as a Service Market Revenue (billion), by End User 2025 & 2033
- Figure 7: Europe Lighting as a Service Market Revenue Share (%), by End User 2025 & 2033
- Figure 8: Europe Lighting as a Service Market Revenue (billion), by Country 2025 & 2033
- Figure 9: Europe Lighting as a Service Market Revenue Share (%), by Country 2025 & 2033
- Figure 10: Asia Pacific Lighting as a Service Market Revenue (billion), by End User 2025 & 2033
- Figure 11: Asia Pacific Lighting as a Service Market Revenue Share (%), by End User 2025 & 2033
- Figure 12: Asia Pacific Lighting as a Service Market Revenue (billion), by Country 2025 & 2033
- Figure 13: Asia Pacific Lighting as a Service Market Revenue Share (%), by Country 2025 & 2033
- Figure 14: Latin America Lighting as a Service Market Revenue (billion), by End User 2025 & 2033
- Figure 15: Latin America Lighting as a Service Market Revenue Share (%), by End User 2025 & 2033
- Figure 16: Latin America Lighting as a Service Market Revenue (billion), by Country 2025 & 2033
- Figure 17: Latin America Lighting as a Service Market Revenue Share (%), by Country 2025 & 2033
- Figure 18: Middle East Lighting as a Service Market Revenue (billion), by End User 2025 & 2033
- Figure 19: Middle East Lighting as a Service Market Revenue Share (%), by End User 2025 & 2033
- Figure 20: Middle East Lighting as a Service Market Revenue (billion), by Country 2025 & 2033
- Figure 21: Middle East Lighting as a Service Market Revenue Share (%), by Country 2025 & 2033
List of Tables
- Table 1: Global Lighting as a Service Market Revenue billion Forecast, by End User 2020 & 2033
- Table 2: Global Lighting as a Service Market Revenue billion Forecast, by Region 2020 & 2033
- Table 3: Global Lighting as a Service Market Revenue billion Forecast, by End User 2020 & 2033
- Table 4: Global Lighting as a Service Market Revenue billion Forecast, by Country 2020 & 2033
- Table 5: Global Lighting as a Service Market Revenue billion Forecast, by End User 2020 & 2033
- Table 6: Global Lighting as a Service Market Revenue billion Forecast, by Country 2020 & 2033
- Table 7: Global Lighting as a Service Market Revenue billion Forecast, by End User 2020 & 2033
- Table 8: Global Lighting as a Service Market Revenue billion Forecast, by Country 2020 & 2033
- Table 9: Global Lighting as a Service Market Revenue billion Forecast, by End User 2020 & 2033
- Table 10: Global Lighting as a Service Market Revenue billion Forecast, by Country 2020 & 2033
- Table 11: Global Lighting as a Service Market Revenue billion Forecast, by End User 2020 & 2033
- Table 12: Global Lighting as a Service Market Revenue billion Forecast, by Country 2020 & 2033
Frequently Asked Questions
1. What is the projected Compound Annual Growth Rate (CAGR) of the Lighting as a Service Market?
The projected CAGR is approximately 34.8%.
2. Which companies are prominent players in the Lighting as a Service Market?
Key companies in the market include Electricity Supply Board (ESB) Group, Signify Holdings, Lumenix, Enlighted Inc, LEDVANCE GmbH, Lighthouse*List Not Exhaustive, Stouch Lighting, Every Watt Matters, General Electric Company, LumenServe Inc.
3. What are the main segments of the Lighting as a Service Market?
The market segments include End User.
4. Can you provide details about the market size?
The market size is estimated to be USD 3.5 billion as of 2022.
5. What are some drivers contributing to market growth?
; Government Policies for the Adoption of Energy-efficient Lighting Systems; Adoption of IoT with Lighting Systems.
6. What are the notable trends driving market growth?
Commercial Segment to Dominate the Market.
7. Are there any restraints impacting market growth?
4.; The global shift toward renewable sources for electricity generation.
8. Can you provide examples of recent developments in the market?
N/A
9. What pricing options are available for accessing the report?
Pricing options include single-user, multi-user, and enterprise licenses priced at USD 4750, USD 5250, and USD 8750 respectively.
10. Is the market size provided in terms of value or volume?
The market size is provided in terms of value, measured in billion.
11. Are there any specific market keywords associated with the report?
Yes, the market keyword associated with the report is "Lighting as a Service Market," which aids in identifying and referencing the specific market segment covered.
12. How do I determine which pricing option suits my needs best?
The pricing options vary based on user requirements and access needs. Individual users may opt for single-user licenses, while businesses requiring broader access may choose multi-user or enterprise licenses for cost-effective access to the report.
13. Are there any additional resources or data provided in the Lighting as a Service Market report?
While the report offers comprehensive insights, it's advisable to review the specific contents or supplementary materials provided to ascertain if additional resources or data are available.
14. How can I stay updated on further developments or reports in the Lighting as a Service Market?
To stay informed about further developments, trends, and reports in the Lighting as a Service Market, consider subscribing to industry newsletters, following relevant companies and organizations, or regularly checking reputable industry news sources and publications.
Methodology
Step 1 - Identification of Relevant Samples Size from Population Database


Step 2 - Approaches for Defining Global Market Size (Value, Volume* & Price*)

Note*: In applicable scenarios
Step 3 - Data Sources
Primary Research
- Web Analytics
- Survey Reports
- Research Institute
- Latest Research Reports
- Opinion Leaders
Secondary Research
- Annual Reports
- White Paper
- Latest Press Release
- Industry Association
- Paid Database
- Investor Presentations

Step 4 - Data Triangulation
Involves using different sources of information in order to increase the validity of a study
These sources are likely to be stakeholders in a program - participants, other researchers, program staff, other community members, and so on.
Then we put all data in single framework & apply various statistical tools to find out the dynamic on the market.
During the analysis stage, feedback from the stakeholder groups would be compared to determine areas of agreement as well as areas of divergence