

Key Insights
The global Liquefied Petroleum Gas (LPG) market is projected for substantial growth, reaching an estimated 123.14 billion by 2033. The market is expected to grow at a Compound Annual Growth Rate (CAGR) of 3.9% from the base year 2024. This upward trajectory is driven by increasing urbanization and rising energy demands in developing economies, particularly in the Asia-Pacific region, fueling residential cooking and heating needs. The transition to cleaner cooking alternatives in areas without natural gas infrastructure further accelerates LPG adoption. Moreover, LPG's versatility across residential, commercial, industrial, and automotive fuel applications enhances its market penetration. Key challenges include price volatility of crude oil and natural gas feedstocks, and stringent government regulations on emissions and safety. Crude oil remains the dominant production source, followed by natural gas liquids. North America and Asia-Pacific currently lead the market, with significant growth anticipated in the Middle East and Africa. Major players like Exxon Mobil, Novatek, and Sinopec are actively shaping the competitive landscape through strategic investments and technological advancements.
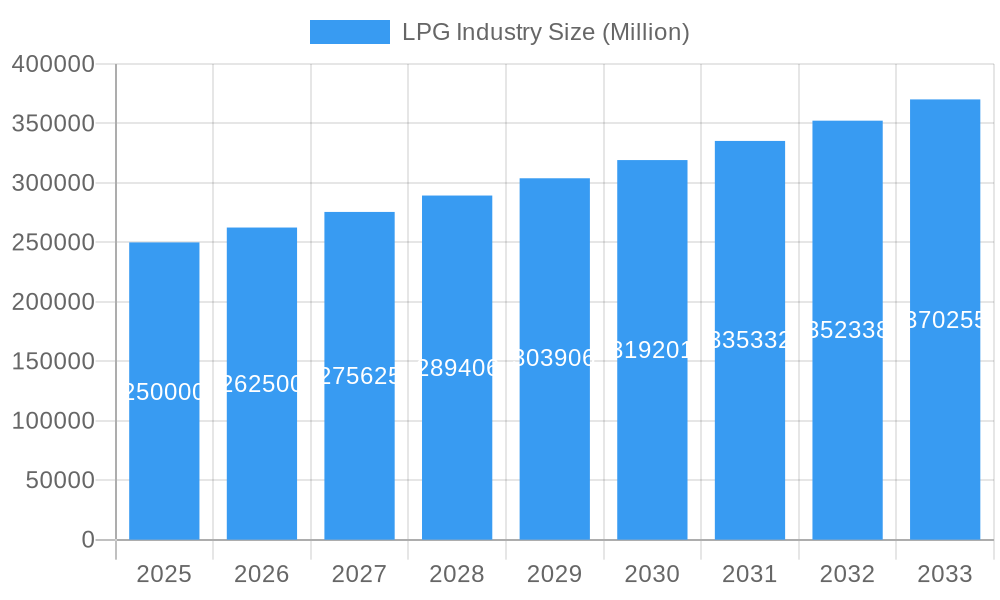
LPG Industry Market Size (In Billion)
Future market expansion will be influenced by continued penetration into emerging markets, advancements in LPG efficiency and safety technologies, and supportive government policies for clean energy. Conversely, price fluctuations and competition from renewable energy sources present potential headwinds. Industry participants are adapting by diversifying portfolios, emphasizing sustainability, and strengthening supply chain resilience. Effective risk management will be crucial for navigating price volatility and ensuring sustained profitability. The competitive environment is expected to see further consolidation and strategic alliances to enhance market reach and operational efficiency.
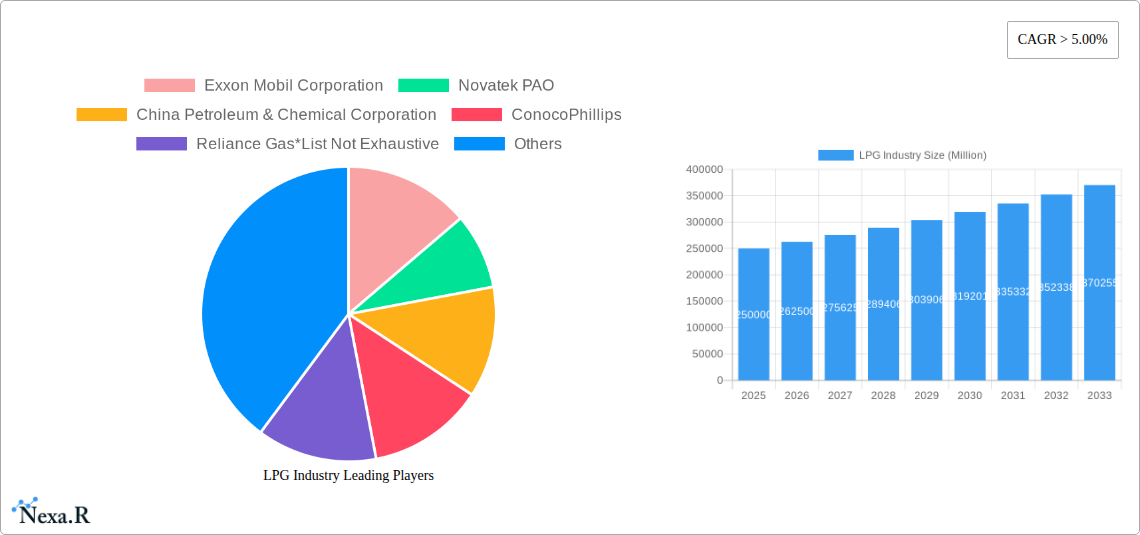
LPG Industry Company Market Share
LPG Market Analysis and Forecast: 2024-2033
This comprehensive report provides an in-depth analysis of the Liquefied Petroleum Gas (LPG) industry, covering market dynamics, growth trends, regional performance, key players, and future outlook. The report focuses on the forecast period from 2025 to 2033, with 2024 as the base year. Analysis includes production sources (crude oil, natural gas liquids) and applications (residential, commercial & industrial, autofuels). Key market drivers, challenges, and opportunities are identified, alongside profiles of leading companies such as ExxonMobil, Novatek, and Sinopec. This report is an essential resource for industry professionals, investors, and stakeholders seeking a thorough understanding of the LPG market.
LPG Industry Market Dynamics & Structure
The LPG industry is characterized by a moderately concentrated market structure with several multinational corporations holding significant market share. Competition is fierce, particularly amongst the largest players. Technological innovation is a key driver, with ongoing efforts to improve extraction methods, enhance safety features, and explore new applications. Stringent regulatory frameworks governing safety, emissions, and transportation significantly influence industry operations. LPG faces competition from alternative fuels like natural gas and electricity, particularly in specific applications. End-user demographics play a significant role, with developing economies exhibiting higher growth potential. Mergers and acquisitions (M&A) activities are relatively frequent as companies strive to expand their market reach and consolidate resources.
- Market Concentration: Top 10 players account for xx% of global market share in 2025 (estimated).
- Technological Innovation: Focus on improving efficiency of extraction, storage, and transportation. Investment in automation and digitalization is increasing.
- Regulatory Framework: Stringent safety regulations and environmental policies impact production, transportation, and distribution costs.
- Competitive Substitutes: Natural gas and electricity pose a competitive threat in certain sectors.
- End-User Demographics: Growing demand in developing nations and urbanization drive market expansion.
- M&A Activity: xx major M&A deals were reported between 2019 and 2024 (Historical data). A projected xx deals are estimated in the forecast period.
LPG Industry Growth Trends & Insights
The LPG market experienced significant growth during the historical period (2019-2024), driven by increasing energy demand, particularly in developing economies. The market size reached xx million units in 2024 and is projected to reach xx million units by 2033, exhibiting a CAGR of xx% during the forecast period (2025-2033). Adoption rates are highest in regions with limited access to natural gas pipelines. Technological disruptions, such as advancements in extraction techniques and improved storage solutions, are contributing to increased efficiency and reduced costs. Shifting consumer preferences toward cleaner fuels are also impacting market dynamics. This analysis leverages proprietary data and industry insights for comprehensive market sizing and trend identification. Detailed CAGR and market penetration figures are available within the full report.
Dominant Regions, Countries, or Segments in LPG Industry
The Middle East and Asia-Pacific regions are currently the dominant forces in LPG production and consumption. Within these regions, countries like Qatar, Saudi Arabia, and China are major producers. The residential sector accounts for the largest share of LPG consumption globally, followed by the commercial and industrial sectors. Crude oil remains the primary source of LPG production; however, natural gas liquids are gaining prominence.
- Key Drivers (Middle East): Abundant natural gas reserves, strategic geopolitical positioning, and government support for energy exports.
- Key Drivers (Asia-Pacific): Rapid economic growth, rising urbanization, and increasing energy demand for cooking and heating.
- Key Drivers (Residential Segment): Affordability and widespread accessibility of LPG in many parts of the world.
- Market Share: Middle East and Asia-Pacific control approximately xx% of global production in 2025.
- Growth Potential: Significant growth opportunities exist in developing nations in Africa and South America.
LPG Industry Product Landscape
The LPG industry offers a range of products, including various grades of LPG tailored to specific applications. Recent innovations focus on improving safety features, enhancing storage solutions, and developing more efficient delivery systems. Technological advancements include the use of advanced materials for cylinders and the development of smart metering technologies. Unique selling propositions center on safety, convenience, and consistent energy supply, along with environmentally friendly combustion compared to other fuels.
Key Drivers, Barriers & Challenges in LPG Industry
Key Drivers:
- Growing energy demand in developing countries.
- Increasing adoption of LPG in industrial applications.
- Advancements in LPG extraction and processing technologies.
- Government policies promoting LPG usage for clean cooking.
Key Challenges:
- Price volatility of crude oil and natural gas.
- Safety concerns related to handling and transportation.
- Infrastructure limitations in some regions.
- Competition from alternative fuels.
- Supply chain disruptions have impacted production and distribution causing xx% increase in prices.
Emerging Opportunities in LPG Industry
- Expansion into untapped markets in sub-Saharan Africa and South America.
- Development of new applications for LPG, such as in transportation.
- Increased adoption of smart metering technologies for enhanced efficiency and monitoring.
- Growing demand for eco-friendly LPG options.
Growth Accelerators in the LPG Industry Industry
The LPG industry's long-term growth is fueled by technological advancements leading to cost reduction and improved safety. Strategic partnerships are forming between producers and distributors to optimize supply chains and expand market reach. Government policies promoting cleaner energy sources support the industry's growth trajectory.
Key Players Shaping the LPG Industry Market
- Exxon Mobil Corporation
- Novatek PAO
- China Petroleum & Chemical Corporation
- ConocoPhillips
- Reliance Gas
- QatarEnergy
- BP PLC
- Indian Oil Corporation Ltd
- Gazprom PJSC
- Abu Dhabi National Oil Company (ADNOC)
Notable Milestones in LPG Industry Sector
- October 2022: Maire Tecnimont S.p.A. awarded a USD 380 million EPC contract for an LPG extraction plant in Algeria.
- February 2022: Indian Oil Corp. announced plans to invest USD 43-46 million to expand LPG bottling capacity in Northeast India.
In-Depth LPG Industry Market Outlook
The LPG industry is poised for continued growth, driven by factors discussed above. Strategic investments in infrastructure development, technological innovation, and sustainable practices will be critical to unlock the market's full potential. Opportunities lie in expanding into new markets, developing innovative applications, and enhancing supply chain efficiency. The industry's future will be shaped by factors such as the global energy transition and competition from alternative fuels, yet substantial growth is anticipated, particularly in developing economies.
LPG Industry Segmentation
-
1. Source of Production
- 1.1. Crude Oil
- 1.2. Natural Gas Liquids
-
2. Application
- 2.1. Residential
- 2.2. Commercial & Industrial
- 2.3. Autofuels
- 2.4. Other Applications
LPG Industry Segmentation By Geography
-
1. North America
- 1.1. United States
- 1.2. Canada
- 1.3. Rest of North America
-
2. Europe
- 2.1. Norway
- 2.2. Netherlands
- 2.3. United Kingdom
- 2.4. Germany
- 2.5. Rest of Europe
-
3. Asia Pacific
- 3.1. China
- 3.2. India
- 3.3. South Korea
- 3.4. Japan
- 3.5. Rest of Asia Pacific
-
4. Middle East and Africa
- 4.1. Saudi Arabia
- 4.2. Qatar
- 4.3. South Africa
- 4.4. Rest of Middle East and Africa
-
5. South America
- 5.1. Brazil
- 5.2. Argentina
- 5.3. Chile
- 5.4. Rest of South America
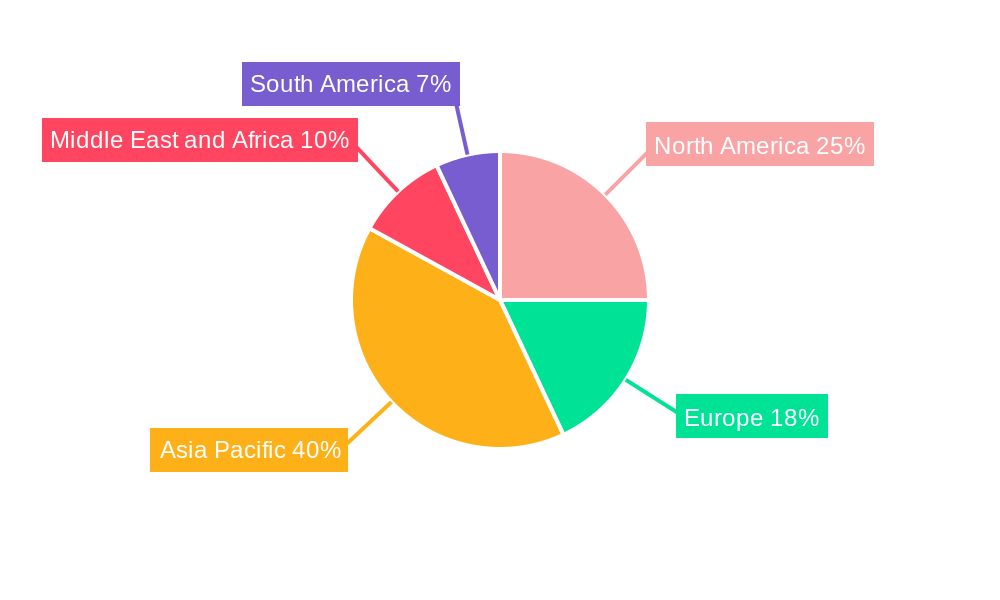
LPG Industry Regional Market Share
Geographic Coverage of LPG Industry
LPG Industry REPORT HIGHLIGHTS
| Aspects | Details |
|---|---|
| Study Period | 2020-2034 |
| Base Year | 2025 |
| Estimated Year | 2026 |
| Forecast Period | 2026-2034 |
| Historical Period | 2020-2025 |
| Growth Rate | CAGR of 3.9% from 2020-2034 |
| Segmentation |
|
Table of Contents
- 1. Introduction
- 1.1. Research Scope
- 1.2. Market Segmentation
- 1.3. Research Objective
- 1.4. Definitions and Assumptions
- 2. Executive Summary
- 2.1. Market Snapshot
- 3. Market Dynamics
- 3.1. Market Drivers
- 3.2. Market Restrains
- 3.3. Market Trends
- 3.4. Market Opportunities
- 4. Market Factor Analysis
- 4.1. Porters Five Forces
- 4.1.1. Bargaining Power of Suppliers
- 4.1.2. Bargaining Power of Buyers
- 4.1.3. Threat of New Entrants
- 4.1.4. Threat of Substitutes
- 4.1.5. Competitive Rivalry
- 4.2. PESTEL analysis
- 4.3. BCG Analysis
- 4.3.1. Stars (High Growth, High Market Share)
- 4.3.2. Cash Cows (Low Growth, High Market Share)
- 4.3.3. Question Mark (High Growth, Low Market Share)
- 4.3.4. Dogs (Low Growth, Low Market Share)
- 4.4. Ansoff Matrix Analysis
- 4.5. Supply Chain Analysis
- 4.6. Regulatory Landscape
- 4.7. Current Market Potential and Opportunity Assessment (TAM–SAM–SOM Framework)
- 4.8. NRP Analyst Note
- 4.1. Porters Five Forces
- 5. Market Analysis, Insights and Forecast 2021-2033
- 5.1. Market Analysis, Insights and Forecast - by Source of Production
- 5.1.1. Crude Oil
- 5.1.2. Natural Gas Liquids
- 5.2. Market Analysis, Insights and Forecast - by Application
- 5.2.1. Residential
- 5.2.2. Commercial & Industrial
- 5.2.3. Autofuels
- 5.2.4. Other Applications
- 5.3. Market Analysis, Insights and Forecast - by Region
- 5.3.1. North America
- 5.3.2. Europe
- 5.3.3. Asia Pacific
- 5.3.4. Middle East and Africa
- 5.3.5. South America
- 5.1. Market Analysis, Insights and Forecast - by Source of Production
- 6. Global LPG Industry Analysis, Insights and Forecast, 2021-2033
- 6.1. Market Analysis, Insights and Forecast - by Source of Production
- 6.1.1. Crude Oil
- 6.1.2. Natural Gas Liquids
- 6.2. Market Analysis, Insights and Forecast - by Application
- 6.2.1. Residential
- 6.2.2. Commercial & Industrial
- 6.2.3. Autofuels
- 6.2.4. Other Applications
- 6.1. Market Analysis, Insights and Forecast - by Source of Production
- 7. North America LPG Industry Analysis, Insights and Forecast, 2020-2032
- 7.1. Market Analysis, Insights and Forecast - by Source of Production
- 7.1.1. Crude Oil
- 7.1.2. Natural Gas Liquids
- 7.2. Market Analysis, Insights and Forecast - by Application
- 7.2.1. Residential
- 7.2.2. Commercial & Industrial
- 7.2.3. Autofuels
- 7.2.4. Other Applications
- 7.1. Market Analysis, Insights and Forecast - by Source of Production
- 8. Europe LPG Industry Analysis, Insights and Forecast, 2020-2032
- 8.1. Market Analysis, Insights and Forecast - by Source of Production
- 8.1.1. Crude Oil
- 8.1.2. Natural Gas Liquids
- 8.2. Market Analysis, Insights and Forecast - by Application
- 8.2.1. Residential
- 8.2.2. Commercial & Industrial
- 8.2.3. Autofuels
- 8.2.4. Other Applications
- 8.1. Market Analysis, Insights and Forecast - by Source of Production
- 9. Asia Pacific LPG Industry Analysis, Insights and Forecast, 2020-2032
- 9.1. Market Analysis, Insights and Forecast - by Source of Production
- 9.1.1. Crude Oil
- 9.1.2. Natural Gas Liquids
- 9.2. Market Analysis, Insights and Forecast - by Application
- 9.2.1. Residential
- 9.2.2. Commercial & Industrial
- 9.2.3. Autofuels
- 9.2.4. Other Applications
- 9.1. Market Analysis, Insights and Forecast - by Source of Production
- 10. Middle East and Africa LPG Industry Analysis, Insights and Forecast, 2020-2032
- 10.1. Market Analysis, Insights and Forecast - by Source of Production
- 10.1.1. Crude Oil
- 10.1.2. Natural Gas Liquids
- 10.2. Market Analysis, Insights and Forecast - by Application
- 10.2.1. Residential
- 10.2.2. Commercial & Industrial
- 10.2.3. Autofuels
- 10.2.4. Other Applications
- 10.1. Market Analysis, Insights and Forecast - by Source of Production
- 11. South America LPG Industry Analysis, Insights and Forecast, 2020-2032
- 11.1. Market Analysis, Insights and Forecast - by Source of Production
- 11.1.1. Crude Oil
- 11.1.2. Natural Gas Liquids
- 11.2. Market Analysis, Insights and Forecast - by Application
- 11.2.1. Residential
- 11.2.2. Commercial & Industrial
- 11.2.3. Autofuels
- 11.2.4. Other Applications
- 11.1. Market Analysis, Insights and Forecast - by Source of Production
- 12. Competitive Analysis
- 12.1. Company Profiles
- 12.1.1 Exxon Mobil Corporation
- 12.1.1.1. Company Overview
- 12.1.1.2. Products
- 12.1.1.3. Company Financials
- 12.1.1.4. SWOT Analysis
- 12.1.2 Novatek PAO
- 12.1.2.1. Company Overview
- 12.1.2.2. Products
- 12.1.2.3. Company Financials
- 12.1.2.4. SWOT Analysis
- 12.1.3 China Petroleum & Chemical Corporation
- 12.1.3.1. Company Overview
- 12.1.3.2. Products
- 12.1.3.3. Company Financials
- 12.1.3.4. SWOT Analysis
- 12.1.4 ConocoPhillips
- 12.1.4.1. Company Overview
- 12.1.4.2. Products
- 12.1.4.3. Company Financials
- 12.1.4.4. SWOT Analysis
- 12.1.5 Reliance Gas*List Not Exhaustive
- 12.1.5.1. Company Overview
- 12.1.5.2. Products
- 12.1.5.3. Company Financials
- 12.1.5.4. SWOT Analysis
- 12.1.6 QatarEnergy
- 12.1.6.1. Company Overview
- 12.1.6.2. Products
- 12.1.6.3. Company Financials
- 12.1.6.4. SWOT Analysis
- 12.1.7 BP PLC
- 12.1.7.1. Company Overview
- 12.1.7.2. Products
- 12.1.7.3. Company Financials
- 12.1.7.4. SWOT Analysis
- 12.1.8 Indian Oil Corporation Ltd
- 12.1.8.1. Company Overview
- 12.1.8.2. Products
- 12.1.8.3. Company Financials
- 12.1.8.4. SWOT Analysis
- 12.1.9 Gazprom PJSC
- 12.1.9.1. Company Overview
- 12.1.9.2. Products
- 12.1.9.3. Company Financials
- 12.1.9.4. SWOT Analysis
- 12.1.10 Abu Dhabi National Oil Company (ADNOC)
- 12.1.10.1. Company Overview
- 12.1.10.2. Products
- 12.1.10.3. Company Financials
- 12.1.10.4. SWOT Analysis
- 12.1.1 Exxon Mobil Corporation
- 12.2. Market Entropy
- 12.2.1 Company's Key Areas Served
- 12.2.2 Recent Developments
- 12.3. Company Market Share Analysis 2025
- 12.3.1 Top 5 Companies Market Share Analysis
- 12.3.2 Top 3 Companies Market Share Analysis
- 12.4. List of Potential Customers
- 13. Research Methodology
List of Figures
- Figure 1: Global LPG Industry Revenue Breakdown (billion, %) by Region 2025 & 2033
- Figure 2: North America LPG Industry Revenue (billion), by Source of Production 2025 & 2033
- Figure 3: North America LPG Industry Revenue Share (%), by Source of Production 2025 & 2033
- Figure 4: North America LPG Industry Revenue (billion), by Application 2025 & 2033
- Figure 5: North America LPG Industry Revenue Share (%), by Application 2025 & 2033
- Figure 6: North America LPG Industry Revenue (billion), by Country 2025 & 2033
- Figure 7: North America LPG Industry Revenue Share (%), by Country 2025 & 2033
- Figure 8: Europe LPG Industry Revenue (billion), by Source of Production 2025 & 2033
- Figure 9: Europe LPG Industry Revenue Share (%), by Source of Production 2025 & 2033
- Figure 10: Europe LPG Industry Revenue (billion), by Application 2025 & 2033
- Figure 11: Europe LPG Industry Revenue Share (%), by Application 2025 & 2033
- Figure 12: Europe LPG Industry Revenue (billion), by Country 2025 & 2033
- Figure 13: Europe LPG Industry Revenue Share (%), by Country 2025 & 2033
- Figure 14: Asia Pacific LPG Industry Revenue (billion), by Source of Production 2025 & 2033
- Figure 15: Asia Pacific LPG Industry Revenue Share (%), by Source of Production 2025 & 2033
- Figure 16: Asia Pacific LPG Industry Revenue (billion), by Application 2025 & 2033
- Figure 17: Asia Pacific LPG Industry Revenue Share (%), by Application 2025 & 2033
- Figure 18: Asia Pacific LPG Industry Revenue (billion), by Country 2025 & 2033
- Figure 19: Asia Pacific LPG Industry Revenue Share (%), by Country 2025 & 2033
- Figure 20: Middle East and Africa LPG Industry Revenue (billion), by Source of Production 2025 & 2033
- Figure 21: Middle East and Africa LPG Industry Revenue Share (%), by Source of Production 2025 & 2033
- Figure 22: Middle East and Africa LPG Industry Revenue (billion), by Application 2025 & 2033
- Figure 23: Middle East and Africa LPG Industry Revenue Share (%), by Application 2025 & 2033
- Figure 24: Middle East and Africa LPG Industry Revenue (billion), by Country 2025 & 2033
- Figure 25: Middle East and Africa LPG Industry Revenue Share (%), by Country 2025 & 2033
- Figure 26: South America LPG Industry Revenue (billion), by Source of Production 2025 & 2033
- Figure 27: South America LPG Industry Revenue Share (%), by Source of Production 2025 & 2033
- Figure 28: South America LPG Industry Revenue (billion), by Application 2025 & 2033
- Figure 29: South America LPG Industry Revenue Share (%), by Application 2025 & 2033
- Figure 30: South America LPG Industry Revenue (billion), by Country 2025 & 2033
- Figure 31: South America LPG Industry Revenue Share (%), by Country 2025 & 2033
List of Tables
- Table 1: Global LPG Industry Revenue billion Forecast, by Source of Production 2020 & 2033
- Table 2: Global LPG Industry Revenue billion Forecast, by Application 2020 & 2033
- Table 3: Global LPG Industry Revenue billion Forecast, by Region 2020 & 2033
- Table 4: Global LPG Industry Revenue billion Forecast, by Source of Production 2020 & 2033
- Table 5: Global LPG Industry Revenue billion Forecast, by Application 2020 & 2033
- Table 6: Global LPG Industry Revenue billion Forecast, by Country 2020 & 2033
- Table 7: United States LPG Industry Revenue (billion) Forecast, by Application 2020 & 2033
- Table 8: Canada LPG Industry Revenue (billion) Forecast, by Application 2020 & 2033
- Table 9: Rest of North America LPG Industry Revenue (billion) Forecast, by Application 2020 & 2033
- Table 10: Global LPG Industry Revenue billion Forecast, by Source of Production 2020 & 2033
- Table 11: Global LPG Industry Revenue billion Forecast, by Application 2020 & 2033
- Table 12: Global LPG Industry Revenue billion Forecast, by Country 2020 & 2033
- Table 13: Norway LPG Industry Revenue (billion) Forecast, by Application 2020 & 2033
- Table 14: Netherlands LPG Industry Revenue (billion) Forecast, by Application 2020 & 2033
- Table 15: United Kingdom LPG Industry Revenue (billion) Forecast, by Application 2020 & 2033
- Table 16: Germany LPG Industry Revenue (billion) Forecast, by Application 2020 & 2033
- Table 17: Rest of Europe LPG Industry Revenue (billion) Forecast, by Application 2020 & 2033
- Table 18: Global LPG Industry Revenue billion Forecast, by Source of Production 2020 & 2033
- Table 19: Global LPG Industry Revenue billion Forecast, by Application 2020 & 2033
- Table 20: Global LPG Industry Revenue billion Forecast, by Country 2020 & 2033
- Table 21: China LPG Industry Revenue (billion) Forecast, by Application 2020 & 2033
- Table 22: India LPG Industry Revenue (billion) Forecast, by Application 2020 & 2033
- Table 23: South Korea LPG Industry Revenue (billion) Forecast, by Application 2020 & 2033
- Table 24: Japan LPG Industry Revenue (billion) Forecast, by Application 2020 & 2033
- Table 25: Rest of Asia Pacific LPG Industry Revenue (billion) Forecast, by Application 2020 & 2033
- Table 26: Global LPG Industry Revenue billion Forecast, by Source of Production 2020 & 2033
- Table 27: Global LPG Industry Revenue billion Forecast, by Application 2020 & 2033
- Table 28: Global LPG Industry Revenue billion Forecast, by Country 2020 & 2033
- Table 29: Saudi Arabia LPG Industry Revenue (billion) Forecast, by Application 2020 & 2033
- Table 30: Qatar LPG Industry Revenue (billion) Forecast, by Application 2020 & 2033
- Table 31: South Africa LPG Industry Revenue (billion) Forecast, by Application 2020 & 2033
- Table 32: Rest of Middle East and Africa LPG Industry Revenue (billion) Forecast, by Application 2020 & 2033
- Table 33: Global LPG Industry Revenue billion Forecast, by Source of Production 2020 & 2033
- Table 34: Global LPG Industry Revenue billion Forecast, by Application 2020 & 2033
- Table 35: Global LPG Industry Revenue billion Forecast, by Country 2020 & 2033
- Table 36: Brazil LPG Industry Revenue (billion) Forecast, by Application 2020 & 2033
- Table 37: Argentina LPG Industry Revenue (billion) Forecast, by Application 2020 & 2033
- Table 38: Chile LPG Industry Revenue (billion) Forecast, by Application 2020 & 2033
- Table 39: Rest of South America LPG Industry Revenue (billion) Forecast, by Application 2020 & 2033
Frequently Asked Questions
1. What is the projected Compound Annual Growth Rate (CAGR) of the LPG Industry?
The projected CAGR is approximately 3.9%.
2. Which companies are prominent players in the LPG Industry?
Key companies in the market include Exxon Mobil Corporation, Novatek PAO, China Petroleum & Chemical Corporation, ConocoPhillips, Reliance Gas*List Not Exhaustive, QatarEnergy, BP PLC, Indian Oil Corporation Ltd, Gazprom PJSC, Abu Dhabi National Oil Company (ADNOC).
3. What are the main segments of the LPG Industry?
The market segments include Source of Production, Application.
4. Can you provide details about the market size?
The market size is estimated to be USD 123.14 billion as of 2022.
5. What are some drivers contributing to market growth?
4.; Increasing Demand for Gasoline and Diesel Across the Globe4.; Rapid Expansion of Automotive Industry.
6. What are the notable trends driving market growth?
LPG Extracted from Natural Gas Liquids to Dominate the Market.
7. Are there any restraints impacting market growth?
4.; Strict Mandates by the Global Organizations on VGO Composition.
8. Can you provide examples of recent developments in the market?
In October 2022, Maire Tecnimont S.p.A. announced that its principal subsidiary, Tecnimont S.p.A., was awarded an EPC contract by SONATRACH's Direction Centrale Engineering & Project Management for the execution of an LPG extraction plant within the existing Rhourde El Baguel oil and gas treatment complex in northeastern Algeria. The total contract value is around USD 380 million.
9. What pricing options are available for accessing the report?
Pricing options include single-user, multi-user, and enterprise licenses priced at USD 4750, USD 5250, and USD 8750 respectively.
10. Is the market size provided in terms of value or volume?
The market size is provided in terms of value, measured in billion.
11. Are there any specific market keywords associated with the report?
Yes, the market keyword associated with the report is "LPG Industry," which aids in identifying and referencing the specific market segment covered.
12. How do I determine which pricing option suits my needs best?
The pricing options vary based on user requirements and access needs. Individual users may opt for single-user licenses, while businesses requiring broader access may choose multi-user or enterprise licenses for cost-effective access to the report.
13. Are there any additional resources or data provided in the LPG Industry report?
While the report offers comprehensive insights, it's advisable to review the specific contents or supplementary materials provided to ascertain if additional resources or data are available.
14. How can I stay updated on further developments or reports in the LPG Industry?
To stay informed about further developments, trends, and reports in the LPG Industry, consider subscribing to industry newsletters, following relevant companies and organizations, or regularly checking reputable industry news sources and publications.
Methodology
Step 1 - Identification of Relevant Samples Size from Population Database


Step 2 - Approaches for Defining Global Market Size (Value, Volume* & Price*)

Note*: In applicable scenarios
Step 3 - Data Sources
Primary Research
- Web Analytics
- Survey Reports
- Research Institute
- Latest Research Reports
- Opinion Leaders
Secondary Research
- Annual Reports
- White Paper
- Latest Press Release
- Industry Association
- Paid Database
- Investor Presentations

Step 4 - Data Triangulation
Involves using different sources of information in order to increase the validity of a study
These sources are likely to be stakeholders in a program - participants, other researchers, program staff, other community members, and so on.
Then we put all data in single framework & apply various statistical tools to find out the dynamic on the market.
During the analysis stage, feedback from the stakeholder groups would be compared to determine areas of agreement as well as areas of divergence