

Key Insights
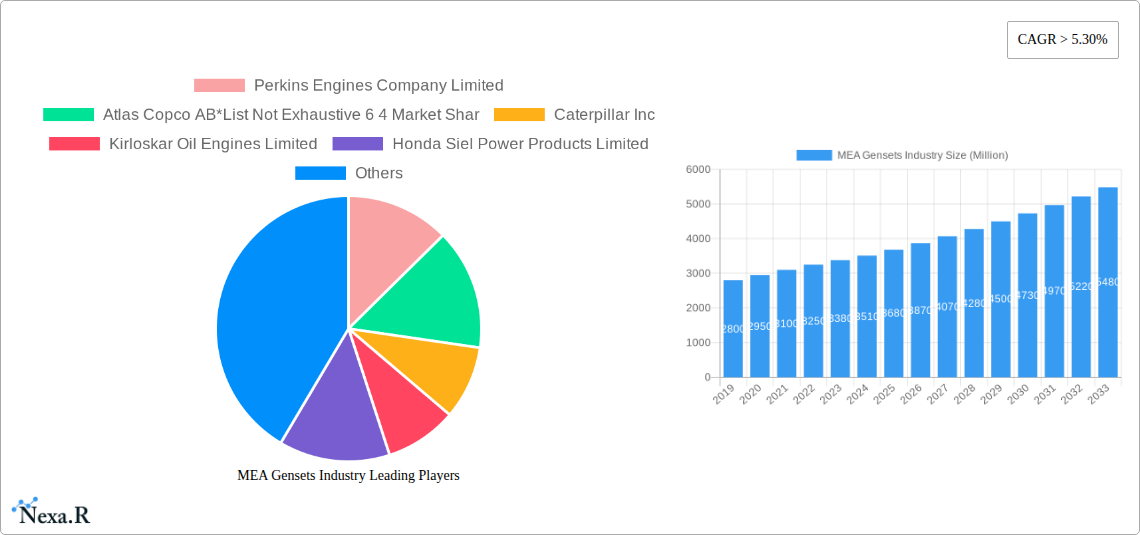
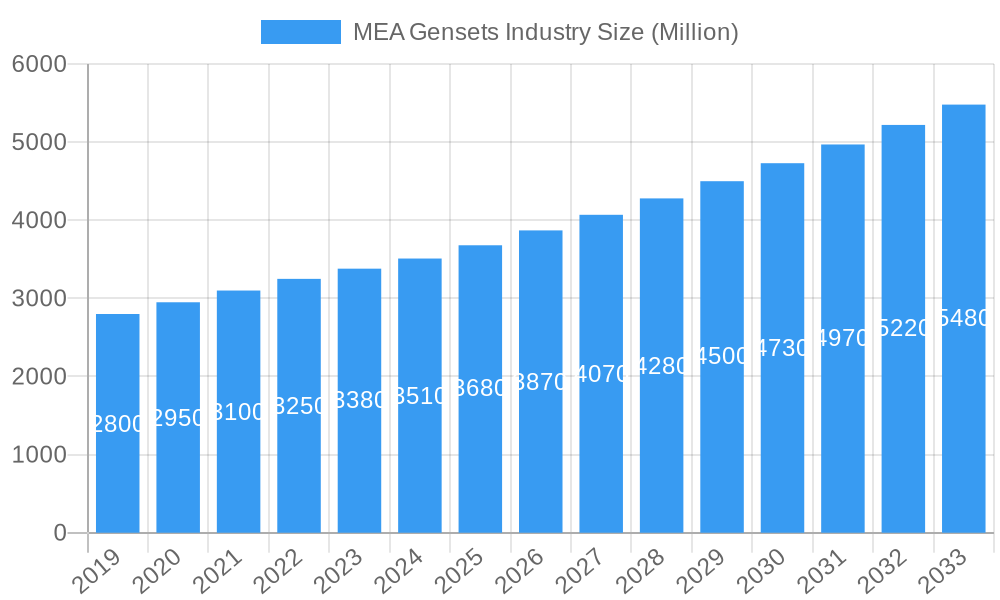
The Middle East and Africa (MEA) Gensets Industry is poised for robust growth, with a current market size of approximately USD 3.27 billion. Driven by a projected Compound Annual Growth Rate (CAGR) exceeding 5.30% from 2019 to 2033, the market is expected to witness significant expansion. Key growth drivers include the increasing demand for reliable power solutions across various sectors such as industrial, commercial, and residential, particularly in developing economies within the region. The need for continuous power supply to mitigate disruptions caused by aging grid infrastructure, rising electricity demand, and the growing adoption of backup power solutions for critical facilities like data centers, hospitals, and telecommunication networks are substantial contributors. Furthermore, the increasing focus on industrialization and infrastructure development, especially in countries like Nigeria, Saudi Arabia, and the UAE, fuels the demand for prime power generation, further bolstering market expansion.
MEA Gensets Industry Market Size (In Billion)
The MEA Gensets Industry is segmented by fuel type, power ratings, and application, offering a diverse range of solutions. Natural gas and diesel gensets dominate the fuel type segment, catering to different operational needs and fuel availability. In terms of power ratings, the 75-375 kVA and Above 375 kVA segments are experiencing strong traction due to the increasing power requirements of commercial and industrial applications. The application landscape is primarily divided between backup power and prime power solutions, with peak shaving applications gaining prominence in regions with volatile electricity prices and grid instability. Emerging trends include the increasing adoption of hybrid genset solutions and a growing interest in more fuel-efficient and environmentally compliant models. However, the market faces certain restraints, including fluctuating fuel prices, intense price competition, and the high initial investment costs associated with advanced genset technologies. Despite these challenges, the strategic importance of uninterrupted power supply in the MEA region ensures a positive outlook for the gensets market.
MEA Gensets Industry Company Market Share
This comprehensive report delves into the dynamic Middle East and Africa (MEA) Gensets industry, providing an in-depth analysis of market trends, growth drivers, and future opportunities. With a focus on key segments, leading players, and regional dominance, this report offers actionable insights for industry professionals seeking to capitalize on the expanding power generation landscape. The study covers the Study Period: 2019–2033, with Base Year: 2025, Estimated Year: 2025, and a Forecast Period: 2025–2033. Historical Period: 2019–2024. All values are presented in Million units.
MEA Gensets Industry Market Dynamics & Structure
The MEA Gensets industry is characterized by a moderately consolidated market structure, with major global players and robust regional manufacturers vying for market share. Technological innovation is a primary driver, fueled by the increasing demand for reliable and efficient power solutions across various sectors. Regulatory frameworks, while evolving, are increasingly supporting the adoption of advanced genset technologies and cleaner fuel options. Competitive product substitutes, such as grid expansion and renewable energy sources, are present but often complement rather than replace gensets, particularly in regions with grid instability. End-user demographics are diverse, spanning industrial, commercial, residential, and utility sectors, each with specific power requirements. Mergers and acquisitions (M&A) trends indicate strategic consolidation as companies aim to expand their product portfolios and geographical reach. For instance, the market has witnessed xx M&A deal volumes in the historical period. Key innovation barriers include the high initial cost of advanced technologies and the need for skilled labor for installation and maintenance.
- Market Concentration: Moderately consolidated with a blend of global and regional players.
- Technological Innovation Drivers: Demand for reliability, efficiency, and emissions reduction.
- Regulatory Frameworks: Evolving policies supporting modern power solutions and cleaner energy.
- Competitive Product Substitutes: Grid expansion, renewable energy projects.
- End-User Demographics: Diverse industrial, commercial, residential, and utility needs.
- M&A Trends: Strategic consolidation to enhance market presence and product offerings.
MEA Gensets Industry Growth Trends & Insights
The MEA Gensets industry is poised for significant growth, driven by a confluence of factors including rapid industrialization, urbanization, and the ongoing need for stable power supply in a region often challenged by grid infrastructure limitations. The market size is projected to expand from an estimated XX million units in 2025 to XX million units by 2033, exhibiting a Compound Annual Growth Rate (CAGR) of approximately XX% during the forecast period. Adoption rates of advanced genset technologies, including hybrid and fuel-efficient models, are on the rise as businesses and governments prioritize operational efficiency and environmental compliance. Technological disruptions, such as the integration of smart controls and IoT capabilities for remote monitoring and predictive maintenance, are transforming the product landscape. Consumer behavior shifts are also evident, with an increasing preference for backup power solutions to mitigate disruptions caused by intermittent grid supply and a growing interest in energy independence. The 0 - 75 kVA segment is expected to witness substantial penetration due to its widespread application in small businesses and residential settings, while the Above 375 kVA segment will see robust demand from large industrial and utility projects. The Diesel fuel type will continue to dominate in the historical period, but Natural Gas gensets are expected to gain traction driven by increasing availability and favorable pricing.
Dominant Regions, Countries, or Segments in MEA Gensets Industry
Saudi Arabia is emerging as a dominant force in the MEA Gensets industry, driven by its ambitious Vision 2030 initiatives that focus on economic diversification and massive infrastructure development. The kingdom's substantial investments in industrial zones, petrochemical facilities, and burgeoning tourism projects necessitate a reliable and robust power infrastructure, making gensets indispensable. The Above 375 kVA segment is particularly strong in Saudi Arabia, catering to the immense power demands of large-scale industrial operations and critical infrastructure projects like smart cities and major construction endeavors. Furthermore, the government's commitment to reducing reliance on oil for power generation is indirectly boosting the demand for alternative fuel gensets and advanced diesel solutions.
Key drivers of dominance in Saudi Arabia include:
- Massive Infrastructure Development: Projects like NEOM and Red Sea Project require significant and continuous power supply.
- Industrial Expansion: Growth in manufacturing, petrochemicals, and mining sectors fuels demand for prime and backup power.
- Grid Modernization Efforts: While grid improvements are underway, gensets remain crucial for ensuring uninterrupted operations.
- Strategic Geographic Location: Positioned as a hub for trade and industry, requiring reliable power for businesses.
In terms of segments, Backup Power applications are a primary growth engine across the entire MEA region, and particularly prominent in countries with less stable grid infrastructure like Nigeria and South Africa. The increasing frequency of power outages necessitates robust backup solutions for commercial establishments, healthcare facilities, and critical public services. However, Prime Power applications are gaining momentum in developing regions where grid access is limited or non-existent, making standalone gensets the primary source of electricity. The Diesel fuel type, while facing increasing scrutiny due to environmental concerns, continues to hold a significant market share owing to its established infrastructure and cost-effectiveness. Nevertheless, the market is witnessing a gradual shift towards Natural Gas gensets, especially in countries with accessible natural gas reserves and supportive policies aimed at reducing carbon emissions. The Rest of Middle-East and Africa region, encompassing a diverse range of economies, presents a mixed but generally upward growth trajectory, driven by a combination of industrialization and the need to electrify underserved areas.
MEA Gensets Industry Product Landscape
The MEA Gensets industry is witnessing a surge in product innovations focused on enhancing efficiency, reliability, and environmental sustainability. Manufacturers are actively developing advanced diesel engines with improved fuel injection systems and emissions control technologies to meet stricter environmental regulations. Hybrid gensets, combining diesel engines with battery storage, are gaining traction for their ability to optimize fuel consumption and reduce operational costs, particularly for prime power applications. Furthermore, the increasing availability of natural gas is driving the development of natural gas-powered gensets, offering a cleaner and often more cost-effective alternative. Smart features, including remote monitoring, automatic load management, and predictive maintenance capabilities through IoT integration, are becoming standard offerings, enhancing operational oversight and minimizing downtime. The performance metrics increasingly emphasized include fuel efficiency (liters per hour per kVA), noise reduction levels, and extended service intervals, catering to a market seeking both operational excellence and reduced environmental impact.
Key Drivers, Barriers & Challenges in MEA Gensets Industry
Key Drivers:
- Robust Economic Growth and Industrialization: Rapid expansion in manufacturing, oil & gas, construction, and mining sectors across MEA fuels demand for reliable power.
- Infrastructure Development: Significant investments in new infrastructure projects, including smart cities, airports, and transportation networks, require substantial and uninterrupted power.
- Increasing Power Deficits and Grid Instability: Many MEA countries face challenges with inconsistent grid supply, making backup power solutions critical for businesses and essential services.
- Urbanization and Growing Population: The rise of urban centers and increasing population density drive demand for power across residential, commercial, and industrial applications.
- Technological Advancements: Innovations in fuel efficiency, emissions control, and smart features are making gensets more attractive and competitive.
Barriers & Challenges:
- Fluctuating Fuel Prices: Volatility in diesel and natural gas prices can impact operational costs and the economic viability of genset investments.
- Regulatory Hurdles and Emissions Standards: Evolving environmental regulations and the need for compliance with stricter emissions standards can pose challenges for manufacturers and end-users.
- High Initial Investment Costs: Advanced and high-capacity gensets can involve significant upfront capital expenditure, which can be a barrier for smaller businesses and developing economies.
- Supply Chain Disruptions: Geopolitical factors and global logistics challenges can affect the availability and timely delivery of gensets and spare parts, impacting maintenance and deployment schedules.
- Competition from Renewable Energy: The growing adoption of solar and wind power, particularly for grid-connected applications, presents a competitive substitute in some scenarios, though often complementary.
Emerging Opportunities in MEA Gensets Industry
Emerging opportunities in the MEA Gensets industry are primarily driven by the increasing adoption of hybrid power solutions and the demand for cleaner energy alternatives. The push towards decarbonization and sustainability is creating a growing market for natural gas and even hydrogen-powered gensets. Furthermore, the expansion of smart grids and the integration of renewable energy sources are opening doors for advanced genset solutions that can provide grid stabilization and energy storage capabilities. Untapped markets in sub-Saharan Africa, particularly in rural electrification projects and small-to-medium enterprises, represent significant growth potential. Innovative applications in sectors like data centers, telecommunications, and remote industrial operations, where continuous and highly reliable power is paramount, are also creating new avenues for market expansion. The evolving consumer preference for more energy-efficient and environmentally friendly power generation solutions will continue to shape product development and market strategies.
Growth Accelerators in the MEA Gensets Industry Industry
Long-term growth in the MEA Gensets industry is being significantly accelerated by substantial government investments in infrastructure and economic diversification programs across key nations like Saudi Arabia and the UAE. These initiatives are creating sustained demand for power generation solutions to support new industrial hubs, urban developments, and critical facilities. Technological breakthroughs in fuel efficiency and emissions reduction, coupled with the increasing affordability of natural gas, are making gensets more economically viable and environmentally responsible, thereby broadening their appeal. Strategic partnerships between global manufacturers and local distributors are enhancing market penetration and after-sales support, particularly in geographically diverse and challenging markets. The growing awareness of the need for energy security and resilience in the face of climate change and geopolitical uncertainties is further solidifying the role of gensets as a vital component of power infrastructure.
Key Players Shaping the MEA Gensets Industry Market
- Perkins Engines Company Limited
- Atlas Copco AB
- Caterpillar Inc
- Kirloskar Oil Engines Limited
- Honda Siel Power Products Limited
- Cummins Inc
- Yanmar Holdings Co Ltd
- Mitsubishi Heavy Industries Ltd
- Kohler Co.
- MTU Onsite Energy (a Rolls-Royce Power Systems company)
Notable Milestones in MEA Gensets Industry Sector
- Dec 2023: Nigeria received a USD 750 million loan from the World Bank for the DARES project. The project aims to provide about 17.5 million Nigerians with access to electricity and eliminate noisy and polluting diesel generators with clean energy in Nigeria. This initiative is expected to significantly boost the demand for cleaner power solutions and potentially drive the adoption of advanced genset technologies or their replacement.
- Mar 2023: Energys Australia announced that the company rolled out a portable, 1.3 megawatt (MW) fuel cell to support the Extreme E electric vehicle rally held in Saudi Arabia. This showcases the increasing integration of advanced power solutions, including fuel cells, in niche and demanding applications, hinting at future diversification beyond traditional gensets.
In-Depth MEA Gensets Industry Market Outlook
The MEA Gensets industry is on a robust growth trajectory, propelled by a combination of ongoing infrastructure development, industrial expansion, and the persistent need for reliable power supply. The projected market expansion underscores significant opportunities for both established and emerging players. Strategic imperatives for companies will revolve around aligning product offerings with the increasing demand for hybrid and natural gas gensets, alongside continued innovation in smart technologies for enhanced operational efficiency and predictive maintenance. Furthermore, capitalizing on the growing focus on sustainability will be crucial, with a potential shift towards exploring alternative fuels and cleaner energy integration. The expansion into underserved regions within the MEA, coupled with strategic partnerships and a keen understanding of local regulatory landscapes, will be key to unlocking the full market potential and securing long-term growth in this vital sector.
MEA Gensets Industry Segmentation
-
1. Fuel Type
- 1.1. Natural Gas
- 1.2. Diesel
- 1.3. Other Fuel Types
-
2. Ratings
- 2.1. 0 - 75 kVA
- 2.2. 75 - 375 kVA
- 2.3. Above 375 kVA
-
3. Application
- 3.1. Prime Power
- 3.2. Backup Power
- 3.3. Peak Shaving
-
4. Geography
- 4.1. Nigeria
- 4.2. Saudi Arabia
- 4.3. South Africa
- 4.4. United Arab Emirates
- 4.5. Qatar
- 4.6. Rest of Middle-East and Africa
MEA Gensets Industry Segmentation By Geography
- 1. Nigeria
- 2. Saudi Arabia
- 3. South Africa
- 4. United Arab Emirates
- 5. Qatar
- 6. Rest of Middle East and Africa
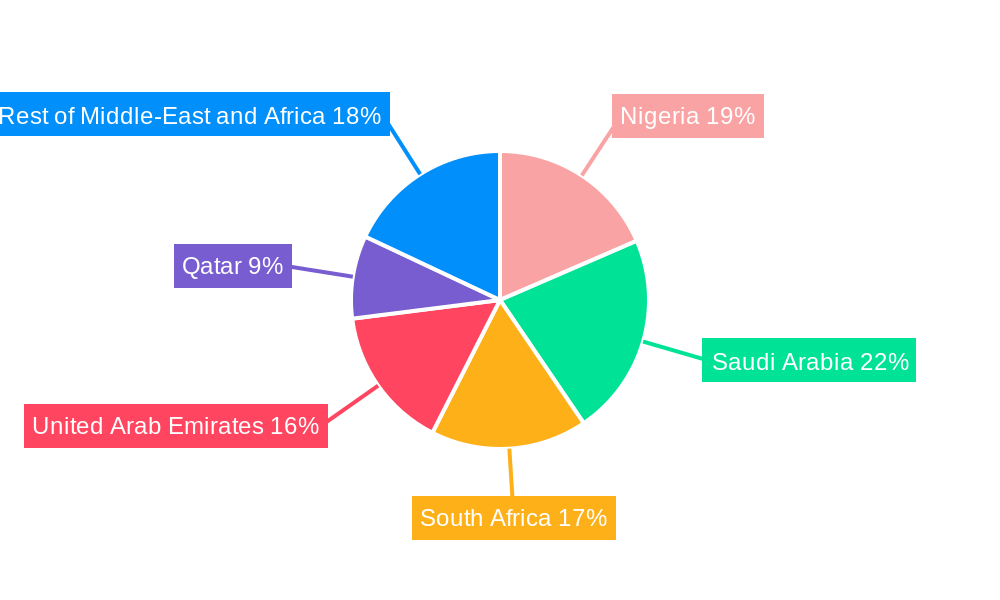
MEA Gensets Industry Regional Market Share
Geographic Coverage of MEA Gensets Industry
MEA Gensets Industry REPORT HIGHLIGHTS
| Aspects | Details |
|---|---|
| Study Period | 2020-2034 |
| Base Year | 2025 |
| Estimated Year | 2026 |
| Forecast Period | 2026-2034 |
| Historical Period | 2020-2025 |
| Growth Rate | CAGR of > 5.30% from 2020-2034 |
| Segmentation |
|
Table of Contents
- 1. Introduction
- 1.1. Research Scope
- 1.2. Market Segmentation
- 1.3. Research Objective
- 1.4. Definitions and Assumptions
- 2. Executive Summary
- 2.1. Market Snapshot
- 3. Market Dynamics
- 3.1. Market Drivers
- 3.2. Market Restrains
- 3.3. Market Trends
- 3.4. Market Opportunities
- 4. Market Factor Analysis
- 4.1. Porters Five Forces
- 4.1.1. Bargaining Power of Suppliers
- 4.1.2. Bargaining Power of Buyers
- 4.1.3. Threat of New Entrants
- 4.1.4. Threat of Substitutes
- 4.1.5. Competitive Rivalry
- 4.2. PESTEL analysis
- 4.3. BCG Analysis
- 4.3.1. Stars (High Growth, High Market Share)
- 4.3.2. Cash Cows (Low Growth, High Market Share)
- 4.3.3. Question Mark (High Growth, Low Market Share)
- 4.3.4. Dogs (Low Growth, Low Market Share)
- 4.4. Ansoff Matrix Analysis
- 4.5. Supply Chain Analysis
- 4.6. Regulatory Landscape
- 4.7. Current Market Potential and Opportunity Assessment (TAM–SAM–SOM Framework)
- 4.8. NRP Analyst Note
- 4.1. Porters Five Forces
- 5. Market Analysis, Insights and Forecast 2021-2033
- 5.1. Market Analysis, Insights and Forecast - by Fuel Type
- 5.1.1. Natural Gas
- 5.1.2. Diesel
- 5.1.3. Other Fuel Types
- 5.2. Market Analysis, Insights and Forecast - by Ratings
- 5.2.1. 0 - 75 kVA
- 5.2.2. 75 - 375 kVA
- 5.2.3. Above 375 kVA
- 5.3. Market Analysis, Insights and Forecast - by Application
- 5.3.1. Prime Power
- 5.3.2. Backup Power
- 5.3.3. Peak Shaving
- 5.4. Market Analysis, Insights and Forecast - by Geography
- 5.4.1. Nigeria
- 5.4.2. Saudi Arabia
- 5.4.3. South Africa
- 5.4.4. United Arab Emirates
- 5.4.5. Qatar
- 5.4.6. Rest of Middle-East and Africa
- 5.5. Market Analysis, Insights and Forecast - by Region
- 5.5.1. Nigeria
- 5.5.2. Saudi Arabia
- 5.5.3. South Africa
- 5.5.4. United Arab Emirates
- 5.5.5. Qatar
- 5.5.6. Rest of Middle East and Africa
- 5.1. Market Analysis, Insights and Forecast - by Fuel Type
- 6. Global MEA Gensets Industry Analysis, Insights and Forecast, 2021-2033
- 6.1. Market Analysis, Insights and Forecast - by Fuel Type
- 6.1.1. Natural Gas
- 6.1.2. Diesel
- 6.1.3. Other Fuel Types
- 6.2. Market Analysis, Insights and Forecast - by Ratings
- 6.2.1. 0 - 75 kVA
- 6.2.2. 75 - 375 kVA
- 6.2.3. Above 375 kVA
- 6.3. Market Analysis, Insights and Forecast - by Application
- 6.3.1. Prime Power
- 6.3.2. Backup Power
- 6.3.3. Peak Shaving
- 6.4. Market Analysis, Insights and Forecast - by Geography
- 6.4.1. Nigeria
- 6.4.2. Saudi Arabia
- 6.4.3. South Africa
- 6.4.4. United Arab Emirates
- 6.4.5. Qatar
- 6.4.6. Rest of Middle-East and Africa
- 6.1. Market Analysis, Insights and Forecast - by Fuel Type
- 7. Nigeria MEA Gensets Industry Analysis, Insights and Forecast, 2020-2032
- 7.1. Market Analysis, Insights and Forecast - by Fuel Type
- 7.1.1. Natural Gas
- 7.1.2. Diesel
- 7.1.3. Other Fuel Types
- 7.2. Market Analysis, Insights and Forecast - by Ratings
- 7.2.1. 0 - 75 kVA
- 7.2.2. 75 - 375 kVA
- 7.2.3. Above 375 kVA
- 7.3. Market Analysis, Insights and Forecast - by Application
- 7.3.1. Prime Power
- 7.3.2. Backup Power
- 7.3.3. Peak Shaving
- 7.4. Market Analysis, Insights and Forecast - by Geography
- 7.4.1. Nigeria
- 7.4.2. Saudi Arabia
- 7.4.3. South Africa
- 7.4.4. United Arab Emirates
- 7.4.5. Qatar
- 7.4.6. Rest of Middle-East and Africa
- 7.1. Market Analysis, Insights and Forecast - by Fuel Type
- 8. Saudi Arabia MEA Gensets Industry Analysis, Insights and Forecast, 2020-2032
- 8.1. Market Analysis, Insights and Forecast - by Fuel Type
- 8.1.1. Natural Gas
- 8.1.2. Diesel
- 8.1.3. Other Fuel Types
- 8.2. Market Analysis, Insights and Forecast - by Ratings
- 8.2.1. 0 - 75 kVA
- 8.2.2. 75 - 375 kVA
- 8.2.3. Above 375 kVA
- 8.3. Market Analysis, Insights and Forecast - by Application
- 8.3.1. Prime Power
- 8.3.2. Backup Power
- 8.3.3. Peak Shaving
- 8.4. Market Analysis, Insights and Forecast - by Geography
- 8.4.1. Nigeria
- 8.4.2. Saudi Arabia
- 8.4.3. South Africa
- 8.4.4. United Arab Emirates
- 8.4.5. Qatar
- 8.4.6. Rest of Middle-East and Africa
- 8.1. Market Analysis, Insights and Forecast - by Fuel Type
- 9. South Africa MEA Gensets Industry Analysis, Insights and Forecast, 2020-2032
- 9.1. Market Analysis, Insights and Forecast - by Fuel Type
- 9.1.1. Natural Gas
- 9.1.2. Diesel
- 9.1.3. Other Fuel Types
- 9.2. Market Analysis, Insights and Forecast - by Ratings
- 9.2.1. 0 - 75 kVA
- 9.2.2. 75 - 375 kVA
- 9.2.3. Above 375 kVA
- 9.3. Market Analysis, Insights and Forecast - by Application
- 9.3.1. Prime Power
- 9.3.2. Backup Power
- 9.3.3. Peak Shaving
- 9.4. Market Analysis, Insights and Forecast - by Geography
- 9.4.1. Nigeria
- 9.4.2. Saudi Arabia
- 9.4.3. South Africa
- 9.4.4. United Arab Emirates
- 9.4.5. Qatar
- 9.4.6. Rest of Middle-East and Africa
- 9.1. Market Analysis, Insights and Forecast - by Fuel Type
- 10. United Arab Emirates MEA Gensets Industry Analysis, Insights and Forecast, 2020-2032
- 10.1. Market Analysis, Insights and Forecast - by Fuel Type
- 10.1.1. Natural Gas
- 10.1.2. Diesel
- 10.1.3. Other Fuel Types
- 10.2. Market Analysis, Insights and Forecast - by Ratings
- 10.2.1. 0 - 75 kVA
- 10.2.2. 75 - 375 kVA
- 10.2.3. Above 375 kVA
- 10.3. Market Analysis, Insights and Forecast - by Application
- 10.3.1. Prime Power
- 10.3.2. Backup Power
- 10.3.3. Peak Shaving
- 10.4. Market Analysis, Insights and Forecast - by Geography
- 10.4.1. Nigeria
- 10.4.2. Saudi Arabia
- 10.4.3. South Africa
- 10.4.4. United Arab Emirates
- 10.4.5. Qatar
- 10.4.6. Rest of Middle-East and Africa
- 10.1. Market Analysis, Insights and Forecast - by Fuel Type
- 11. Qatar MEA Gensets Industry Analysis, Insights and Forecast, 2020-2032
- 11.1. Market Analysis, Insights and Forecast - by Fuel Type
- 11.1.1. Natural Gas
- 11.1.2. Diesel
- 11.1.3. Other Fuel Types
- 11.2. Market Analysis, Insights and Forecast - by Ratings
- 11.2.1. 0 - 75 kVA
- 11.2.2. 75 - 375 kVA
- 11.2.3. Above 375 kVA
- 11.3. Market Analysis, Insights and Forecast - by Application
- 11.3.1. Prime Power
- 11.3.2. Backup Power
- 11.3.3. Peak Shaving
- 11.4. Market Analysis, Insights and Forecast - by Geography
- 11.4.1. Nigeria
- 11.4.2. Saudi Arabia
- 11.4.3. South Africa
- 11.4.4. United Arab Emirates
- 11.4.5. Qatar
- 11.4.6. Rest of Middle-East and Africa
- 11.1. Market Analysis, Insights and Forecast - by Fuel Type
- 12. Rest of Middle East and Africa MEA Gensets Industry Analysis, Insights and Forecast, 2020-2032
- 12.1. Market Analysis, Insights and Forecast - by Fuel Type
- 12.1.1. Natural Gas
- 12.1.2. Diesel
- 12.1.3. Other Fuel Types
- 12.2. Market Analysis, Insights and Forecast - by Ratings
- 12.2.1. 0 - 75 kVA
- 12.2.2. 75 - 375 kVA
- 12.2.3. Above 375 kVA
- 12.3. Market Analysis, Insights and Forecast - by Application
- 12.3.1. Prime Power
- 12.3.2. Backup Power
- 12.3.3. Peak Shaving
- 12.4. Market Analysis, Insights and Forecast - by Geography
- 12.4.1. Nigeria
- 12.4.2. Saudi Arabia
- 12.4.3. South Africa
- 12.4.4. United Arab Emirates
- 12.4.5. Qatar
- 12.4.6. Rest of Middle-East and Africa
- 12.1. Market Analysis, Insights and Forecast - by Fuel Type
- 13. Competitive Analysis
- 13.1. Company Profiles
- 13.1.1 Perkins Engines Company Limited
- 13.1.1.1. Company Overview
- 13.1.1.2. Products
- 13.1.1.3. Company Financials
- 13.1.1.4. SWOT Analysis
- 13.1.2 Atlas Copco AB*List Not Exhaustive 6 4 Market Shar
- 13.1.2.1. Company Overview
- 13.1.2.2. Products
- 13.1.2.3. Company Financials
- 13.1.2.4. SWOT Analysis
- 13.1.3 Caterpillar Inc
- 13.1.3.1. Company Overview
- 13.1.3.2. Products
- 13.1.3.3. Company Financials
- 13.1.3.4. SWOT Analysis
- 13.1.4 Kirloskar Oil Engines Limited
- 13.1.4.1. Company Overview
- 13.1.4.2. Products
- 13.1.4.3. Company Financials
- 13.1.4.4. SWOT Analysis
- 13.1.5 Honda Siel Power Products Limited
- 13.1.5.1. Company Overview
- 13.1.5.2. Products
- 13.1.5.3. Company Financials
- 13.1.5.4. SWOT Analysis
- 13.1.6 Cummins Inc
- 13.1.6.1. Company Overview
- 13.1.6.2. Products
- 13.1.6.3. Company Financials
- 13.1.6.4. SWOT Analysis
- 13.1.7 Yanmar Holdings Co Ltd
- 13.1.7.1. Company Overview
- 13.1.7.2. Products
- 13.1.7.3. Company Financials
- 13.1.7.4. SWOT Analysis
- 13.1.8 Mitsubishi Heavy Industries Ltd
- 13.1.8.1. Company Overview
- 13.1.8.2. Products
- 13.1.8.3. Company Financials
- 13.1.8.4. SWOT Analysis
- 13.1.9 Kohler Co.
- 13.1.9.1. Company Overview
- 13.1.9.2. Products
- 13.1.9.3. Company Financials
- 13.1.9.4. SWOT Analysis
- 13.1.10 MTU Onsite Energy (a Rolls-Royce Power Systems company)
- 13.1.10.1. Company Overview
- 13.1.10.2. Products
- 13.1.10.3. Company Financials
- 13.1.10.4. SWOT Analysis
- 13.1.1 Perkins Engines Company Limited
- 13.2. Market Entropy
- 13.2.1 Company's Key Areas Served
- 13.2.2 Recent Developments
- 13.3. Company Market Share Analysis 2025
- 13.3.1 Top 5 Companies Market Share Analysis
- 13.3.2 Top 3 Companies Market Share Analysis
- 13.4. List of Potential Customers
- 14. Research Methodology
List of Figures
- Figure 1: Global MEA Gensets Industry Revenue Breakdown (Million, %) by Region 2025 & 2033
- Figure 2: Global MEA Gensets Industry Volume Breakdown (Gigawatt, %) by Region 2025 & 2033
- Figure 3: Nigeria MEA Gensets Industry Revenue (Million), by Fuel Type 2025 & 2033
- Figure 4: Nigeria MEA Gensets Industry Volume (Gigawatt), by Fuel Type 2025 & 2033
- Figure 5: Nigeria MEA Gensets Industry Revenue Share (%), by Fuel Type 2025 & 2033
- Figure 6: Nigeria MEA Gensets Industry Volume Share (%), by Fuel Type 2025 & 2033
- Figure 7: Nigeria MEA Gensets Industry Revenue (Million), by Ratings 2025 & 2033
- Figure 8: Nigeria MEA Gensets Industry Volume (Gigawatt), by Ratings 2025 & 2033
- Figure 9: Nigeria MEA Gensets Industry Revenue Share (%), by Ratings 2025 & 2033
- Figure 10: Nigeria MEA Gensets Industry Volume Share (%), by Ratings 2025 & 2033
- Figure 11: Nigeria MEA Gensets Industry Revenue (Million), by Application 2025 & 2033
- Figure 12: Nigeria MEA Gensets Industry Volume (Gigawatt), by Application 2025 & 2033
- Figure 13: Nigeria MEA Gensets Industry Revenue Share (%), by Application 2025 & 2033
- Figure 14: Nigeria MEA Gensets Industry Volume Share (%), by Application 2025 & 2033
- Figure 15: Nigeria MEA Gensets Industry Revenue (Million), by Geography 2025 & 2033
- Figure 16: Nigeria MEA Gensets Industry Volume (Gigawatt), by Geography 2025 & 2033
- Figure 17: Nigeria MEA Gensets Industry Revenue Share (%), by Geography 2025 & 2033
- Figure 18: Nigeria MEA Gensets Industry Volume Share (%), by Geography 2025 & 2033
- Figure 19: Nigeria MEA Gensets Industry Revenue (Million), by Country 2025 & 2033
- Figure 20: Nigeria MEA Gensets Industry Volume (Gigawatt), by Country 2025 & 2033
- Figure 21: Nigeria MEA Gensets Industry Revenue Share (%), by Country 2025 & 2033
- Figure 22: Nigeria MEA Gensets Industry Volume Share (%), by Country 2025 & 2033
- Figure 23: Saudi Arabia MEA Gensets Industry Revenue (Million), by Fuel Type 2025 & 2033
- Figure 24: Saudi Arabia MEA Gensets Industry Volume (Gigawatt), by Fuel Type 2025 & 2033
- Figure 25: Saudi Arabia MEA Gensets Industry Revenue Share (%), by Fuel Type 2025 & 2033
- Figure 26: Saudi Arabia MEA Gensets Industry Volume Share (%), by Fuel Type 2025 & 2033
- Figure 27: Saudi Arabia MEA Gensets Industry Revenue (Million), by Ratings 2025 & 2033
- Figure 28: Saudi Arabia MEA Gensets Industry Volume (Gigawatt), by Ratings 2025 & 2033
- Figure 29: Saudi Arabia MEA Gensets Industry Revenue Share (%), by Ratings 2025 & 2033
- Figure 30: Saudi Arabia MEA Gensets Industry Volume Share (%), by Ratings 2025 & 2033
- Figure 31: Saudi Arabia MEA Gensets Industry Revenue (Million), by Application 2025 & 2033
- Figure 32: Saudi Arabia MEA Gensets Industry Volume (Gigawatt), by Application 2025 & 2033
- Figure 33: Saudi Arabia MEA Gensets Industry Revenue Share (%), by Application 2025 & 2033
- Figure 34: Saudi Arabia MEA Gensets Industry Volume Share (%), by Application 2025 & 2033
- Figure 35: Saudi Arabia MEA Gensets Industry Revenue (Million), by Geography 2025 & 2033
- Figure 36: Saudi Arabia MEA Gensets Industry Volume (Gigawatt), by Geography 2025 & 2033
- Figure 37: Saudi Arabia MEA Gensets Industry Revenue Share (%), by Geography 2025 & 2033
- Figure 38: Saudi Arabia MEA Gensets Industry Volume Share (%), by Geography 2025 & 2033
- Figure 39: Saudi Arabia MEA Gensets Industry Revenue (Million), by Country 2025 & 2033
- Figure 40: Saudi Arabia MEA Gensets Industry Volume (Gigawatt), by Country 2025 & 2033
- Figure 41: Saudi Arabia MEA Gensets Industry Revenue Share (%), by Country 2025 & 2033
- Figure 42: Saudi Arabia MEA Gensets Industry Volume Share (%), by Country 2025 & 2033
- Figure 43: South Africa MEA Gensets Industry Revenue (Million), by Fuel Type 2025 & 2033
- Figure 44: South Africa MEA Gensets Industry Volume (Gigawatt), by Fuel Type 2025 & 2033
- Figure 45: South Africa MEA Gensets Industry Revenue Share (%), by Fuel Type 2025 & 2033
- Figure 46: South Africa MEA Gensets Industry Volume Share (%), by Fuel Type 2025 & 2033
- Figure 47: South Africa MEA Gensets Industry Revenue (Million), by Ratings 2025 & 2033
- Figure 48: South Africa MEA Gensets Industry Volume (Gigawatt), by Ratings 2025 & 2033
- Figure 49: South Africa MEA Gensets Industry Revenue Share (%), by Ratings 2025 & 2033
- Figure 50: South Africa MEA Gensets Industry Volume Share (%), by Ratings 2025 & 2033
- Figure 51: South Africa MEA Gensets Industry Revenue (Million), by Application 2025 & 2033
- Figure 52: South Africa MEA Gensets Industry Volume (Gigawatt), by Application 2025 & 2033
- Figure 53: South Africa MEA Gensets Industry Revenue Share (%), by Application 2025 & 2033
- Figure 54: South Africa MEA Gensets Industry Volume Share (%), by Application 2025 & 2033
- Figure 55: South Africa MEA Gensets Industry Revenue (Million), by Geography 2025 & 2033
- Figure 56: South Africa MEA Gensets Industry Volume (Gigawatt), by Geography 2025 & 2033
- Figure 57: South Africa MEA Gensets Industry Revenue Share (%), by Geography 2025 & 2033
- Figure 58: South Africa MEA Gensets Industry Volume Share (%), by Geography 2025 & 2033
- Figure 59: South Africa MEA Gensets Industry Revenue (Million), by Country 2025 & 2033
- Figure 60: South Africa MEA Gensets Industry Volume (Gigawatt), by Country 2025 & 2033
- Figure 61: South Africa MEA Gensets Industry Revenue Share (%), by Country 2025 & 2033
- Figure 62: South Africa MEA Gensets Industry Volume Share (%), by Country 2025 & 2033
- Figure 63: United Arab Emirates MEA Gensets Industry Revenue (Million), by Fuel Type 2025 & 2033
- Figure 64: United Arab Emirates MEA Gensets Industry Volume (Gigawatt), by Fuel Type 2025 & 2033
- Figure 65: United Arab Emirates MEA Gensets Industry Revenue Share (%), by Fuel Type 2025 & 2033
- Figure 66: United Arab Emirates MEA Gensets Industry Volume Share (%), by Fuel Type 2025 & 2033
- Figure 67: United Arab Emirates MEA Gensets Industry Revenue (Million), by Ratings 2025 & 2033
- Figure 68: United Arab Emirates MEA Gensets Industry Volume (Gigawatt), by Ratings 2025 & 2033
- Figure 69: United Arab Emirates MEA Gensets Industry Revenue Share (%), by Ratings 2025 & 2033
- Figure 70: United Arab Emirates MEA Gensets Industry Volume Share (%), by Ratings 2025 & 2033
- Figure 71: United Arab Emirates MEA Gensets Industry Revenue (Million), by Application 2025 & 2033
- Figure 72: United Arab Emirates MEA Gensets Industry Volume (Gigawatt), by Application 2025 & 2033
- Figure 73: United Arab Emirates MEA Gensets Industry Revenue Share (%), by Application 2025 & 2033
- Figure 74: United Arab Emirates MEA Gensets Industry Volume Share (%), by Application 2025 & 2033
- Figure 75: United Arab Emirates MEA Gensets Industry Revenue (Million), by Geography 2025 & 2033
- Figure 76: United Arab Emirates MEA Gensets Industry Volume (Gigawatt), by Geography 2025 & 2033
- Figure 77: United Arab Emirates MEA Gensets Industry Revenue Share (%), by Geography 2025 & 2033
- Figure 78: United Arab Emirates MEA Gensets Industry Volume Share (%), by Geography 2025 & 2033
- Figure 79: United Arab Emirates MEA Gensets Industry Revenue (Million), by Country 2025 & 2033
- Figure 80: United Arab Emirates MEA Gensets Industry Volume (Gigawatt), by Country 2025 & 2033
- Figure 81: United Arab Emirates MEA Gensets Industry Revenue Share (%), by Country 2025 & 2033
- Figure 82: United Arab Emirates MEA Gensets Industry Volume Share (%), by Country 2025 & 2033
- Figure 83: Qatar MEA Gensets Industry Revenue (Million), by Fuel Type 2025 & 2033
- Figure 84: Qatar MEA Gensets Industry Volume (Gigawatt), by Fuel Type 2025 & 2033
- Figure 85: Qatar MEA Gensets Industry Revenue Share (%), by Fuel Type 2025 & 2033
- Figure 86: Qatar MEA Gensets Industry Volume Share (%), by Fuel Type 2025 & 2033
- Figure 87: Qatar MEA Gensets Industry Revenue (Million), by Ratings 2025 & 2033
- Figure 88: Qatar MEA Gensets Industry Volume (Gigawatt), by Ratings 2025 & 2033
- Figure 89: Qatar MEA Gensets Industry Revenue Share (%), by Ratings 2025 & 2033
- Figure 90: Qatar MEA Gensets Industry Volume Share (%), by Ratings 2025 & 2033
- Figure 91: Qatar MEA Gensets Industry Revenue (Million), by Application 2025 & 2033
- Figure 92: Qatar MEA Gensets Industry Volume (Gigawatt), by Application 2025 & 2033
- Figure 93: Qatar MEA Gensets Industry Revenue Share (%), by Application 2025 & 2033
- Figure 94: Qatar MEA Gensets Industry Volume Share (%), by Application 2025 & 2033
- Figure 95: Qatar MEA Gensets Industry Revenue (Million), by Geography 2025 & 2033
- Figure 96: Qatar MEA Gensets Industry Volume (Gigawatt), by Geography 2025 & 2033
- Figure 97: Qatar MEA Gensets Industry Revenue Share (%), by Geography 2025 & 2033
- Figure 98: Qatar MEA Gensets Industry Volume Share (%), by Geography 2025 & 2033
- Figure 99: Qatar MEA Gensets Industry Revenue (Million), by Country 2025 & 2033
- Figure 100: Qatar MEA Gensets Industry Volume (Gigawatt), by Country 2025 & 2033
- Figure 101: Qatar MEA Gensets Industry Revenue Share (%), by Country 2025 & 2033
- Figure 102: Qatar MEA Gensets Industry Volume Share (%), by Country 2025 & 2033
- Figure 103: Rest of Middle East and Africa MEA Gensets Industry Revenue (Million), by Fuel Type 2025 & 2033
- Figure 104: Rest of Middle East and Africa MEA Gensets Industry Volume (Gigawatt), by Fuel Type 2025 & 2033
- Figure 105: Rest of Middle East and Africa MEA Gensets Industry Revenue Share (%), by Fuel Type 2025 & 2033
- Figure 106: Rest of Middle East and Africa MEA Gensets Industry Volume Share (%), by Fuel Type 2025 & 2033
- Figure 107: Rest of Middle East and Africa MEA Gensets Industry Revenue (Million), by Ratings 2025 & 2033
- Figure 108: Rest of Middle East and Africa MEA Gensets Industry Volume (Gigawatt), by Ratings 2025 & 2033
- Figure 109: Rest of Middle East and Africa MEA Gensets Industry Revenue Share (%), by Ratings 2025 & 2033
- Figure 110: Rest of Middle East and Africa MEA Gensets Industry Volume Share (%), by Ratings 2025 & 2033
- Figure 111: Rest of Middle East and Africa MEA Gensets Industry Revenue (Million), by Application 2025 & 2033
- Figure 112: Rest of Middle East and Africa MEA Gensets Industry Volume (Gigawatt), by Application 2025 & 2033
- Figure 113: Rest of Middle East and Africa MEA Gensets Industry Revenue Share (%), by Application 2025 & 2033
- Figure 114: Rest of Middle East and Africa MEA Gensets Industry Volume Share (%), by Application 2025 & 2033
- Figure 115: Rest of Middle East and Africa MEA Gensets Industry Revenue (Million), by Geography 2025 & 2033
- Figure 116: Rest of Middle East and Africa MEA Gensets Industry Volume (Gigawatt), by Geography 2025 & 2033
- Figure 117: Rest of Middle East and Africa MEA Gensets Industry Revenue Share (%), by Geography 2025 & 2033
- Figure 118: Rest of Middle East and Africa MEA Gensets Industry Volume Share (%), by Geography 2025 & 2033
- Figure 119: Rest of Middle East and Africa MEA Gensets Industry Revenue (Million), by Country 2025 & 2033
- Figure 120: Rest of Middle East and Africa MEA Gensets Industry Volume (Gigawatt), by Country 2025 & 2033
- Figure 121: Rest of Middle East and Africa MEA Gensets Industry Revenue Share (%), by Country 2025 & 2033
- Figure 122: Rest of Middle East and Africa MEA Gensets Industry Volume Share (%), by Country 2025 & 2033
List of Tables
- Table 1: Global MEA Gensets Industry Revenue Million Forecast, by Fuel Type 2020 & 2033
- Table 2: Global MEA Gensets Industry Volume Gigawatt Forecast, by Fuel Type 2020 & 2033
- Table 3: Global MEA Gensets Industry Revenue Million Forecast, by Ratings 2020 & 2033
- Table 4: Global MEA Gensets Industry Volume Gigawatt Forecast, by Ratings 2020 & 2033
- Table 5: Global MEA Gensets Industry Revenue Million Forecast, by Application 2020 & 2033
- Table 6: Global MEA Gensets Industry Volume Gigawatt Forecast, by Application 2020 & 2033
- Table 7: Global MEA Gensets Industry Revenue Million Forecast, by Geography 2020 & 2033
- Table 8: Global MEA Gensets Industry Volume Gigawatt Forecast, by Geography 2020 & 2033
- Table 9: Global MEA Gensets Industry Revenue Million Forecast, by Region 2020 & 2033
- Table 10: Global MEA Gensets Industry Volume Gigawatt Forecast, by Region 2020 & 2033
- Table 11: Global MEA Gensets Industry Revenue Million Forecast, by Fuel Type 2020 & 2033
- Table 12: Global MEA Gensets Industry Volume Gigawatt Forecast, by Fuel Type 2020 & 2033
- Table 13: Global MEA Gensets Industry Revenue Million Forecast, by Ratings 2020 & 2033
- Table 14: Global MEA Gensets Industry Volume Gigawatt Forecast, by Ratings 2020 & 2033
- Table 15: Global MEA Gensets Industry Revenue Million Forecast, by Application 2020 & 2033
- Table 16: Global MEA Gensets Industry Volume Gigawatt Forecast, by Application 2020 & 2033
- Table 17: Global MEA Gensets Industry Revenue Million Forecast, by Geography 2020 & 2033
- Table 18: Global MEA Gensets Industry Volume Gigawatt Forecast, by Geography 2020 & 2033
- Table 19: Global MEA Gensets Industry Revenue Million Forecast, by Country 2020 & 2033
- Table 20: Global MEA Gensets Industry Volume Gigawatt Forecast, by Country 2020 & 2033
- Table 21: Global MEA Gensets Industry Revenue Million Forecast, by Fuel Type 2020 & 2033
- Table 22: Global MEA Gensets Industry Volume Gigawatt Forecast, by Fuel Type 2020 & 2033
- Table 23: Global MEA Gensets Industry Revenue Million Forecast, by Ratings 2020 & 2033
- Table 24: Global MEA Gensets Industry Volume Gigawatt Forecast, by Ratings 2020 & 2033
- Table 25: Global MEA Gensets Industry Revenue Million Forecast, by Application 2020 & 2033
- Table 26: Global MEA Gensets Industry Volume Gigawatt Forecast, by Application 2020 & 2033
- Table 27: Global MEA Gensets Industry Revenue Million Forecast, by Geography 2020 & 2033
- Table 28: Global MEA Gensets Industry Volume Gigawatt Forecast, by Geography 2020 & 2033
- Table 29: Global MEA Gensets Industry Revenue Million Forecast, by Country 2020 & 2033
- Table 30: Global MEA Gensets Industry Volume Gigawatt Forecast, by Country 2020 & 2033
- Table 31: Global MEA Gensets Industry Revenue Million Forecast, by Fuel Type 2020 & 2033
- Table 32: Global MEA Gensets Industry Volume Gigawatt Forecast, by Fuel Type 2020 & 2033
- Table 33: Global MEA Gensets Industry Revenue Million Forecast, by Ratings 2020 & 2033
- Table 34: Global MEA Gensets Industry Volume Gigawatt Forecast, by Ratings 2020 & 2033
- Table 35: Global MEA Gensets Industry Revenue Million Forecast, by Application 2020 & 2033
- Table 36: Global MEA Gensets Industry Volume Gigawatt Forecast, by Application 2020 & 2033
- Table 37: Global MEA Gensets Industry Revenue Million Forecast, by Geography 2020 & 2033
- Table 38: Global MEA Gensets Industry Volume Gigawatt Forecast, by Geography 2020 & 2033
- Table 39: Global MEA Gensets Industry Revenue Million Forecast, by Country 2020 & 2033
- Table 40: Global MEA Gensets Industry Volume Gigawatt Forecast, by Country 2020 & 2033
- Table 41: Global MEA Gensets Industry Revenue Million Forecast, by Fuel Type 2020 & 2033
- Table 42: Global MEA Gensets Industry Volume Gigawatt Forecast, by Fuel Type 2020 & 2033
- Table 43: Global MEA Gensets Industry Revenue Million Forecast, by Ratings 2020 & 2033
- Table 44: Global MEA Gensets Industry Volume Gigawatt Forecast, by Ratings 2020 & 2033
- Table 45: Global MEA Gensets Industry Revenue Million Forecast, by Application 2020 & 2033
- Table 46: Global MEA Gensets Industry Volume Gigawatt Forecast, by Application 2020 & 2033
- Table 47: Global MEA Gensets Industry Revenue Million Forecast, by Geography 2020 & 2033
- Table 48: Global MEA Gensets Industry Volume Gigawatt Forecast, by Geography 2020 & 2033
- Table 49: Global MEA Gensets Industry Revenue Million Forecast, by Country 2020 & 2033
- Table 50: Global MEA Gensets Industry Volume Gigawatt Forecast, by Country 2020 & 2033
- Table 51: Global MEA Gensets Industry Revenue Million Forecast, by Fuel Type 2020 & 2033
- Table 52: Global MEA Gensets Industry Volume Gigawatt Forecast, by Fuel Type 2020 & 2033
- Table 53: Global MEA Gensets Industry Revenue Million Forecast, by Ratings 2020 & 2033
- Table 54: Global MEA Gensets Industry Volume Gigawatt Forecast, by Ratings 2020 & 2033
- Table 55: Global MEA Gensets Industry Revenue Million Forecast, by Application 2020 & 2033
- Table 56: Global MEA Gensets Industry Volume Gigawatt Forecast, by Application 2020 & 2033
- Table 57: Global MEA Gensets Industry Revenue Million Forecast, by Geography 2020 & 2033
- Table 58: Global MEA Gensets Industry Volume Gigawatt Forecast, by Geography 2020 & 2033
- Table 59: Global MEA Gensets Industry Revenue Million Forecast, by Country 2020 & 2033
- Table 60: Global MEA Gensets Industry Volume Gigawatt Forecast, by Country 2020 & 2033
- Table 61: Global MEA Gensets Industry Revenue Million Forecast, by Fuel Type 2020 & 2033
- Table 62: Global MEA Gensets Industry Volume Gigawatt Forecast, by Fuel Type 2020 & 2033
- Table 63: Global MEA Gensets Industry Revenue Million Forecast, by Ratings 2020 & 2033
- Table 64: Global MEA Gensets Industry Volume Gigawatt Forecast, by Ratings 2020 & 2033
- Table 65: Global MEA Gensets Industry Revenue Million Forecast, by Application 2020 & 2033
- Table 66: Global MEA Gensets Industry Volume Gigawatt Forecast, by Application 2020 & 2033
- Table 67: Global MEA Gensets Industry Revenue Million Forecast, by Geography 2020 & 2033
- Table 68: Global MEA Gensets Industry Volume Gigawatt Forecast, by Geography 2020 & 2033
- Table 69: Global MEA Gensets Industry Revenue Million Forecast, by Country 2020 & 2033
- Table 70: Global MEA Gensets Industry Volume Gigawatt Forecast, by Country 2020 & 2033
Frequently Asked Questions
1. What is the projected Compound Annual Growth Rate (CAGR) of the MEA Gensets Industry?
The projected CAGR is approximately > 5.30%.
2. Which companies are prominent players in the MEA Gensets Industry?
Key companies in the market include Perkins Engines Company Limited, Atlas Copco AB*List Not Exhaustive 6 4 Market Shar, Caterpillar Inc, Kirloskar Oil Engines Limited, Honda Siel Power Products Limited, Cummins Inc, Yanmar Holdings Co Ltd, Mitsubishi Heavy Industries Ltd, Kohler Co., MTU Onsite Energy (a Rolls-Royce Power Systems company).
3. What are the main segments of the MEA Gensets Industry?
The market segments include Fuel Type, Ratings, Application, Geography.
4. Can you provide details about the market size?
The market size is estimated to be USD 3.27 Million as of 2022.
5. What are some drivers contributing to market growth?
4.; Increasing demand for uninterrupted and reliable power supply4.; Technological Interventions in generator set technologies.
6. What are the notable trends driving market growth?
Backup Power Generators to Dominate the Market.
7. Are there any restraints impacting market growth?
4.; Availability of Cleaner Alternatives and Advancement in Battery Technologies.
8. Can you provide examples of recent developments in the market?
Dec 2023: Nigeria received a USD 750 million loan from the World Bank for the DARES project. The project aims to provide about 17.5 million Nigerians with access to electricity and eliminate noisy and polluting diesel generators with clean energy in Nigeria.
9. What pricing options are available for accessing the report?
Pricing options include single-user, multi-user, and enterprise licenses priced at USD 4750, USD 5250, and USD 8750 respectively.
10. Is the market size provided in terms of value or volume?
The market size is provided in terms of value, measured in Million and volume, measured in Gigawatt.
11. Are there any specific market keywords associated with the report?
Yes, the market keyword associated with the report is "MEA Gensets Industry," which aids in identifying and referencing the specific market segment covered.
12. How do I determine which pricing option suits my needs best?
The pricing options vary based on user requirements and access needs. Individual users may opt for single-user licenses, while businesses requiring broader access may choose multi-user or enterprise licenses for cost-effective access to the report.
13. Are there any additional resources or data provided in the MEA Gensets Industry report?
While the report offers comprehensive insights, it's advisable to review the specific contents or supplementary materials provided to ascertain if additional resources or data are available.
14. How can I stay updated on further developments or reports in the MEA Gensets Industry?
To stay informed about further developments, trends, and reports in the MEA Gensets Industry, consider subscribing to industry newsletters, following relevant companies and organizations, or regularly checking reputable industry news sources and publications.
Methodology
Step 1 - Identification of Relevant Samples Size from Population Database


Step 2 - Approaches for Defining Global Market Size (Value, Volume* & Price*)

Note*: In applicable scenarios
Step 3 - Data Sources
Primary Research
- Web Analytics
- Survey Reports
- Research Institute
- Latest Research Reports
- Opinion Leaders
Secondary Research
- Annual Reports
- White Paper
- Latest Press Release
- Industry Association
- Paid Database
- Investor Presentations

Step 4 - Data Triangulation
Involves using different sources of information in order to increase the validity of a study
These sources are likely to be stakeholders in a program - participants, other researchers, program staff, other community members, and so on.
Then we put all data in single framework & apply various statistical tools to find out the dynamic on the market.
During the analysis stage, feedback from the stakeholder groups would be compared to determine areas of agreement as well as areas of divergence