

Key Insights
The Military 3D and 4D Printing market is projected for substantial growth, driven by the demand for advanced, adaptable, and rapidly deployable defense assets. With a projected Compound Annual Growth Rate (CAGR) of 40.9%, the market is estimated to reach $307.72 million by 2025. Key growth factors include the imperative for enhanced operational effectiveness, streamlined logistics, and on-demand component manufacturing in austere environments. Additive manufacturing (AM) technologies enable the creation of intricate designs and multi-material integration for superior military equipment performance, including customized armaments, unmanned aerial vehicles (UAVs), and protective vehicles. The advent of 4D printing, featuring stimuli-responsive materials, opens avenues for adaptive camouflage, self-repairing systems, and dynamic military hardware. Despite initial investment hurdles and skill requirements, technological evolution and increased government funding are set to propel market expansion.
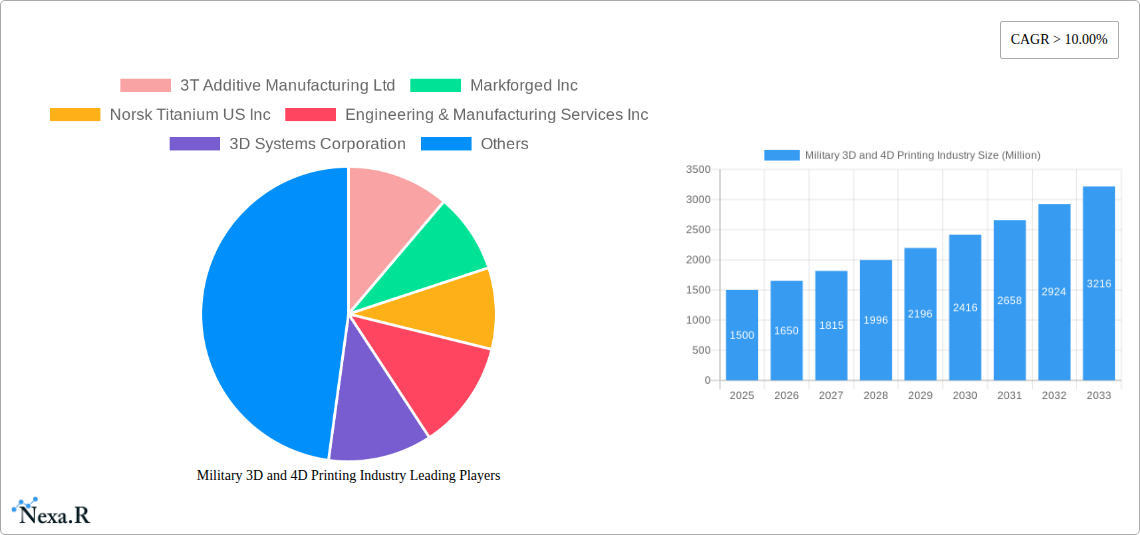
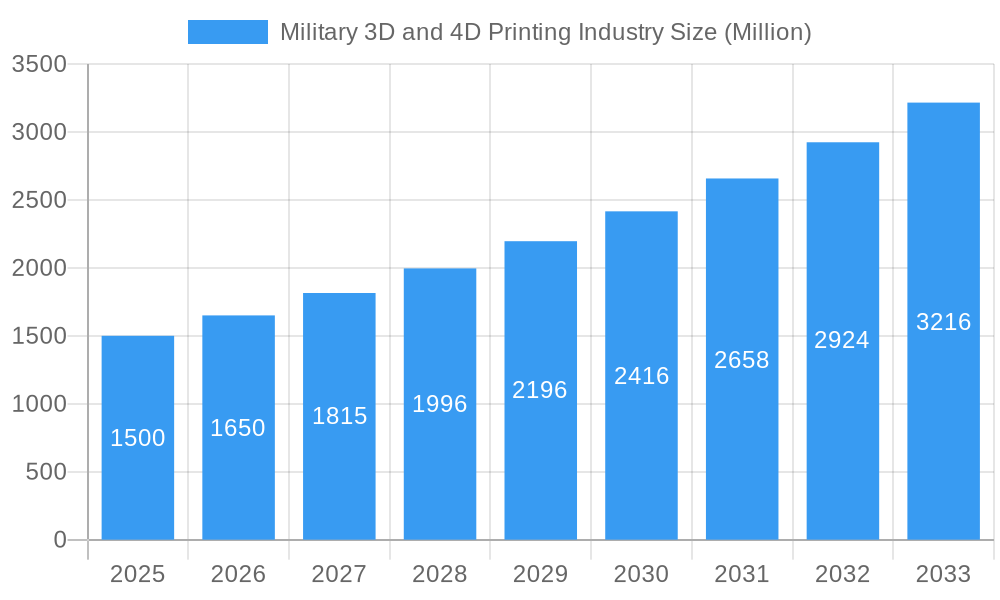
Military 3D and 4D Printing Industry Market Size (In Million)
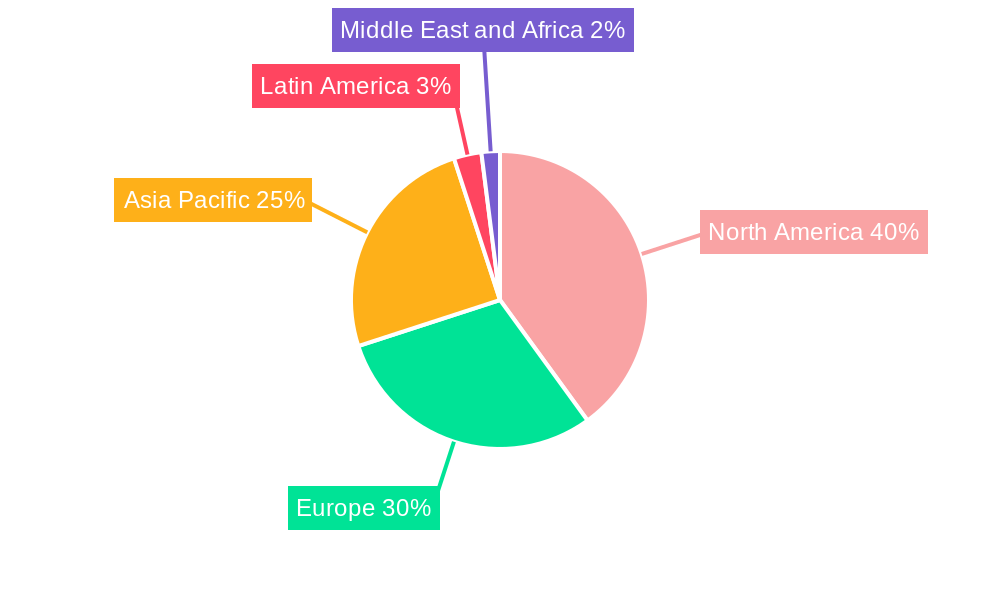
Market segmentation by platform (Airborne, Land, Sea) underscores the widespread adoption of 3D and 4D printing across military sectors. North America currently leads, owing to significant defense expenditures and technological prowess. The Asia-Pacific region is anticipated to experience rapid expansion, fueled by escalating military investments and technological progress in key nations. Europe remains a vital contributor, with notable influence from the United Kingdom and Germany. The competitive environment features established industry leaders alongside specialized emerging entities. Strategic collaborations and sustained innovation are crucial for market competitiveness. The forecast period (2025-2033) anticipates significant market expansion driven by ongoing technological advancements, broadened applications, and augmented government investment, reaching an estimated market size of $307.72 million by 2025.
Military 3D and 4D Printing Industry Company Market Share
Military 3D and 4D Printing Industry Market Report: 2019-2033
This comprehensive report provides an in-depth analysis of the Military 3D and 4D Printing market, encompassing market dynamics, growth trends, regional insights, product landscapes, and key player strategies. With a study period spanning 2019-2033, a base year of 2025, and a forecast period of 2025-2033, this report offers invaluable insights for industry professionals, investors, and strategic decision-makers. The report projects the market to reach xx Million units by 2033.
Military 3D and 4D Printing Industry Market Dynamics & Structure
The Military 3D and 4D printing market is characterized by moderate concentration, with several key players vying for market share. Technological innovation, particularly in materials science and software algorithms, is a primary driver. Stringent regulatory frameworks surrounding defense applications influence market growth, while the emergence of advanced composites and traditional manufacturing techniques presents competitive substitution pressure. End-users primarily consist of military branches (Army, Navy, Air Force) and defense contractors. M&A activity has been moderate, with a projected xx deals per year in the forecast period, driving consolidation and technological advancements.
- Market Concentration: Moderately concentrated, with the top 5 players holding approximately xx% market share in 2025.
- Technological Innovation: Rapid advancements in materials (e.g., high-strength polymers, metal alloys), printing processes (e.g., binder jetting, selective laser melting), and software (e.g., generative design) are key drivers.
- Regulatory Frameworks: Stringent quality control and safety standards for defense applications impact market access and production costs.
- Competitive Substitutes: Traditional manufacturing methods and advanced composites provide competitive pressure.
- End-User Demographics: Primarily government defense agencies and prime contractors.
- M&A Trends: Moderate activity focusing on acquiring specialized technologies and expanding market reach.
Military 3D and 4D Printing Industry Growth Trends & Insights
The Military 3D and 4D printing market is experiencing significant growth, driven by the increasing demand for customized, lightweight, and high-performance military equipment. The market size is projected to grow at a CAGR of xx% from 2025 to 2033, reaching xx Million units by 2033. This growth is fueled by technological advancements, rising defense budgets, and the need for rapid prototyping and on-demand manufacturing capabilities. Adoption rates are accelerating, particularly within the airborne segment. Consumer behavior shifts are reflected in the increased demand for customized solutions and improved supply chain resilience. The market penetration is anticipated to reach xx% by 2033. Technological disruptions, such as the emergence of 4D printing and AI-integrated design tools, are further accelerating market expansion.
Dominant Regions, Countries, or Segments in Military 3D and 4D Printing Industry
The North American region is currently the dominant market for military 3D and 4D printing, driven by substantial defense spending, a robust technological ecosystem, and the presence of major players. Within this region, the US holds the largest market share due to high military spending and proactive adoption of additive manufacturing technologies. The airborne segment exhibits the fastest growth rate due to its focus on lighter weight and higher performance aspects.
- North America: Strong defense spending, advanced technological infrastructure, and presence of key players.
- Europe: Growing adoption, driven by modernization efforts in European military forces.
- Asia-Pacific: High growth potential, fueled by increasing defense budgets in several countries.
- By Platform:
- Airborne: Fastest-growing segment, driven by the need for lightweight and high-performance aircraft parts.
- Land: Steady growth, driven by the demand for customized ground vehicles and equipment.
- Sea: Moderate growth, with applications in shipbuilding and submarine maintenance.
Military 3D and 4D Printing Industry Product Landscape
The product landscape encompasses a wide range of materials (metals, polymers, composites), printing technologies (FDM, SLA, SLS, DMLS), and software solutions (design, simulation, production management). Innovation focuses on enhancing material properties, improving printing speed and accuracy, and developing advanced software for design optimization and automation. Unique selling propositions include the ability to create complex geometries, reduce lead times, and achieve cost savings through on-demand production.
Key Drivers, Barriers & Challenges in Military 3D and 4D Printing Industry
Key Drivers:
- Increasing defense budgets globally.
- Need for lightweight and high-performance military equipment.
- Growing adoption of additive manufacturing technologies.
- Advancements in materials science and printing technologies.
Challenges & Restraints:
- High initial investment costs for equipment and materials.
- Concerns regarding material consistency and durability.
- Skilled labor shortage in additive manufacturing.
- Stringent regulatory requirements and certification processes.
Emerging Opportunities in Military 3D and 4D Printing Industry
- Expansion into emerging markets with growing defense budgets.
- Development of new materials with enhanced properties.
- Integration of artificial intelligence and machine learning for design optimization and process automation.
- Exploring applications in personalized protective equipment and medical devices.
Growth Accelerators in the Military 3D and 4D Printing Industry Industry
Long-term growth will be accelerated by strategic partnerships between technology providers and defense contractors, fostering innovation and accelerating technology adoption. Technological breakthroughs, such as the development of advanced materials and improved printing processes, will further drive market expansion. Government initiatives to promote the adoption of additive manufacturing technologies will also play a significant role in long-term growth.
Key Players Shaping the Military 3D and 4D Printing Industry Market
- 3T Additive Manufacturing Ltd
- Markforged Inc
- Norsk Titanium US Inc
- Engineering & Manufacturing Services Inc
- 3D Systems Corporation
- EOS Gmbh
- Nano Dimensions Ltd
- Stratasys Ltd
- ExOne Company
Notable Milestones in Military 3D and 4D Printing Industry Sector
- November 2022: 3D Systems and ALM partnered to expand access to industry-leading 3D printing materials, accelerating material adoption and industry growth.
- September 2021: General Lattice secured a US Army contract to develop a 3D-printed combat helmet with improved energy absorption, showcasing the potential of 3D printing for advanced military equipment.
In-Depth Military 3D and 4D Printing Industry Market Outlook
The future of the military 3D and 4D printing market is bright, with significant growth potential driven by continuous technological advancements, increasing defense spending, and the growing need for customized and on-demand manufacturing capabilities. Strategic partnerships, investments in research and development, and government support will further accelerate market expansion, creating numerous opportunities for key players and new entrants. The market is poised for substantial growth, driven by innovations in materials, processes, and software, along with expanding applications across various military platforms.
Military 3D and 4D Printing Industry Segmentation
- 1. Production Analysis
- 2. Consumption Analysis
- 3. Import Market Analysis (Value & Volume)
- 4. Export Market Analysis (Value & Volume)
- 5. Price Trend Analysis
Military 3D and 4D Printing Industry Segmentation By Geography
-
1. North America
- 1.1. United States
- 1.2. Canada
- 1.3. Mexico
-
2. South America
- 2.1. Brazil
- 2.2. Argentina
- 2.3. Rest of South America
-
3. Europe
- 3.1. United Kingdom
- 3.2. Germany
- 3.3. France
- 3.4. Italy
- 3.5. Spain
- 3.6. Russia
- 3.7. Benelux
- 3.8. Nordics
- 3.9. Rest of Europe
-
4. Middle East & Africa
- 4.1. Turkey
- 4.2. Israel
- 4.3. GCC
- 4.4. North Africa
- 4.5. South Africa
- 4.6. Rest of Middle East & Africa
-
5. Asia Pacific
- 5.1. China
- 5.2. India
- 5.3. Japan
- 5.4. South Korea
- 5.5. ASEAN
- 5.6. Oceania
- 5.7. Rest of Asia Pacific
Military 3D and 4D Printing Industry Regional Market Share
Geographic Coverage of Military 3D and 4D Printing Industry
Military 3D and 4D Printing Industry REPORT HIGHLIGHTS
| Aspects | Details |
|---|---|
| Study Period | 2020-2034 |
| Base Year | 2025 |
| Estimated Year | 2026 |
| Forecast Period | 2026-2034 |
| Historical Period | 2020-2025 |
| Growth Rate | CAGR of 35.8% from 2020-2034 |
| Segmentation |
|
Table of Contents
- 1. Introduction
- 1.1. Research Scope
- 1.2. Market Segmentation
- 1.3. Research Objective
- 1.4. Definitions and Assumptions
- 2. Executive Summary
- 2.1. Market Snapshot
- 3. Market Dynamics
- 3.1. Market Drivers
- 3.2. Market Restrains
- 3.3. Market Trends
- 3.4. Market Opportunities
- 4. Market Factor Analysis
- 4.1. Porters Five Forces
- 4.1.1. Bargaining Power of Suppliers
- 4.1.2. Bargaining Power of Buyers
- 4.1.3. Threat of New Entrants
- 4.1.4. Threat of Substitutes
- 4.1.5. Competitive Rivalry
- 4.2. PESTEL analysis
- 4.3. BCG Analysis
- 4.3.1. Stars (High Growth, High Market Share)
- 4.3.2. Cash Cows (Low Growth, High Market Share)
- 4.3.3. Question Mark (High Growth, Low Market Share)
- 4.3.4. Dogs (Low Growth, Low Market Share)
- 4.4. Ansoff Matrix Analysis
- 4.5. Supply Chain Analysis
- 4.6. Regulatory Landscape
- 4.7. Current Market Potential and Opportunity Assessment (TAM–SAM–SOM Framework)
- 4.8. NRP Analyst Note
- 4.1. Porters Five Forces
- 5. Market Analysis, Insights and Forecast 2021-2033
- 5.1. Market Analysis, Insights and Forecast - by Production Analysis
- 5.2. Market Analysis, Insights and Forecast - by Consumption Analysis
- 5.3. Market Analysis, Insights and Forecast - by Import Market Analysis (Value & Volume)
- 5.4. Market Analysis, Insights and Forecast - by Export Market Analysis (Value & Volume)
- 5.5. Market Analysis, Insights and Forecast - by Price Trend Analysis
- 5.6. Market Analysis, Insights and Forecast - by Region
- 5.6.1. North America
- 5.6.2. South America
- 5.6.3. Europe
- 5.6.4. Middle East & Africa
- 5.6.5. Asia Pacific
- 6. Global Military 3D and 4D Printing Industry Analysis, Insights and Forecast, 2021-2033
- 6.1. Market Analysis, Insights and Forecast - by Production Analysis
- 6.2. Market Analysis, Insights and Forecast - by Consumption Analysis
- 6.3. Market Analysis, Insights and Forecast - by Import Market Analysis (Value & Volume)
- 6.4. Market Analysis, Insights and Forecast - by Export Market Analysis (Value & Volume)
- 6.5. Market Analysis, Insights and Forecast - by Price Trend Analysis
- 7. North America Military 3D and 4D Printing Industry Analysis, Insights and Forecast, 2020-2032
- 7.1. Market Analysis, Insights and Forecast - by Production Analysis
- 7.2. Market Analysis, Insights and Forecast - by Consumption Analysis
- 7.3. Market Analysis, Insights and Forecast - by Import Market Analysis (Value & Volume)
- 7.4. Market Analysis, Insights and Forecast - by Export Market Analysis (Value & Volume)
- 7.5. Market Analysis, Insights and Forecast - by Price Trend Analysis
- 8. South America Military 3D and 4D Printing Industry Analysis, Insights and Forecast, 2020-2032
- 8.1. Market Analysis, Insights and Forecast - by Production Analysis
- 8.2. Market Analysis, Insights and Forecast - by Consumption Analysis
- 8.3. Market Analysis, Insights and Forecast - by Import Market Analysis (Value & Volume)
- 8.4. Market Analysis, Insights and Forecast - by Export Market Analysis (Value & Volume)
- 8.5. Market Analysis, Insights and Forecast - by Price Trend Analysis
- 9. Europe Military 3D and 4D Printing Industry Analysis, Insights and Forecast, 2020-2032
- 9.1. Market Analysis, Insights and Forecast - by Production Analysis
- 9.2. Market Analysis, Insights and Forecast - by Consumption Analysis
- 9.3. Market Analysis, Insights and Forecast - by Import Market Analysis (Value & Volume)
- 9.4. Market Analysis, Insights and Forecast - by Export Market Analysis (Value & Volume)
- 9.5. Market Analysis, Insights and Forecast - by Price Trend Analysis
- 10. Middle East & Africa Military 3D and 4D Printing Industry Analysis, Insights and Forecast, 2020-2032
- 10.1. Market Analysis, Insights and Forecast - by Production Analysis
- 10.2. Market Analysis, Insights and Forecast - by Consumption Analysis
- 10.3. Market Analysis, Insights and Forecast - by Import Market Analysis (Value & Volume)
- 10.4. Market Analysis, Insights and Forecast - by Export Market Analysis (Value & Volume)
- 10.5. Market Analysis, Insights and Forecast - by Price Trend Analysis
- 11. Asia Pacific Military 3D and 4D Printing Industry Analysis, Insights and Forecast, 2020-2032
- 11.1. Market Analysis, Insights and Forecast - by Production Analysis
- 11.2. Market Analysis, Insights and Forecast - by Consumption Analysis
- 11.3. Market Analysis, Insights and Forecast - by Import Market Analysis (Value & Volume)
- 11.4. Market Analysis, Insights and Forecast - by Export Market Analysis (Value & Volume)
- 11.5. Market Analysis, Insights and Forecast - by Price Trend Analysis
- 12. Competitive Analysis
- 12.1. Company Profiles
- 12.1.1 3T Additive Manufacturing Ltd
- 12.1.1.1. Company Overview
- 12.1.1.2. Products
- 12.1.1.3. Company Financials
- 12.1.1.4. SWOT Analysis
- 12.1.2 Markforged Inc
- 12.1.2.1. Company Overview
- 12.1.2.2. Products
- 12.1.2.3. Company Financials
- 12.1.2.4. SWOT Analysis
- 12.1.3 Norsk Titanium US Inc
- 12.1.3.1. Company Overview
- 12.1.3.2. Products
- 12.1.3.3. Company Financials
- 12.1.3.4. SWOT Analysis
- 12.1.4 Engineering & Manufacturing Services Inc
- 12.1.4.1. Company Overview
- 12.1.4.2. Products
- 12.1.4.3. Company Financials
- 12.1.4.4. SWOT Analysis
- 12.1.5 3D Systems Corporation
- 12.1.5.1. Company Overview
- 12.1.5.2. Products
- 12.1.5.3. Company Financials
- 12.1.5.4. SWOT Analysis
- 12.1.6 EOS Gmbh
- 12.1.6.1. Company Overview
- 12.1.6.2. Products
- 12.1.6.3. Company Financials
- 12.1.6.4. SWOT Analysis
- 12.1.7 Nano Dimensions Ltd
- 12.1.7.1. Company Overview
- 12.1.7.2. Products
- 12.1.7.3. Company Financials
- 12.1.7.4. SWOT Analysis
- 12.1.8 Stratasys Ltd
- 12.1.8.1. Company Overview
- 12.1.8.2. Products
- 12.1.8.3. Company Financials
- 12.1.8.4. SWOT Analysis
- 12.1.9 ExOne Company
- 12.1.9.1. Company Overview
- 12.1.9.2. Products
- 12.1.9.3. Company Financials
- 12.1.9.4. SWOT Analysis
- 12.1.1 3T Additive Manufacturing Ltd
- 12.2. Market Entropy
- 12.2.1 Company's Key Areas Served
- 12.2.2 Recent Developments
- 12.3. Company Market Share Analysis 2025
- 12.3.1 Top 5 Companies Market Share Analysis
- 12.3.2 Top 3 Companies Market Share Analysis
- 12.4. List of Potential Customers
- 13. Research Methodology
List of Figures
- Figure 1: Global Military 3D and 4D Printing Industry Revenue Breakdown (million, %) by Region 2025 & 2033
- Figure 2: North America Military 3D and 4D Printing Industry Revenue (million), by Production Analysis 2025 & 2033
- Figure 3: North America Military 3D and 4D Printing Industry Revenue Share (%), by Production Analysis 2025 & 2033
- Figure 4: North America Military 3D and 4D Printing Industry Revenue (million), by Consumption Analysis 2025 & 2033
- Figure 5: North America Military 3D and 4D Printing Industry Revenue Share (%), by Consumption Analysis 2025 & 2033
- Figure 6: North America Military 3D and 4D Printing Industry Revenue (million), by Import Market Analysis (Value & Volume) 2025 & 2033
- Figure 7: North America Military 3D and 4D Printing Industry Revenue Share (%), by Import Market Analysis (Value & Volume) 2025 & 2033
- Figure 8: North America Military 3D and 4D Printing Industry Revenue (million), by Export Market Analysis (Value & Volume) 2025 & 2033
- Figure 9: North America Military 3D and 4D Printing Industry Revenue Share (%), by Export Market Analysis (Value & Volume) 2025 & 2033
- Figure 10: North America Military 3D and 4D Printing Industry Revenue (million), by Price Trend Analysis 2025 & 2033
- Figure 11: North America Military 3D and 4D Printing Industry Revenue Share (%), by Price Trend Analysis 2025 & 2033
- Figure 12: North America Military 3D and 4D Printing Industry Revenue (million), by Country 2025 & 2033
- Figure 13: North America Military 3D and 4D Printing Industry Revenue Share (%), by Country 2025 & 2033
- Figure 14: South America Military 3D and 4D Printing Industry Revenue (million), by Production Analysis 2025 & 2033
- Figure 15: South America Military 3D and 4D Printing Industry Revenue Share (%), by Production Analysis 2025 & 2033
- Figure 16: South America Military 3D and 4D Printing Industry Revenue (million), by Consumption Analysis 2025 & 2033
- Figure 17: South America Military 3D and 4D Printing Industry Revenue Share (%), by Consumption Analysis 2025 & 2033
- Figure 18: South America Military 3D and 4D Printing Industry Revenue (million), by Import Market Analysis (Value & Volume) 2025 & 2033
- Figure 19: South America Military 3D and 4D Printing Industry Revenue Share (%), by Import Market Analysis (Value & Volume) 2025 & 2033
- Figure 20: South America Military 3D and 4D Printing Industry Revenue (million), by Export Market Analysis (Value & Volume) 2025 & 2033
- Figure 21: South America Military 3D and 4D Printing Industry Revenue Share (%), by Export Market Analysis (Value & Volume) 2025 & 2033
- Figure 22: South America Military 3D and 4D Printing Industry Revenue (million), by Price Trend Analysis 2025 & 2033
- Figure 23: South America Military 3D and 4D Printing Industry Revenue Share (%), by Price Trend Analysis 2025 & 2033
- Figure 24: South America Military 3D and 4D Printing Industry Revenue (million), by Country 2025 & 2033
- Figure 25: South America Military 3D and 4D Printing Industry Revenue Share (%), by Country 2025 & 2033
- Figure 26: Europe Military 3D and 4D Printing Industry Revenue (million), by Production Analysis 2025 & 2033
- Figure 27: Europe Military 3D and 4D Printing Industry Revenue Share (%), by Production Analysis 2025 & 2033
- Figure 28: Europe Military 3D and 4D Printing Industry Revenue (million), by Consumption Analysis 2025 & 2033
- Figure 29: Europe Military 3D and 4D Printing Industry Revenue Share (%), by Consumption Analysis 2025 & 2033
- Figure 30: Europe Military 3D and 4D Printing Industry Revenue (million), by Import Market Analysis (Value & Volume) 2025 & 2033
- Figure 31: Europe Military 3D and 4D Printing Industry Revenue Share (%), by Import Market Analysis (Value & Volume) 2025 & 2033
- Figure 32: Europe Military 3D and 4D Printing Industry Revenue (million), by Export Market Analysis (Value & Volume) 2025 & 2033
- Figure 33: Europe Military 3D and 4D Printing Industry Revenue Share (%), by Export Market Analysis (Value & Volume) 2025 & 2033
- Figure 34: Europe Military 3D and 4D Printing Industry Revenue (million), by Price Trend Analysis 2025 & 2033
- Figure 35: Europe Military 3D and 4D Printing Industry Revenue Share (%), by Price Trend Analysis 2025 & 2033
- Figure 36: Europe Military 3D and 4D Printing Industry Revenue (million), by Country 2025 & 2033
- Figure 37: Europe Military 3D and 4D Printing Industry Revenue Share (%), by Country 2025 & 2033
- Figure 38: Middle East & Africa Military 3D and 4D Printing Industry Revenue (million), by Production Analysis 2025 & 2033
- Figure 39: Middle East & Africa Military 3D and 4D Printing Industry Revenue Share (%), by Production Analysis 2025 & 2033
- Figure 40: Middle East & Africa Military 3D and 4D Printing Industry Revenue (million), by Consumption Analysis 2025 & 2033
- Figure 41: Middle East & Africa Military 3D and 4D Printing Industry Revenue Share (%), by Consumption Analysis 2025 & 2033
- Figure 42: Middle East & Africa Military 3D and 4D Printing Industry Revenue (million), by Import Market Analysis (Value & Volume) 2025 & 2033
- Figure 43: Middle East & Africa Military 3D and 4D Printing Industry Revenue Share (%), by Import Market Analysis (Value & Volume) 2025 & 2033
- Figure 44: Middle East & Africa Military 3D and 4D Printing Industry Revenue (million), by Export Market Analysis (Value & Volume) 2025 & 2033
- Figure 45: Middle East & Africa Military 3D and 4D Printing Industry Revenue Share (%), by Export Market Analysis (Value & Volume) 2025 & 2033
- Figure 46: Middle East & Africa Military 3D and 4D Printing Industry Revenue (million), by Price Trend Analysis 2025 & 2033
- Figure 47: Middle East & Africa Military 3D and 4D Printing Industry Revenue Share (%), by Price Trend Analysis 2025 & 2033
- Figure 48: Middle East & Africa Military 3D and 4D Printing Industry Revenue (million), by Country 2025 & 2033
- Figure 49: Middle East & Africa Military 3D and 4D Printing Industry Revenue Share (%), by Country 2025 & 2033
- Figure 50: Asia Pacific Military 3D and 4D Printing Industry Revenue (million), by Production Analysis 2025 & 2033
- Figure 51: Asia Pacific Military 3D and 4D Printing Industry Revenue Share (%), by Production Analysis 2025 & 2033
- Figure 52: Asia Pacific Military 3D and 4D Printing Industry Revenue (million), by Consumption Analysis 2025 & 2033
- Figure 53: Asia Pacific Military 3D and 4D Printing Industry Revenue Share (%), by Consumption Analysis 2025 & 2033
- Figure 54: Asia Pacific Military 3D and 4D Printing Industry Revenue (million), by Import Market Analysis (Value & Volume) 2025 & 2033
- Figure 55: Asia Pacific Military 3D and 4D Printing Industry Revenue Share (%), by Import Market Analysis (Value & Volume) 2025 & 2033
- Figure 56: Asia Pacific Military 3D and 4D Printing Industry Revenue (million), by Export Market Analysis (Value & Volume) 2025 & 2033
- Figure 57: Asia Pacific Military 3D and 4D Printing Industry Revenue Share (%), by Export Market Analysis (Value & Volume) 2025 & 2033
- Figure 58: Asia Pacific Military 3D and 4D Printing Industry Revenue (million), by Price Trend Analysis 2025 & 2033
- Figure 59: Asia Pacific Military 3D and 4D Printing Industry Revenue Share (%), by Price Trend Analysis 2025 & 2033
- Figure 60: Asia Pacific Military 3D and 4D Printing Industry Revenue (million), by Country 2025 & 2033
- Figure 61: Asia Pacific Military 3D and 4D Printing Industry Revenue Share (%), by Country 2025 & 2033
List of Tables
- Table 1: Global Military 3D and 4D Printing Industry Revenue million Forecast, by Production Analysis 2020 & 2033
- Table 2: Global Military 3D and 4D Printing Industry Revenue million Forecast, by Consumption Analysis 2020 & 2033
- Table 3: Global Military 3D and 4D Printing Industry Revenue million Forecast, by Import Market Analysis (Value & Volume) 2020 & 2033
- Table 4: Global Military 3D and 4D Printing Industry Revenue million Forecast, by Export Market Analysis (Value & Volume) 2020 & 2033
- Table 5: Global Military 3D and 4D Printing Industry Revenue million Forecast, by Price Trend Analysis 2020 & 2033
- Table 6: Global Military 3D and 4D Printing Industry Revenue million Forecast, by Region 2020 & 2033
- Table 7: Global Military 3D and 4D Printing Industry Revenue million Forecast, by Production Analysis 2020 & 2033
- Table 8: Global Military 3D and 4D Printing Industry Revenue million Forecast, by Consumption Analysis 2020 & 2033
- Table 9: Global Military 3D and 4D Printing Industry Revenue million Forecast, by Import Market Analysis (Value & Volume) 2020 & 2033
- Table 10: Global Military 3D and 4D Printing Industry Revenue million Forecast, by Export Market Analysis (Value & Volume) 2020 & 2033
- Table 11: Global Military 3D and 4D Printing Industry Revenue million Forecast, by Price Trend Analysis 2020 & 2033
- Table 12: Global Military 3D and 4D Printing Industry Revenue million Forecast, by Country 2020 & 2033
- Table 13: United States Military 3D and 4D Printing Industry Revenue (million) Forecast, by Application 2020 & 2033
- Table 14: Canada Military 3D and 4D Printing Industry Revenue (million) Forecast, by Application 2020 & 2033
- Table 15: Mexico Military 3D and 4D Printing Industry Revenue (million) Forecast, by Application 2020 & 2033
- Table 16: Global Military 3D and 4D Printing Industry Revenue million Forecast, by Production Analysis 2020 & 2033
- Table 17: Global Military 3D and 4D Printing Industry Revenue million Forecast, by Consumption Analysis 2020 & 2033
- Table 18: Global Military 3D and 4D Printing Industry Revenue million Forecast, by Import Market Analysis (Value & Volume) 2020 & 2033
- Table 19: Global Military 3D and 4D Printing Industry Revenue million Forecast, by Export Market Analysis (Value & Volume) 2020 & 2033
- Table 20: Global Military 3D and 4D Printing Industry Revenue million Forecast, by Price Trend Analysis 2020 & 2033
- Table 21: Global Military 3D and 4D Printing Industry Revenue million Forecast, by Country 2020 & 2033
- Table 22: Brazil Military 3D and 4D Printing Industry Revenue (million) Forecast, by Application 2020 & 2033
- Table 23: Argentina Military 3D and 4D Printing Industry Revenue (million) Forecast, by Application 2020 & 2033
- Table 24: Rest of South America Military 3D and 4D Printing Industry Revenue (million) Forecast, by Application 2020 & 2033
- Table 25: Global Military 3D and 4D Printing Industry Revenue million Forecast, by Production Analysis 2020 & 2033
- Table 26: Global Military 3D and 4D Printing Industry Revenue million Forecast, by Consumption Analysis 2020 & 2033
- Table 27: Global Military 3D and 4D Printing Industry Revenue million Forecast, by Import Market Analysis (Value & Volume) 2020 & 2033
- Table 28: Global Military 3D and 4D Printing Industry Revenue million Forecast, by Export Market Analysis (Value & Volume) 2020 & 2033
- Table 29: Global Military 3D and 4D Printing Industry Revenue million Forecast, by Price Trend Analysis 2020 & 2033
- Table 30: Global Military 3D and 4D Printing Industry Revenue million Forecast, by Country 2020 & 2033
- Table 31: United Kingdom Military 3D and 4D Printing Industry Revenue (million) Forecast, by Application 2020 & 2033
- Table 32: Germany Military 3D and 4D Printing Industry Revenue (million) Forecast, by Application 2020 & 2033
- Table 33: France Military 3D and 4D Printing Industry Revenue (million) Forecast, by Application 2020 & 2033
- Table 34: Italy Military 3D and 4D Printing Industry Revenue (million) Forecast, by Application 2020 & 2033
- Table 35: Spain Military 3D and 4D Printing Industry Revenue (million) Forecast, by Application 2020 & 2033
- Table 36: Russia Military 3D and 4D Printing Industry Revenue (million) Forecast, by Application 2020 & 2033
- Table 37: Benelux Military 3D and 4D Printing Industry Revenue (million) Forecast, by Application 2020 & 2033
- Table 38: Nordics Military 3D and 4D Printing Industry Revenue (million) Forecast, by Application 2020 & 2033
- Table 39: Rest of Europe Military 3D and 4D Printing Industry Revenue (million) Forecast, by Application 2020 & 2033
- Table 40: Global Military 3D and 4D Printing Industry Revenue million Forecast, by Production Analysis 2020 & 2033
- Table 41: Global Military 3D and 4D Printing Industry Revenue million Forecast, by Consumption Analysis 2020 & 2033
- Table 42: Global Military 3D and 4D Printing Industry Revenue million Forecast, by Import Market Analysis (Value & Volume) 2020 & 2033
- Table 43: Global Military 3D and 4D Printing Industry Revenue million Forecast, by Export Market Analysis (Value & Volume) 2020 & 2033
- Table 44: Global Military 3D and 4D Printing Industry Revenue million Forecast, by Price Trend Analysis 2020 & 2033
- Table 45: Global Military 3D and 4D Printing Industry Revenue million Forecast, by Country 2020 & 2033
- Table 46: Turkey Military 3D and 4D Printing Industry Revenue (million) Forecast, by Application 2020 & 2033
- Table 47: Israel Military 3D and 4D Printing Industry Revenue (million) Forecast, by Application 2020 & 2033
- Table 48: GCC Military 3D and 4D Printing Industry Revenue (million) Forecast, by Application 2020 & 2033
- Table 49: North Africa Military 3D and 4D Printing Industry Revenue (million) Forecast, by Application 2020 & 2033
- Table 50: South Africa Military 3D and 4D Printing Industry Revenue (million) Forecast, by Application 2020 & 2033
- Table 51: Rest of Middle East & Africa Military 3D and 4D Printing Industry Revenue (million) Forecast, by Application 2020 & 2033
- Table 52: Global Military 3D and 4D Printing Industry Revenue million Forecast, by Production Analysis 2020 & 2033
- Table 53: Global Military 3D and 4D Printing Industry Revenue million Forecast, by Consumption Analysis 2020 & 2033
- Table 54: Global Military 3D and 4D Printing Industry Revenue million Forecast, by Import Market Analysis (Value & Volume) 2020 & 2033
- Table 55: Global Military 3D and 4D Printing Industry Revenue million Forecast, by Export Market Analysis (Value & Volume) 2020 & 2033
- Table 56: Global Military 3D and 4D Printing Industry Revenue million Forecast, by Price Trend Analysis 2020 & 2033
- Table 57: Global Military 3D and 4D Printing Industry Revenue million Forecast, by Country 2020 & 2033
- Table 58: China Military 3D and 4D Printing Industry Revenue (million) Forecast, by Application 2020 & 2033
- Table 59: India Military 3D and 4D Printing Industry Revenue (million) Forecast, by Application 2020 & 2033
- Table 60: Japan Military 3D and 4D Printing Industry Revenue (million) Forecast, by Application 2020 & 2033
- Table 61: South Korea Military 3D and 4D Printing Industry Revenue (million) Forecast, by Application 2020 & 2033
- Table 62: ASEAN Military 3D and 4D Printing Industry Revenue (million) Forecast, by Application 2020 & 2033
- Table 63: Oceania Military 3D and 4D Printing Industry Revenue (million) Forecast, by Application 2020 & 2033
- Table 64: Rest of Asia Pacific Military 3D and 4D Printing Industry Revenue (million) Forecast, by Application 2020 & 2033
Frequently Asked Questions
1. What is the projected Compound Annual Growth Rate (CAGR) of the Military 3D and 4D Printing Industry?
The projected CAGR is approximately 35.8%.
2. Which companies are prominent players in the Military 3D and 4D Printing Industry?
Key companies in the market include 3T Additive Manufacturing Ltd, Markforged Inc, Norsk Titanium US Inc, Engineering & Manufacturing Services Inc, 3D Systems Corporation, EOS Gmbh, Nano Dimensions Ltd, Stratasys Ltd, ExOne Company.
3. What are the main segments of the Military 3D and 4D Printing Industry?
The market segments include Production Analysis, Consumption Analysis, Import Market Analysis (Value & Volume), Export Market Analysis (Value & Volume), Price Trend Analysis.
4. Can you provide details about the market size?
The market size is estimated to be USD 156.8 million as of 2022.
5. What are some drivers contributing to market growth?
N/A
6. What are the notable trends driving market growth?
Airborne Segment Held Highest Shares in the Market.
7. Are there any restraints impacting market growth?
N/A
8. Can you provide examples of recent developments in the market?
November 2022: 3D Systems and ALM announced their partnership to expand access to industry-leading 3D printing materials. The companies plan to accelerate material adoption and drive additive manufacturing industry growth by providing access to industry-leading 3D printing materials.
9. What pricing options are available for accessing the report?
Pricing options include single-user, multi-user, and enterprise licenses priced at USD 4750, USD 5250, and USD 8750 respectively.
10. Is the market size provided in terms of value or volume?
The market size is provided in terms of value, measured in million.
11. Are there any specific market keywords associated with the report?
Yes, the market keyword associated with the report is "Military 3D and 4D Printing Industry," which aids in identifying and referencing the specific market segment covered.
12. How do I determine which pricing option suits my needs best?
The pricing options vary based on user requirements and access needs. Individual users may opt for single-user licenses, while businesses requiring broader access may choose multi-user or enterprise licenses for cost-effective access to the report.
13. Are there any additional resources or data provided in the Military 3D and 4D Printing Industry report?
While the report offers comprehensive insights, it's advisable to review the specific contents or supplementary materials provided to ascertain if additional resources or data are available.
14. How can I stay updated on further developments or reports in the Military 3D and 4D Printing Industry?
To stay informed about further developments, trends, and reports in the Military 3D and 4D Printing Industry, consider subscribing to industry newsletters, following relevant companies and organizations, or regularly checking reputable industry news sources and publications.
Methodology
Step 1 - Identification of Relevant Samples Size from Population Database


Step 2 - Approaches for Defining Global Market Size (Value, Volume* & Price*)

Note*: In applicable scenarios
Step 3 - Data Sources
Primary Research
- Web Analytics
- Survey Reports
- Research Institute
- Latest Research Reports
- Opinion Leaders
Secondary Research
- Annual Reports
- White Paper
- Latest Press Release
- Industry Association
- Paid Database
- Investor Presentations

Step 4 - Data Triangulation
Involves using different sources of information in order to increase the validity of a study
These sources are likely to be stakeholders in a program - participants, other researchers, program staff, other community members, and so on.
Then we put all data in single framework & apply various statistical tools to find out the dynamic on the market.
During the analysis stage, feedback from the stakeholder groups would be compared to determine areas of agreement as well as areas of divergence