

Key Insights
The Molten Salt Thermal Energy Storage (MSTES) market is demonstrating significant expansion, driven by the escalating demand for dependable and effective energy storage solutions to integrate intermittent renewable energy sources such as solar and wind power. This growth is propelled by several critical factors: the global imperative for decarbonization and reduced reliance on fossil fuels, which is creating substantial demand for energy storage technologies ensuring grid stability and consistent power supply; advancements in molten salt technology, including improved materials and system designs, are enhancing efficiency and cost-effectiveness, making MSTES a more viable option for large-scale deployment; and supportive government policies and incentives promoting renewable energy integration are further stimulating market expansion. While challenges like high initial capital investment and the necessity for stringent safety protocols persist, ongoing technological progress and economies of scale are anticipated to address these constraints. The market is segmented by technology type, including Parabolic Troughs, Fresnel Reflectors, and Power Towers, with parabolic troughs currently dominating market share due to their established maturity and proven performance.
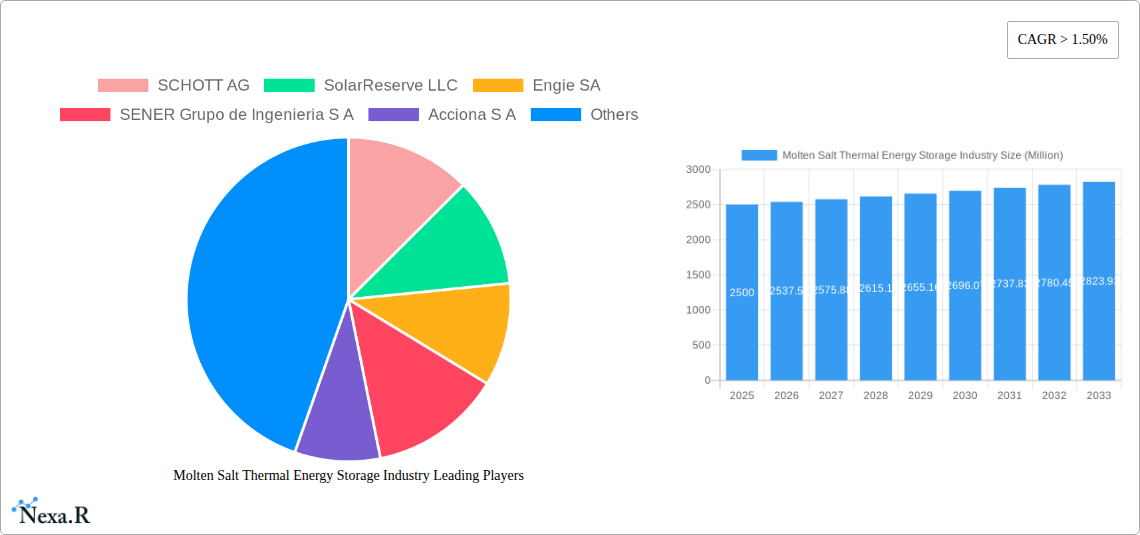
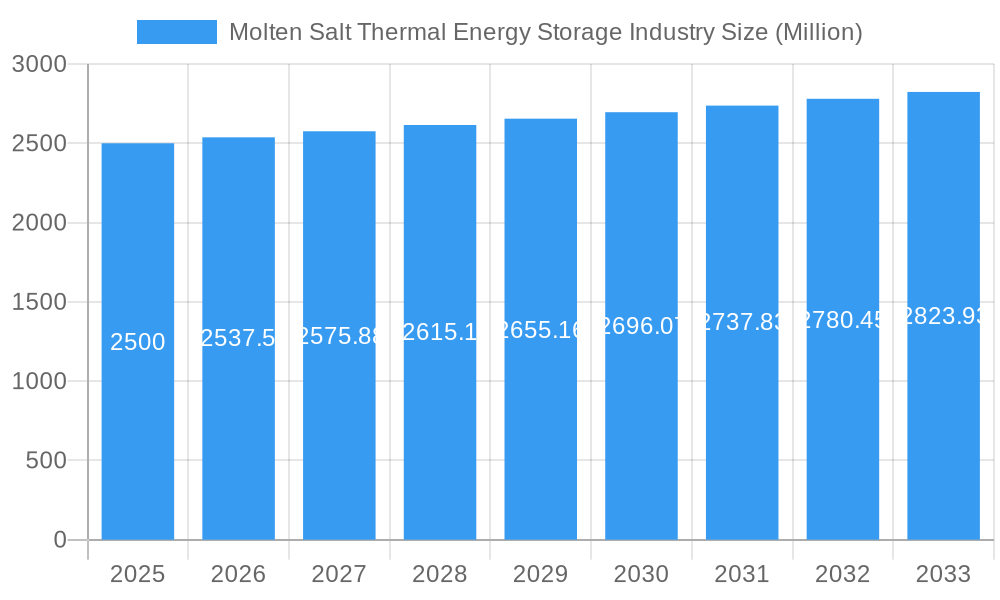
Molten Salt Thermal Energy Storage Industry Market Size (In Billion)
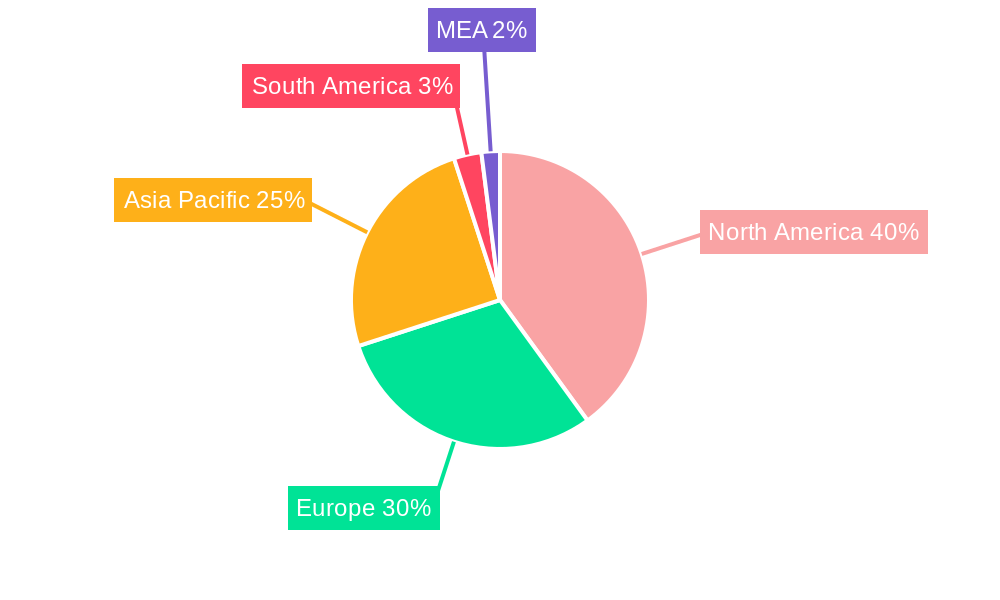
Geographically, the market shows robust growth across North America, Europe, and Asia-Pacific. North America currently leads, attributed to its advanced renewable energy infrastructure and favorable regulatory frameworks. However, Asia-Pacific is projected to experience the most rapid growth rate, fueled by substantial investments in renewable energy projects and burgeoning energy demands in rapidly developing economies such as China and India. Key industry players, including SCHOTT AG and SolarReserve LLC, are actively expanding their MSTES offerings through innovation and strategic collaborations, fostering a competitive and dynamic sector. The market is projected for sustained growth throughout the forecast period (2025-2033), driven by the aforementioned factors and an increasing recognition of energy storage's pivotal role in achieving global sustainability objectives. Based on current projections, the market is expected to reach $2.22 billion by 2025, with a projected Compound Annual Growth Rate (CAGR) of 9.8%, indicating a strong and accelerating trajectory of market expansion.
Molten Salt Thermal Energy Storage Industry Company Market Share
Molten Salt Thermal Energy Storage Industry: A Comprehensive Market Report (2019-2033)
This comprehensive report provides an in-depth analysis of the Molten Salt Thermal Energy Storage (MSTS) industry, encompassing market dynamics, growth trends, regional analysis, and key player strategies. The report covers the period from 2019 to 2033, with a focus on the forecast period of 2025-2033 and a base year of 2025. This crucial analysis is essential for industry professionals, investors, and policymakers seeking to understand and capitalize on the burgeoning opportunities within this vital sector of renewable energy. The report segments the market by technology (Parabolic Troughs, Fresnel Reflector, Power Tower) and analyzes key players including SCHOTT AG, SolarReserve LLC, Engie SA, SENER Grupo de Ingenieria S A, Acciona S A, Abengoa SA, Yara International ASA, and BrightSource Energy Inc. The total market size in 2025 is estimated at xx Million and is projected to reach xx Million by 2033.
Molten Salt Thermal Energy Storage Industry Market Dynamics & Structure
The Molten Salt Thermal Energy Storage (MSTS) market is characterized by moderate concentration, with a few major players dominating certain segments. Technological innovation, particularly in materials science and system optimization, is a key driver of growth. Stringent environmental regulations and government incentives promoting renewable energy integration are further propelling market expansion. While the market faces competition from other energy storage solutions (e.g., pumped hydro, batteries), MSTS’s unique advantages in high-temperature applications and long-duration storage offer a significant competitive edge. Mergers and acquisitions (M&A) activity has been relatively low in recent years (xx deals in the past five years) but is expected to increase as the market matures and larger players seek to consolidate their positions.
- Market Concentration: Moderately concentrated, with xx% market share held by the top 5 players in 2025.
- Technological Innovation: Focus on improving efficiency, reducing costs, and expanding operational lifespan of MSTS systems.
- Regulatory Landscape: Favorable policies and incentives supporting renewable energy deployment are creating a positive environment for growth.
- Competitive Substitutes: Competition from other energy storage technologies remains a challenge, but MSTS's unique advantages in long-duration storage provide a differentiation.
- End-User Demographics: Primarily focused on utility-scale solar thermal power plants and industrial process heat applications.
- M&A Trends: Low activity in recent years (xx deals between 2019-2024), but anticipated increase in the coming years.
Molten Salt Thermal Energy Storage Industry Growth Trends & Insights
The MSTS market exhibits strong growth potential, driven by the increasing demand for reliable and affordable renewable energy solutions. Market size is projected to experience significant expansion, with a Compound Annual Growth Rate (CAGR) of xx% between 2025 and 2033. This growth is fueled by rising global energy consumption, decarbonization efforts, and the need for efficient grid stabilization. The adoption rate of MSTS is steadily increasing, particularly in regions with abundant solar resources. Technological advancements continue to drive down costs and improve system performance, further accelerating market penetration. Consumer behavior is shifting towards renewable energy solutions, creating a strong demand for efficient and reliable energy storage systems. Technological disruptions, such as the development of novel molten salt materials and improved system designs, are also contributing to market expansion. These factors combine to create a positive outlook for the MSTS market. Current market penetration is at xx% in 2025 and is expected to reach xx% by 2033.
Dominant Regions, Countries, or Segments in Molten Salt Thermal Energy Storage Industry
The North American market is currently the leading region for MSTS, driven by supportive government policies and the substantial investment in renewable energy infrastructure. Within North America, the United States holds the largest market share due to its established solar thermal power sector. However, other regions, particularly those in the Middle East and North Africa (MENA) region with abundant solar resources, are showing rapid growth. The Power Tower segment currently dominates the market due to its high energy storage capacity.
- Key Drivers:
- United States: Strong government support for renewable energy, established solar thermal industry.
- MENA Region: High solar irradiation, supportive government policies, and increasing investment in renewable energy projects.
- China: Growing demand for renewable energy and energy storage, significant government investment in renewable energy infrastructure.
- Dominance Factors:
- Policy Support: Government incentives and regulations play a significant role in driving market growth.
- Infrastructure Development: Investments in grid infrastructure and transmission lines are crucial for MSTS deployment.
- Economic Factors: The cost-effectiveness of MSTS compared to other energy storage options is a crucial factor.
Molten Salt Thermal Energy Storage Industry Product Landscape
The MSTS industry offers a range of products tailored to various applications, from utility-scale power generation to industrial process heat. Innovations focus on improving thermal efficiency, reducing material costs, and enhancing safety features. Systems are designed for optimal performance and durability, with advanced control systems and monitoring capabilities. Unique selling propositions include long-duration storage capabilities, high-temperature operation, and integration with various renewable energy sources. Advancements in material science and system integration are driving innovation.
Key Drivers, Barriers & Challenges in Molten Salt Thermal Energy Storage Industry
Key Drivers:
- Increasing demand for renewable energy storage.
- Government incentives and supportive policies.
- Technological advancements reducing costs and improving efficiency.
- Growing concerns about climate change and carbon emissions.
Key Challenges & Restraints:
- High initial capital costs associated with MSTS systems.
- Potential safety concerns related to molten salt handling.
- Limited availability of skilled labor for installation and maintenance.
- Supply chain disruptions impacting the availability of key materials. This has resulted in a xx% increase in material costs over the past 2 years, hindering project development.
Emerging Opportunities in Molten Salt Thermal Energy Storage Industry
- Untapped Markets: Expanding into developing countries with high renewable energy potential.
- Innovative Applications: Exploring new applications in industrial process heat and desalination.
- Evolving Consumer Preferences: Meeting the increasing demand for sustainable energy solutions.
- Integration with other technologies: Synergy with other energy storage systems, smart grids and energy management systems.
Growth Accelerators in the Molten Salt Thermal Energy Storage Industry
Technological breakthroughs in material science and system optimization are key catalysts for long-term growth. Strategic partnerships between energy companies, technology providers, and research institutions will accelerate market development. Expansion into new geographic markets and applications will further stimulate growth. Government policies promoting renewable energy adoption remain crucial to maintaining a positive momentum.
Key Players Shaping the Molten Salt Thermal Energy Storage Industry Market
- SCHOTT AG
- SolarReserve LLC
- Engie SA
- SENER Grupo de Ingenieria S A
- Acciona S A
- Abengoa SA
- Yara International ASA
- BrightSource Energy Inc
Notable Milestones in Molten Salt Thermal Energy Storage Industry Sector
- November 2022: Hyme Energy ApS and Bornholms Energi & Forsyning (BEOF) announced a partnership to build a 1 MW/20 MWh molten salt thermal energy storage demonstrator in Bornholm, Denmark (completion scheduled for 2024). This project signifies a significant step towards the commercialization of smaller-scale MSTS applications.
In-Depth Molten Salt Thermal Energy Storage Industry Market Outlook
The future of the MSTS market appears promising, with strong growth driven by increasing demand for renewable energy, favorable government policies, and technological advancements. Strategic partnerships and expansion into new markets will continue to shape industry dynamics. The focus on cost reduction and improved efficiency will be crucial for expanding market penetration and realizing the full potential of this technology in a sustainable energy future.
Molten Salt Thermal Energy Storage Industry Segmentation
-
1. Technology
- 1.1. Parabolic Troughs
- 1.2. Fresnel Reflector
- 1.3. Power Tower
Molten Salt Thermal Energy Storage Industry Segmentation By Geography
- 1. North America
- 2. Asia Pacific
- 3. Europe
- 4. South America
- 5. Middle East and Africa
Molten Salt Thermal Energy Storage Industry Regional Market Share
Geographic Coverage of Molten Salt Thermal Energy Storage Industry
Molten Salt Thermal Energy Storage Industry REPORT HIGHLIGHTS
| Aspects | Details |
|---|---|
| Study Period | 2020-2034 |
| Base Year | 2025 |
| Estimated Year | 2026 |
| Forecast Period | 2026-2034 |
| Historical Period | 2020-2025 |
| Growth Rate | CAGR of 9.8% from 2020-2034 |
| Segmentation |
|
Table of Contents
- 1. Introduction
- 1.1. Research Scope
- 1.2. Market Segmentation
- 1.3. Research Objective
- 1.4. Definitions and Assumptions
- 2. Executive Summary
- 2.1. Market Snapshot
- 3. Market Dynamics
- 3.1. Market Drivers
- 3.2. Market Restrains
- 3.3. Market Trends
- 3.4. Market Opportunities
- 4. Market Factor Analysis
- 4.1. Porters Five Forces
- 4.1.1. Bargaining Power of Suppliers
- 4.1.2. Bargaining Power of Buyers
- 4.1.3. Threat of New Entrants
- 4.1.4. Threat of Substitutes
- 4.1.5. Competitive Rivalry
- 4.2. PESTEL analysis
- 4.3. BCG Analysis
- 4.3.1. Stars (High Growth, High Market Share)
- 4.3.2. Cash Cows (Low Growth, High Market Share)
- 4.3.3. Question Mark (High Growth, Low Market Share)
- 4.3.4. Dogs (Low Growth, Low Market Share)
- 4.4. Ansoff Matrix Analysis
- 4.5. Supply Chain Analysis
- 4.6. Regulatory Landscape
- 4.7. Current Market Potential and Opportunity Assessment (TAM–SAM–SOM Framework)
- 4.8. NRP Analyst Note
- 4.1. Porters Five Forces
- 5. Market Analysis, Insights and Forecast 2021-2033
- 5.1. Market Analysis, Insights and Forecast - by Technology
- 5.1.1. Parabolic Troughs
- 5.1.2. Fresnel Reflector
- 5.1.3. Power Tower
- 5.2. Market Analysis, Insights and Forecast - by Region
- 5.2.1. North America
- 5.2.2. Asia Pacific
- 5.2.3. Europe
- 5.2.4. South America
- 5.2.5. Middle East and Africa
- 5.1. Market Analysis, Insights and Forecast - by Technology
- 6. Global Molten Salt Thermal Energy Storage Industry Analysis, Insights and Forecast, 2021-2033
- 6.1. Market Analysis, Insights and Forecast - by Technology
- 6.1.1. Parabolic Troughs
- 6.1.2. Fresnel Reflector
- 6.1.3. Power Tower
- 6.1. Market Analysis, Insights and Forecast - by Technology
- 7. North America Molten Salt Thermal Energy Storage Industry Analysis, Insights and Forecast, 2020-2032
- 7.1. Market Analysis, Insights and Forecast - by Technology
- 7.1.1. Parabolic Troughs
- 7.1.2. Fresnel Reflector
- 7.1.3. Power Tower
- 7.1. Market Analysis, Insights and Forecast - by Technology
- 8. Asia Pacific Molten Salt Thermal Energy Storage Industry Analysis, Insights and Forecast, 2020-2032
- 8.1. Market Analysis, Insights and Forecast - by Technology
- 8.1.1. Parabolic Troughs
- 8.1.2. Fresnel Reflector
- 8.1.3. Power Tower
- 8.1. Market Analysis, Insights and Forecast - by Technology
- 9. Europe Molten Salt Thermal Energy Storage Industry Analysis, Insights and Forecast, 2020-2032
- 9.1. Market Analysis, Insights and Forecast - by Technology
- 9.1.1. Parabolic Troughs
- 9.1.2. Fresnel Reflector
- 9.1.3. Power Tower
- 9.1. Market Analysis, Insights and Forecast - by Technology
- 10. South America Molten Salt Thermal Energy Storage Industry Analysis, Insights and Forecast, 2020-2032
- 10.1. Market Analysis, Insights and Forecast - by Technology
- 10.1.1. Parabolic Troughs
- 10.1.2. Fresnel Reflector
- 10.1.3. Power Tower
- 10.1. Market Analysis, Insights and Forecast - by Technology
- 11. Middle East and Africa Molten Salt Thermal Energy Storage Industry Analysis, Insights and Forecast, 2020-2032
- 11.1. Market Analysis, Insights and Forecast - by Technology
- 11.1.1. Parabolic Troughs
- 11.1.2. Fresnel Reflector
- 11.1.3. Power Tower
- 11.1. Market Analysis, Insights and Forecast - by Technology
- 12. Competitive Analysis
- 12.1. Company Profiles
- 12.1.1 SCHOTT AG
- 12.1.1.1. Company Overview
- 12.1.1.2. Products
- 12.1.1.3. Company Financials
- 12.1.1.4. SWOT Analysis
- 12.1.2 SolarReserve LLC
- 12.1.2.1. Company Overview
- 12.1.2.2. Products
- 12.1.2.3. Company Financials
- 12.1.2.4. SWOT Analysis
- 12.1.3 Engie SA
- 12.1.3.1. Company Overview
- 12.1.3.2. Products
- 12.1.3.3. Company Financials
- 12.1.3.4. SWOT Analysis
- 12.1.4 SENER Grupo de Ingenieria S A
- 12.1.4.1. Company Overview
- 12.1.4.2. Products
- 12.1.4.3. Company Financials
- 12.1.4.4. SWOT Analysis
- 12.1.5 Acciona S A
- 12.1.5.1. Company Overview
- 12.1.5.2. Products
- 12.1.5.3. Company Financials
- 12.1.5.4. SWOT Analysis
- 12.1.6 Abengoa SA
- 12.1.6.1. Company Overview
- 12.1.6.2. Products
- 12.1.6.3. Company Financials
- 12.1.6.4. SWOT Analysis
- 12.1.7 Yara International ASA
- 12.1.7.1. Company Overview
- 12.1.7.2. Products
- 12.1.7.3. Company Financials
- 12.1.7.4. SWOT Analysis
- 12.1.8 BrightSource Energy Inc
- 12.1.8.1. Company Overview
- 12.1.8.2. Products
- 12.1.8.3. Company Financials
- 12.1.8.4. SWOT Analysis
- 12.1.1 SCHOTT AG
- 12.2. Market Entropy
- 12.2.1 Company's Key Areas Served
- 12.2.2 Recent Developments
- 12.3. Company Market Share Analysis 2025
- 12.3.1 Top 5 Companies Market Share Analysis
- 12.3.2 Top 3 Companies Market Share Analysis
- 12.4. List of Potential Customers
- 13. Research Methodology
List of Figures
- Figure 1: Global Molten Salt Thermal Energy Storage Industry Revenue Breakdown (billion, %) by Region 2025 & 2033
- Figure 2: North America Molten Salt Thermal Energy Storage Industry Revenue (billion), by Technology 2025 & 2033
- Figure 3: North America Molten Salt Thermal Energy Storage Industry Revenue Share (%), by Technology 2025 & 2033
- Figure 4: North America Molten Salt Thermal Energy Storage Industry Revenue (billion), by Country 2025 & 2033
- Figure 5: North America Molten Salt Thermal Energy Storage Industry Revenue Share (%), by Country 2025 & 2033
- Figure 6: Asia Pacific Molten Salt Thermal Energy Storage Industry Revenue (billion), by Technology 2025 & 2033
- Figure 7: Asia Pacific Molten Salt Thermal Energy Storage Industry Revenue Share (%), by Technology 2025 & 2033
- Figure 8: Asia Pacific Molten Salt Thermal Energy Storage Industry Revenue (billion), by Country 2025 & 2033
- Figure 9: Asia Pacific Molten Salt Thermal Energy Storage Industry Revenue Share (%), by Country 2025 & 2033
- Figure 10: Europe Molten Salt Thermal Energy Storage Industry Revenue (billion), by Technology 2025 & 2033
- Figure 11: Europe Molten Salt Thermal Energy Storage Industry Revenue Share (%), by Technology 2025 & 2033
- Figure 12: Europe Molten Salt Thermal Energy Storage Industry Revenue (billion), by Country 2025 & 2033
- Figure 13: Europe Molten Salt Thermal Energy Storage Industry Revenue Share (%), by Country 2025 & 2033
- Figure 14: South America Molten Salt Thermal Energy Storage Industry Revenue (billion), by Technology 2025 & 2033
- Figure 15: South America Molten Salt Thermal Energy Storage Industry Revenue Share (%), by Technology 2025 & 2033
- Figure 16: South America Molten Salt Thermal Energy Storage Industry Revenue (billion), by Country 2025 & 2033
- Figure 17: South America Molten Salt Thermal Energy Storage Industry Revenue Share (%), by Country 2025 & 2033
- Figure 18: Middle East and Africa Molten Salt Thermal Energy Storage Industry Revenue (billion), by Technology 2025 & 2033
- Figure 19: Middle East and Africa Molten Salt Thermal Energy Storage Industry Revenue Share (%), by Technology 2025 & 2033
- Figure 20: Middle East and Africa Molten Salt Thermal Energy Storage Industry Revenue (billion), by Country 2025 & 2033
- Figure 21: Middle East and Africa Molten Salt Thermal Energy Storage Industry Revenue Share (%), by Country 2025 & 2033
List of Tables
- Table 1: Global Molten Salt Thermal Energy Storage Industry Revenue billion Forecast, by Technology 2020 & 2033
- Table 2: Global Molten Salt Thermal Energy Storage Industry Revenue billion Forecast, by Region 2020 & 2033
- Table 3: Global Molten Salt Thermal Energy Storage Industry Revenue billion Forecast, by Technology 2020 & 2033
- Table 4: Global Molten Salt Thermal Energy Storage Industry Revenue billion Forecast, by Country 2020 & 2033
- Table 5: Global Molten Salt Thermal Energy Storage Industry Revenue billion Forecast, by Technology 2020 & 2033
- Table 6: Global Molten Salt Thermal Energy Storage Industry Revenue billion Forecast, by Country 2020 & 2033
- Table 7: Global Molten Salt Thermal Energy Storage Industry Revenue billion Forecast, by Technology 2020 & 2033
- Table 8: Global Molten Salt Thermal Energy Storage Industry Revenue billion Forecast, by Country 2020 & 2033
- Table 9: Global Molten Salt Thermal Energy Storage Industry Revenue billion Forecast, by Technology 2020 & 2033
- Table 10: Global Molten Salt Thermal Energy Storage Industry Revenue billion Forecast, by Country 2020 & 2033
- Table 11: Global Molten Salt Thermal Energy Storage Industry Revenue billion Forecast, by Technology 2020 & 2033
- Table 12: Global Molten Salt Thermal Energy Storage Industry Revenue billion Forecast, by Country 2020 & 2033
Frequently Asked Questions
1. What is the projected Compound Annual Growth Rate (CAGR) of the Molten Salt Thermal Energy Storage Industry?
The projected CAGR is approximately 9.8%.
2. Which companies are prominent players in the Molten Salt Thermal Energy Storage Industry?
Key companies in the market include SCHOTT AG, SolarReserve LLC, Engie SA, SENER Grupo de Ingenieria S A, Acciona S A, Abengoa SA, Yara International ASA, BrightSource Energy Inc.
3. What are the main segments of the Molten Salt Thermal Energy Storage Industry?
The market segments include Technology.
4. Can you provide details about the market size?
The market size is estimated to be USD 2.22 billion as of 2022.
5. What are some drivers contributing to market growth?
4.; Increasing Investments in Offshore Wind Power Projects4.; Supportive Government Policies.
6. What are the notable trends driving market growth?
Parabolic Trough Segment to Dominate the Market.
7. Are there any restraints impacting market growth?
4.; Increasing Adopting of Alternative Clean Energy Sources (Ex: Solar. Hydro).
8. Can you provide examples of recent developments in the market?
November 2022: Hyme Energy ApS announced that the company is partnering with Bornholms Energi & Forsyning (BEOF) to build its first molten salt thermal energy storage demonstrator on the Danish island of Bornholm. The storage facility is scheduled for completion in 2024 and will have a capacity of 1 MW/20 MWh. It will provide heat, power, and ancillary services to the local network.
9. What pricing options are available for accessing the report?
Pricing options include single-user, multi-user, and enterprise licenses priced at USD 4750, USD 5250, and USD 8750 respectively.
10. Is the market size provided in terms of value or volume?
The market size is provided in terms of value, measured in billion.
11. Are there any specific market keywords associated with the report?
Yes, the market keyword associated with the report is "Molten Salt Thermal Energy Storage Industry," which aids in identifying and referencing the specific market segment covered.
12. How do I determine which pricing option suits my needs best?
The pricing options vary based on user requirements and access needs. Individual users may opt for single-user licenses, while businesses requiring broader access may choose multi-user or enterprise licenses for cost-effective access to the report.
13. Are there any additional resources or data provided in the Molten Salt Thermal Energy Storage Industry report?
While the report offers comprehensive insights, it's advisable to review the specific contents or supplementary materials provided to ascertain if additional resources or data are available.
14. How can I stay updated on further developments or reports in the Molten Salt Thermal Energy Storage Industry?
To stay informed about further developments, trends, and reports in the Molten Salt Thermal Energy Storage Industry, consider subscribing to industry newsletters, following relevant companies and organizations, or regularly checking reputable industry news sources and publications.
Methodology
Step 1 - Identification of Relevant Samples Size from Population Database


Step 2 - Approaches for Defining Global Market Size (Value, Volume* & Price*)

Note*: In applicable scenarios
Step 3 - Data Sources
Primary Research
- Web Analytics
- Survey Reports
- Research Institute
- Latest Research Reports
- Opinion Leaders
Secondary Research
- Annual Reports
- White Paper
- Latest Press Release
- Industry Association
- Paid Database
- Investor Presentations

Step 4 - Data Triangulation
Involves using different sources of information in order to increase the validity of a study
These sources are likely to be stakeholders in a program - participants, other researchers, program staff, other community members, and so on.
Then we put all data in single framework & apply various statistical tools to find out the dynamic on the market.
During the analysis stage, feedback from the stakeholder groups would be compared to determine areas of agreement as well as areas of divergence