

Key Insights
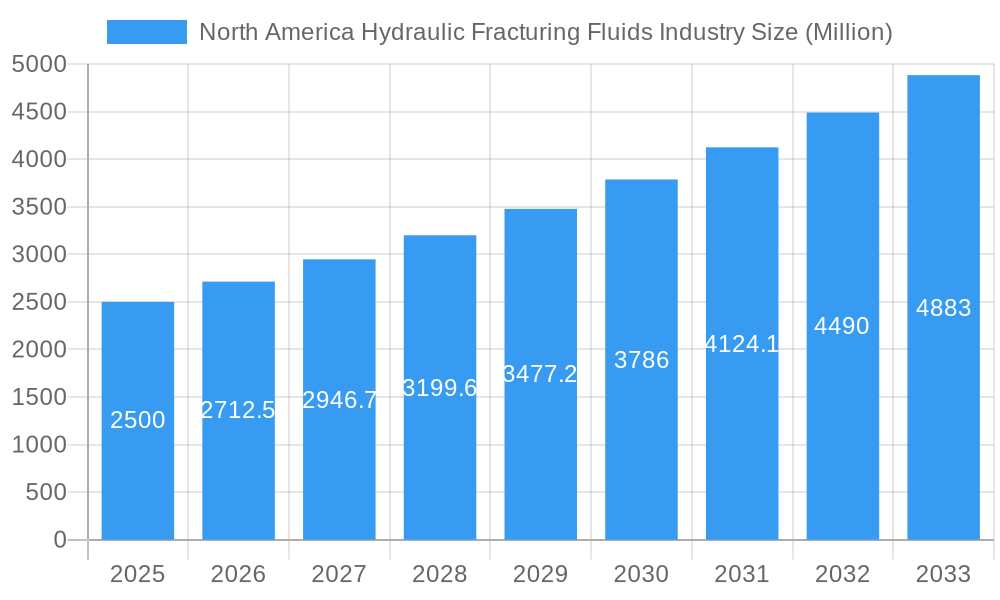
The North American hydraulic fracturing fluids market is poised for substantial expansion, driven by persistent demand for shale gas and oil extraction. The market, valued at $58.49 billion in 2025, is projected to achieve a Compound Annual Growth Rate (CAGR) of 6.2% from 2025 to 2033. This growth is underpinned by extensive exploration and production activities in key shale basins across the United States and Canada. Advancements in fluid formulations, including eco-friendly slick water-based fluids and enhanced foam- and gelled oil-based fluids, alongside the increasing adoption of horizontal drilling, are significant growth catalysts. While regulatory scrutiny and water availability present challenges, the market's reliance on hydraulic fracturing for energy production ensures a positive outlook.
North America Hydraulic Fracturing Fluids Industry Market Size (In Billion)
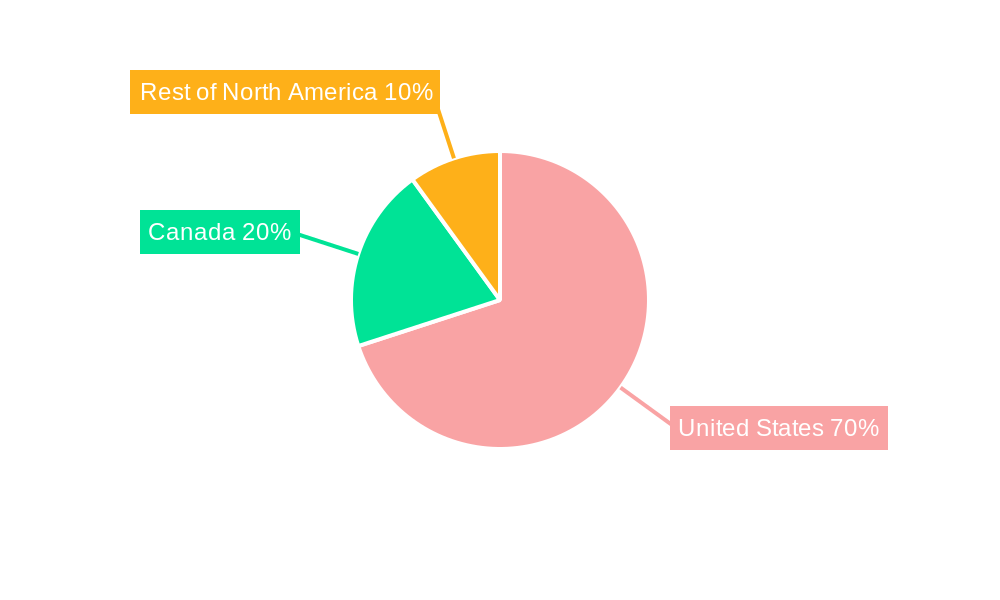
Despite environmental and water usage considerations, market segmentation reveals significant opportunities. Horizontal wells lead in oil and gas extraction efficiency. Slick water-based fluids are dominant due to their cost-effectiveness and reduced environmental footprint. The United States commands the largest market share, followed by Canada, reflecting the distribution of shale resources. Leading companies such as Ashland Inc., Baker Hughes, Schlumberger, and Halliburton are actively investing in R&D for improved fluid performance and market expansion. Future market dynamics will be shaped by efficiency enhancements, environmental impact reduction, and ongoing technological innovation.
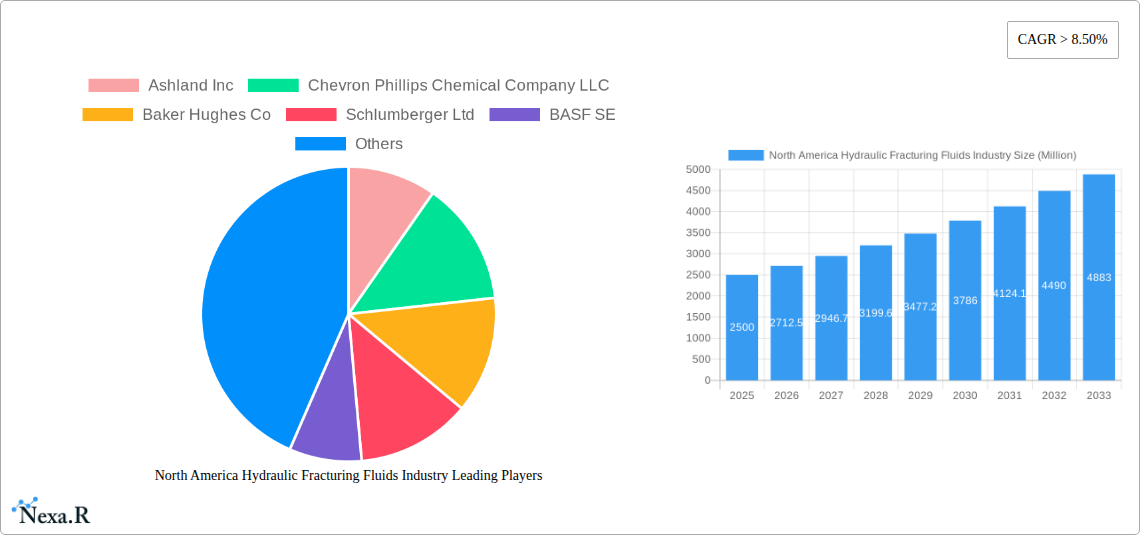
North America Hydraulic Fracturing Fluids Industry Company Market Share
North America Hydraulic Fracturing Fluids Industry: 2019-2033 Market Report
This comprehensive report provides a detailed analysis of the North America hydraulic fracturing fluids market, covering the period from 2019 to 2033. It delves into market dynamics, growth trends, dominant segments, key players, and future outlook, offering invaluable insights for industry professionals, investors, and strategic decision-makers. The report leverages extensive primary and secondary research to provide accurate and actionable intelligence. The market is segmented by well type (horizontal, vertical), fluid type (slick water-based fluid, foam-based fluid, gelled oil-based fluid, other base fluids), and geography (United States, Canada, Rest of North America).
Study Period: 2019-2033; Base Year: 2025; Estimated Year: 2025; Forecast Period: 2025-2033; Historical Period: 2019-2024
North America Hydraulic Fracturing Fluids Industry Market Dynamics & Structure
The North American hydraulic fracturing fluids market is characterized by moderate concentration, with key players holding significant market share. The market size in 2025 is estimated at $xx million, exhibiting a [Insert CAGR]% CAGR during the forecast period. Technological innovation, particularly in environmentally friendly fluids and enhanced efficiency solutions, is a major driver. Stringent environmental regulations and evolving safety standards influence market dynamics. Competition from alternative fracturing techniques and the availability of substitute fluids present challenges.
- Market Concentration: Moderate, with top 5 players holding approximately xx% market share in 2025.
- Technological Innovation: Focus on reducing water usage, improving shale penetration, and minimizing environmental impact.
- Regulatory Framework: Stringent environmental regulations (e.g., water discharge limits) and safety standards (e.g., worker protection).
- Competitive Substitutes: Alternative fracturing methods and biodegradable fluids.
- M&A Trends: Consolidation among smaller players and strategic acquisitions by major companies, with approximately xx M&A deals recorded between 2019 and 2024. Deal value totaled approximately $xx million.
- Innovation Barriers: High R&D costs and lengthy regulatory approval processes for new fluid formulations.
North America Hydraulic Fracturing Fluids Industry Growth Trends & Insights
The North American hydraulic fracturing fluids market has experienced fluctuating growth in recent years, largely influenced by oil and gas price volatility and exploration activity. Market size grew from $xx million in 2019 to $xx million in 2024, reflecting [Insert Growth Percentage]% growth. Technological advancements, such as the development of slickwater-based fluids that require less water and chemicals, have driven market expansion. The increasing adoption of horizontal drilling techniques further fuels market growth. Consumer behavior, particularly among oil and gas producers, is driven by cost efficiency, environmental concerns, and regulatory compliance. The market is expected to witness a CAGR of [Insert CAGR]% during the forecast period (2025-2033), reaching $xx million by 2033. Market penetration for slickwater-based fluids is expected to exceed xx% by 2033.
Dominant Regions, Countries, or Segments in North America Hydraulic Fracturing Fluids Industry
The United States dominates the North American hydraulic fracturing fluids market, accounting for approximately xx% of the market share in 2025, followed by Canada with xx%. Within fluid types, slick water-based fluids hold the largest market share (xx%), driven by their cost-effectiveness and efficiency. Horizontal drilling accounts for the majority of fluid demand (xx%).
- United States: Large shale gas reserves and established oil and gas production infrastructure.
- Canada: Significant shale gas and oil sands resources, but growth is influenced by regulatory policies and environmental considerations.
- Slick Water-Based Fluids: Cost-effective, environmentally preferable (compared to oil-based fluids), and widely adopted.
- Horizontal Drilling: The dominant well type in North America, requiring large volumes of fracturing fluids.
North America Hydraulic Fracturing Fluids Industry Product Landscape
The hydraulic fracturing fluids market showcases continuous product innovation, focused on enhancing performance, minimizing environmental impact, and improving safety. Recent advancements include the development of fluids with improved rheological properties, reduced water consumption, and enhanced proppant carrying capacity. Unique selling propositions center around improved fracture conductivity, reduced wellbore damage, and enhanced operational efficiency. These innovations aim to maximize hydrocarbon recovery and reduce the environmental footprint of hydraulic fracturing operations.
Key Drivers, Barriers & Challenges in North America Hydraulic Fracturing Fluids Industry
Key Drivers: Growing demand for shale gas and tight oil, advancements in horizontal drilling technology, and the development of more efficient and environmentally friendly fracturing fluids. Government incentives for domestic energy production also play a significant role.
Challenges: Fluctuations in oil and gas prices, stringent environmental regulations, concerns about water usage and disposal, and competition from alternative energy sources. Supply chain disruptions can impact the availability and cost of raw materials. Regulatory hurdles and lengthy approval processes for new fluid formulations pose challenges to innovation. The industry faces intense competitive pressure from both established and emerging players.
Emerging Opportunities in North America Hydraulic Fracturing Fluids Industry
Untapped markets in less-explored shale formations and the growing adoption of unconventional drilling techniques present significant opportunities. The demand for environmentally sustainable and biodegradable fluids is on the rise, opening avenues for innovative product development. Advanced digital technologies, such as machine learning and automation, hold immense potential for optimizing fluid selection and usage.
Growth Accelerators in the North America Hydraulic Fracturing Fluids Industry Industry
Technological advancements in fluid formulations, leading to improved efficiency and reduced environmental impact, are key growth accelerators. Strategic partnerships between fluid providers and oil and gas operators can unlock synergies and drive innovation. Expanding into new geographical areas and unconventional resource plays will further propel market growth.
Key Players Shaping the North America Hydraulic Fracturing Fluids Industry Market
- Ashland Inc
- Chevron Phillips Chemical Company LLC
- Baker Hughes Co
- Schlumberger Ltd
- BASF SE
- DuPont de Nemours Inc
- Halliburton Company
- Akzonobel NV
- Clariant International Ltd
- Calfrac Well Services Ltd
Notable Milestones in North America Hydraulic Fracturing Fluids Industry Sector
- 2020: Introduction of a new generation of environmentally friendly fracturing fluids by [Company Name].
- 2022: Acquisition of [Company A] by [Company B], expanding market share and product portfolio.
- 2023: Implementation of stricter environmental regulations in [State/Province], impacting fluid usage.
In-Depth North America Hydraulic Fracturing Fluids Industry Market Outlook
The North American hydraulic fracturing fluids market is poised for continued growth, driven by technological innovations, expanding shale gas production, and strategic partnerships. Opportunities exist in developing environmentally friendly fluids, improving efficiency, and optimizing fluid management. The market’s future will be shaped by ongoing technological advancements, regulatory landscapes, and the evolving dynamics of the oil and gas industry.
North America Hydraulic Fracturing Fluids Industry Segmentation
-
1. Well Type
- 1.1. Horizontal
- 1.2. Vertical
-
2. Fluid Type
- 2.1. Slick Water-based Fluid
- 2.2. Foam-based Fluid
- 2.3. Gelled Oil-based Fluid
- 2.4. Other Base Fluids
-
3. Geography
- 3.1. United States
- 3.2. Canada
- 3.3. Rest of North America
North America Hydraulic Fracturing Fluids Industry Segmentation By Geography
- 1. United States
- 2. Canada
- 3. Rest of North America
North America Hydraulic Fracturing Fluids Industry Regional Market Share
Geographic Coverage of North America Hydraulic Fracturing Fluids Industry
North America Hydraulic Fracturing Fluids Industry REPORT HIGHLIGHTS
| Aspects | Details |
|---|---|
| Study Period | 2020-2034 |
| Base Year | 2025 |
| Estimated Year | 2026 |
| Forecast Period | 2026-2034 |
| Historical Period | 2020-2025 |
| Growth Rate | CAGR of 6.2% from 2020-2034 |
| Segmentation |
|
Table of Contents
- 1. Introduction
- 1.1. Research Scope
- 1.2. Market Segmentation
- 1.3. Research Objective
- 1.4. Definitions and Assumptions
- 2. Executive Summary
- 2.1. Market Snapshot
- 3. Market Dynamics
- 3.1. Market Drivers
- 3.2. Market Restrains
- 3.3. Market Trends
- 3.4. Market Opportunities
- 4. Market Factor Analysis
- 4.1. Porters Five Forces
- 4.1.1. Bargaining Power of Suppliers
- 4.1.2. Bargaining Power of Buyers
- 4.1.3. Threat of New Entrants
- 4.1.4. Threat of Substitutes
- 4.1.5. Competitive Rivalry
- 4.2. PESTEL analysis
- 4.3. BCG Analysis
- 4.3.1. Stars (High Growth, High Market Share)
- 4.3.2. Cash Cows (Low Growth, High Market Share)
- 4.3.3. Question Mark (High Growth, Low Market Share)
- 4.3.4. Dogs (Low Growth, Low Market Share)
- 4.4. Ansoff Matrix Analysis
- 4.5. Supply Chain Analysis
- 4.6. Regulatory Landscape
- 4.7. Current Market Potential and Opportunity Assessment (TAM–SAM–SOM Framework)
- 4.8. NRP Analyst Note
- 4.1. Porters Five Forces
- 5. Market Analysis, Insights and Forecast 2021-2033
- 5.1. Market Analysis, Insights and Forecast - by Well Type
- 5.1.1. Horizontal
- 5.1.2. Vertical
- 5.2. Market Analysis, Insights and Forecast - by Fluid Type
- 5.2.1. Slick Water-based Fluid
- 5.2.2. Foam-based Fluid
- 5.2.3. Gelled Oil-based Fluid
- 5.2.4. Other Base Fluids
- 5.3. Market Analysis, Insights and Forecast - by Geography
- 5.3.1. United States
- 5.3.2. Canada
- 5.3.3. Rest of North America
- 5.4. Market Analysis, Insights and Forecast - by Region
- 5.4.1. United States
- 5.4.2. Canada
- 5.4.3. Rest of North America
- 5.1. Market Analysis, Insights and Forecast - by Well Type
- 6. North America Hydraulic Fracturing Fluids Industry Analysis, Insights and Forecast, 2021-2033
- 6.1. Market Analysis, Insights and Forecast - by Well Type
- 6.1.1. Horizontal
- 6.1.2. Vertical
- 6.2. Market Analysis, Insights and Forecast - by Fluid Type
- 6.2.1. Slick Water-based Fluid
- 6.2.2. Foam-based Fluid
- 6.2.3. Gelled Oil-based Fluid
- 6.2.4. Other Base Fluids
- 6.3. Market Analysis, Insights and Forecast - by Geography
- 6.3.1. United States
- 6.3.2. Canada
- 6.3.3. Rest of North America
- 6.1. Market Analysis, Insights and Forecast - by Well Type
- 7. United States North America Hydraulic Fracturing Fluids Industry Analysis, Insights and Forecast, 2020-2032
- 7.1. Market Analysis, Insights and Forecast - by Well Type
- 7.1.1. Horizontal
- 7.1.2. Vertical
- 7.2. Market Analysis, Insights and Forecast - by Fluid Type
- 7.2.1. Slick Water-based Fluid
- 7.2.2. Foam-based Fluid
- 7.2.3. Gelled Oil-based Fluid
- 7.2.4. Other Base Fluids
- 7.3. Market Analysis, Insights and Forecast - by Geography
- 7.3.1. United States
- 7.3.2. Canada
- 7.3.3. Rest of North America
- 7.1. Market Analysis, Insights and Forecast - by Well Type
- 8. Canada North America Hydraulic Fracturing Fluids Industry Analysis, Insights and Forecast, 2020-2032
- 8.1. Market Analysis, Insights and Forecast - by Well Type
- 8.1.1. Horizontal
- 8.1.2. Vertical
- 8.2. Market Analysis, Insights and Forecast - by Fluid Type
- 8.2.1. Slick Water-based Fluid
- 8.2.2. Foam-based Fluid
- 8.2.3. Gelled Oil-based Fluid
- 8.2.4. Other Base Fluids
- 8.3. Market Analysis, Insights and Forecast - by Geography
- 8.3.1. United States
- 8.3.2. Canada
- 8.3.3. Rest of North America
- 8.1. Market Analysis, Insights and Forecast - by Well Type
- 9. Rest of North America North America Hydraulic Fracturing Fluids Industry Analysis, Insights and Forecast, 2020-2032
- 9.1. Market Analysis, Insights and Forecast - by Well Type
- 9.1.1. Horizontal
- 9.1.2. Vertical
- 9.2. Market Analysis, Insights and Forecast - by Fluid Type
- 9.2.1. Slick Water-based Fluid
- 9.2.2. Foam-based Fluid
- 9.2.3. Gelled Oil-based Fluid
- 9.2.4. Other Base Fluids
- 9.3. Market Analysis, Insights and Forecast - by Geography
- 9.3.1. United States
- 9.3.2. Canada
- 9.3.3. Rest of North America
- 9.1. Market Analysis, Insights and Forecast - by Well Type
- 10. Competitive Analysis
- 10.1. Company Profiles
- 10.1.1 Ashland Inc
- 10.1.1.1. Company Overview
- 10.1.1.2. Products
- 10.1.1.3. Company Financials
- 10.1.1.4. SWOT Analysis
- 10.1.2 Chevron Phillips Chemical Company LLC
- 10.1.2.1. Company Overview
- 10.1.2.2. Products
- 10.1.2.3. Company Financials
- 10.1.2.4. SWOT Analysis
- 10.1.3 Baker Hughes Co
- 10.1.3.1. Company Overview
- 10.1.3.2. Products
- 10.1.3.3. Company Financials
- 10.1.3.4. SWOT Analysis
- 10.1.4 Schlumberger Ltd
- 10.1.4.1. Company Overview
- 10.1.4.2. Products
- 10.1.4.3. Company Financials
- 10.1.4.4. SWOT Analysis
- 10.1.5 BASF SE
- 10.1.5.1. Company Overview
- 10.1.5.2. Products
- 10.1.5.3. Company Financials
- 10.1.5.4. SWOT Analysis
- 10.1.6 DuPont de Nemours Inc *List Not Exhaustive
- 10.1.6.1. Company Overview
- 10.1.6.2. Products
- 10.1.6.3. Company Financials
- 10.1.6.4. SWOT Analysis
- 10.1.7 Halliburton Company
- 10.1.7.1. Company Overview
- 10.1.7.2. Products
- 10.1.7.3. Company Financials
- 10.1.7.4. SWOT Analysis
- 10.1.8 Akzonobel NV
- 10.1.8.1. Company Overview
- 10.1.8.2. Products
- 10.1.8.3. Company Financials
- 10.1.8.4. SWOT Analysis
- 10.1.9 Clariant International Ltd
- 10.1.9.1. Company Overview
- 10.1.9.2. Products
- 10.1.9.3. Company Financials
- 10.1.9.4. SWOT Analysis
- 10.1.10 Calfrac Well Services Ltd
- 10.1.10.1. Company Overview
- 10.1.10.2. Products
- 10.1.10.3. Company Financials
- 10.1.10.4. SWOT Analysis
- 10.1.1 Ashland Inc
- 10.2. Market Entropy
- 10.2.1 Company's Key Areas Served
- 10.2.2 Recent Developments
- 10.3. Company Market Share Analysis 2025
- 10.3.1 Top 5 Companies Market Share Analysis
- 10.3.2 Top 3 Companies Market Share Analysis
- 10.4. List of Potential Customers
- 11. Research Methodology
List of Figures
- Figure 1: North America Hydraulic Fracturing Fluids Industry Revenue Breakdown (billion, %) by Product 2025 & 2033
- Figure 2: North America Hydraulic Fracturing Fluids Industry Share (%) by Company 2025
List of Tables
- Table 1: North America Hydraulic Fracturing Fluids Industry Revenue billion Forecast, by Well Type 2020 & 2033
- Table 2: North America Hydraulic Fracturing Fluids Industry Revenue billion Forecast, by Fluid Type 2020 & 2033
- Table 3: North America Hydraulic Fracturing Fluids Industry Revenue billion Forecast, by Geography 2020 & 2033
- Table 4: North America Hydraulic Fracturing Fluids Industry Revenue billion Forecast, by Region 2020 & 2033
- Table 5: North America Hydraulic Fracturing Fluids Industry Revenue billion Forecast, by Well Type 2020 & 2033
- Table 6: North America Hydraulic Fracturing Fluids Industry Revenue billion Forecast, by Fluid Type 2020 & 2033
- Table 7: North America Hydraulic Fracturing Fluids Industry Revenue billion Forecast, by Geography 2020 & 2033
- Table 8: North America Hydraulic Fracturing Fluids Industry Revenue billion Forecast, by Country 2020 & 2033
- Table 9: North America Hydraulic Fracturing Fluids Industry Revenue billion Forecast, by Well Type 2020 & 2033
- Table 10: North America Hydraulic Fracturing Fluids Industry Revenue billion Forecast, by Fluid Type 2020 & 2033
- Table 11: North America Hydraulic Fracturing Fluids Industry Revenue billion Forecast, by Geography 2020 & 2033
- Table 12: North America Hydraulic Fracturing Fluids Industry Revenue billion Forecast, by Country 2020 & 2033
- Table 13: North America Hydraulic Fracturing Fluids Industry Revenue billion Forecast, by Well Type 2020 & 2033
- Table 14: North America Hydraulic Fracturing Fluids Industry Revenue billion Forecast, by Fluid Type 2020 & 2033
- Table 15: North America Hydraulic Fracturing Fluids Industry Revenue billion Forecast, by Geography 2020 & 2033
- Table 16: North America Hydraulic Fracturing Fluids Industry Revenue billion Forecast, by Country 2020 & 2033
Frequently Asked Questions
1. What is the projected Compound Annual Growth Rate (CAGR) of the North America Hydraulic Fracturing Fluids Industry?
The projected CAGR is approximately 6.2%.
2. Which companies are prominent players in the North America Hydraulic Fracturing Fluids Industry?
Key companies in the market include Ashland Inc, Chevron Phillips Chemical Company LLC, Baker Hughes Co, Schlumberger Ltd, BASF SE, DuPont de Nemours Inc *List Not Exhaustive, Halliburton Company, Akzonobel NV, Clariant International Ltd, Calfrac Well Services Ltd.
3. What are the main segments of the North America Hydraulic Fracturing Fluids Industry?
The market segments include Well Type, Fluid Type, Geography.
4. Can you provide details about the market size?
The market size is estimated to be USD 58.49 billion as of 2022.
5. What are some drivers contributing to market growth?
4.; Presence of Strict Government Regulations to Control Air Pollution.
6. What are the notable trends driving market growth?
Horizontal Wells to Dominate the Market.
7. Are there any restraints impacting market growth?
4.; Increasing Adoption of Renewable Energy.
8. Can you provide examples of recent developments in the market?
N/A
9. What pricing options are available for accessing the report?
Pricing options include single-user, multi-user, and enterprise licenses priced at USD 4750, USD 5250, and USD 8750 respectively.
10. Is the market size provided in terms of value or volume?
The market size is provided in terms of value, measured in billion.
11. Are there any specific market keywords associated with the report?
Yes, the market keyword associated with the report is "North America Hydraulic Fracturing Fluids Industry," which aids in identifying and referencing the specific market segment covered.
12. How do I determine which pricing option suits my needs best?
The pricing options vary based on user requirements and access needs. Individual users may opt for single-user licenses, while businesses requiring broader access may choose multi-user or enterprise licenses for cost-effective access to the report.
13. Are there any additional resources or data provided in the North America Hydraulic Fracturing Fluids Industry report?
While the report offers comprehensive insights, it's advisable to review the specific contents or supplementary materials provided to ascertain if additional resources or data are available.
14. How can I stay updated on further developments or reports in the North America Hydraulic Fracturing Fluids Industry?
To stay informed about further developments, trends, and reports in the North America Hydraulic Fracturing Fluids Industry, consider subscribing to industry newsletters, following relevant companies and organizations, or regularly checking reputable industry news sources and publications.
Methodology
Step 1 - Identification of Relevant Samples Size from Population Database


Step 2 - Approaches for Defining Global Market Size (Value, Volume* & Price*)

Note*: In applicable scenarios
Step 3 - Data Sources
Primary Research
- Web Analytics
- Survey Reports
- Research Institute
- Latest Research Reports
- Opinion Leaders
Secondary Research
- Annual Reports
- White Paper
- Latest Press Release
- Industry Association
- Paid Database
- Investor Presentations

Step 4 - Data Triangulation
Involves using different sources of information in order to increase the validity of a study
These sources are likely to be stakeholders in a program - participants, other researchers, program staff, other community members, and so on.
Then we put all data in single framework & apply various statistical tools to find out the dynamic on the market.
During the analysis stage, feedback from the stakeholder groups would be compared to determine areas of agreement as well as areas of divergence