

Key Insights
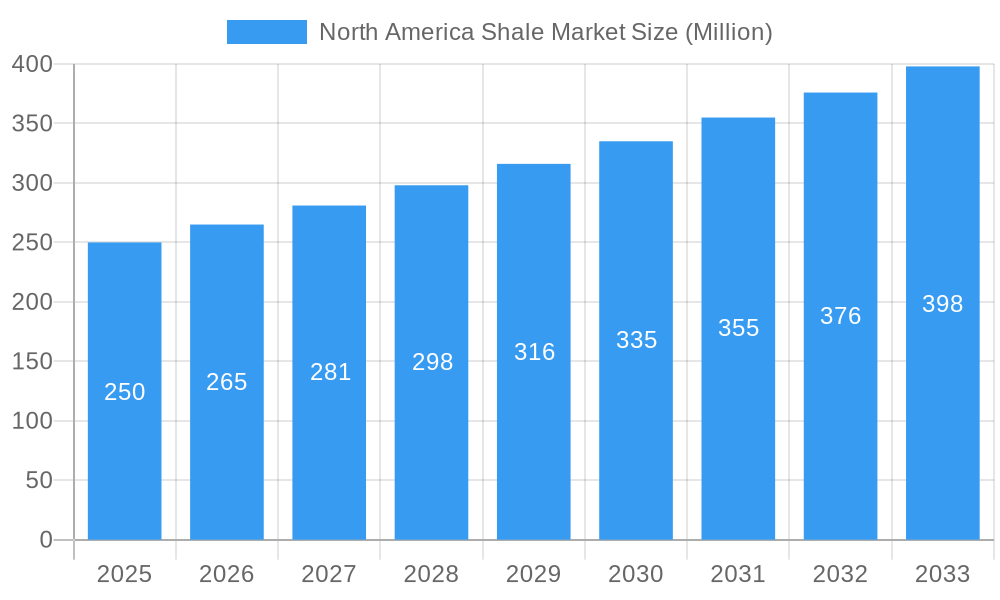
The North American shale market, characterized by the extraction of oil and natural gas from shale formations, is poised for significant expansion. Driven by escalating energy requirements and advancements in horizontal drilling and hydraulic fracturing, the market is projected to reach $88.6 billion by 2024, with an estimated Compound Annual Growth Rate (CAGR) of 5.9% through 2033. Key growth drivers include competitive production costs, continuous technological innovation enhancing extraction efficiency, and favorable government initiatives promoting energy self-sufficiency. The United States leads North American shale production, with Canada and Mexico also contributing to market dynamics.
North America Shale Market Market Size (In Billion)
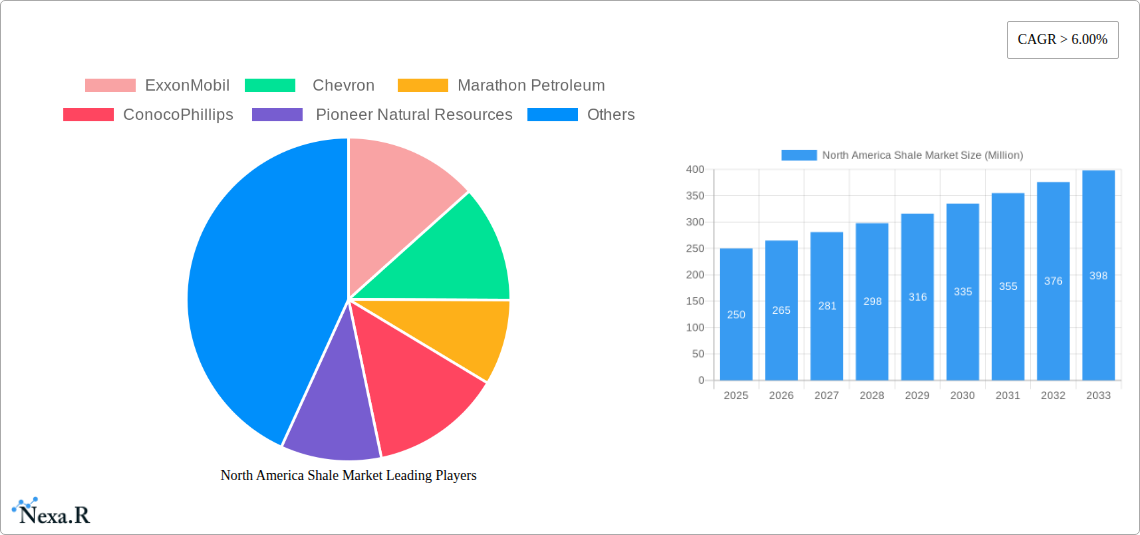
However, the sector confronts challenges such as environmental considerations regarding emissions and water usage, volatility in oil and gas prices, and regulatory complexities impacting land access and environmental stewardship. The market is primarily segmented by product type, with oil shale holding a dominant share, followed by gas shale. Leading industry participants including ExxonMobil, Chevron, Marathon Petroleum, ConocoPhillips, and Pioneer Natural Resources are strategically investing in exploration, production, and technological innovation. The increasing emphasis on sustainable practices and the development of cleaner energy solutions will shape future market trajectories. Despite these obstacles, the North American shale market anticipates sustained growth, addressing regional energy needs through ongoing exploration and production, though environmental concerns and global energy price fluctuations may temper the growth rate. The period from 2025 to 2033 is expected to see industry consolidation as larger entities acquire smaller competitors to strengthen their market position.
North America Shale Market Company Market Share
North America Shale Market: A Comprehensive Market Report (2019-2033)
This in-depth report provides a comprehensive analysis of the North America shale market, covering the period from 2019 to 2033. It delves into market dynamics, growth trends, dominant segments, and key players, offering valuable insights for industry professionals, investors, and strategic decision-makers. The report leverages rigorous data analysis and industry expertise to forecast market growth and identify lucrative opportunities. This analysis includes a focus on the parent market (North American Energy Market) and child market segments (specifically within shale gas and oil production). Market values are presented in million units.
North America Shale Market Market Dynamics & Structure
This section analyzes the North America shale market's structure, identifying key dynamics influencing its growth trajectory. We examine market concentration, revealing the market share held by major players like ExxonMobil, Chevron, Marathon Petroleum, ConocoPhillips, and Pioneer Natural Resources. Technological innovation, primarily focused on enhanced oil recovery (EOR) techniques and horizontal drilling, are detailed alongside regulatory frameworks impacting exploration and production. The report also examines the impact of competitive product substitutes (e.g., renewable energy sources) and end-user demographics (industrial, commercial, residential). Finally, M&A activity within the sector is scrutinized, quantifying deal volumes and assessing their impact on market consolidation.
- Market Concentration: The North American shale market exhibits a moderately concentrated structure, with the top five players holding an estimated xx% market share in 2025.
- Technological Innovation: Significant advancements in horizontal drilling and hydraulic fracturing have driven shale production growth. However, challenges remain in reducing water usage and minimizing environmental impact.
- Regulatory Framework: Varying regulations across North American states impact exploration and production activities, creating both opportunities and challenges for operators.
- M&A Activity: The period 2019-2024 witnessed xx major M&A deals, totaling approximately $xx million, primarily driven by consolidation and resource acquisition.
North America Shale Market Growth Trends & Insights
This section provides a detailed analysis of the North America shale market's growth trends, utilizing both quantitative and qualitative data. The analysis leverages proprietary data and publicly available information to deliver insights into market size evolution (from xx million units in 2019 to a projected xx million units in 2033), adoption rates of new technologies, technological disruptions impacting production efficiency and environmental concerns, and evolving consumer behavior (shifting demand for cleaner energy sources). The Compound Annual Growth Rate (CAGR) for the forecast period (2025-2033) is estimated at xx%. Market penetration is also analyzed, considering factors like geographical reach and penetration within specific end-user sectors. This section also includes an analysis of the shift from conventional to unconventional hydrocarbon resources.
Dominant Regions, Countries, or Segments in North America Shale Market
This section identifies the leading regions, countries, and segments within the North America shale market driving its growth. We analyze the dominance of specific regions (e.g., Permian Basin, Eagle Ford Shale) and countries (e.g., USA, Canada) based on production volume, market share, and growth potential. The analysis considers factors such as economic policies, infrastructure development, and geological resource availability. The report also segments the market by energy type: Solar, Wind, Hydro, Other Types and analyzes their respective contributions to overall market growth.
- Permian Basin Dominance: The Permian Basin continues to be the dominant region, accounting for xx% of total shale production in 2025.
- USA Market Leadership: The USA dominates the North American shale market, contributing approximately xx% of the total production.
- Technological Advancements: Innovations in drilling and completion techniques fuel higher production efficiency and significantly impact dominant regions and segments.
North America Shale Market Product Landscape
This section details the product landscape, encompassing product innovations, applications, and performance metrics. We highlight unique selling propositions (USPs) for various shale gas and oil extraction techniques and technological advancements impacting production efficiency, environmental sustainability, and cost reduction. The discussion incorporates advanced extraction technologies and their market penetration.
Key Drivers, Barriers & Challenges in North America Shale Market
This section identifies key drivers and challenges impacting the North America shale market's growth. Drivers include technological advancements, favorable government policies promoting domestic energy production, and increasing global demand for energy. Challenges include environmental concerns (methane emissions, water usage), fluctuating energy prices, regulatory hurdles, and potential supply chain disruptions, with quantitative impacts estimated where possible.
- Key Drivers: Technological advancements in drilling and fracking, increasing global energy demand.
- Key Challenges: Environmental regulations, price volatility, water scarcity, pipeline infrastructure limitations.
Emerging Opportunities in North America Shale Market
This section highlights emerging opportunities, including untapped markets (e.g., deeper shale formations), innovative applications (e.g., utilization of associated gas for power generation), and evolving consumer preferences (e.g., growing demand for cleaner energy sources and carbon capture technologies).
Growth Accelerators in the North America Shale Market Industry
This section identifies growth accelerators, including technological breakthroughs (e.g., automation, AI-powered analytics), strategic partnerships (e.g., collaborations between energy companies and technology providers), and expansion strategies (e.g., exploration of new shale basins).
Key Players Shaping the North America Shale Market Market
- ExxonMobil
- Chevron
- Marathon Petroleum
- ConocoPhillips
- Pioneer Natural Resources
Notable Milestones in North America Shale Market Sector
- 2020, Q3: Introduction of a new enhanced oil recovery technology by ExxonMobil, boosting production efficiency by xx%.
- 2022, Q1: Chevron announces a major investment in carbon capture technology to reduce emissions from shale operations.
- 2023, Q4: Marathon Petroleum acquires a smaller shale producer, strengthening its market position.
In-Depth North America Shale Market Market Outlook
The North America shale market is poised for continued growth, driven by technological advancements, increasing global energy demand, and ongoing exploration activities. Strategic opportunities exist for companies investing in efficient extraction techniques, carbon capture technologies, and infrastructure development. The market's future depends on navigating environmental concerns and adapting to evolving regulatory frameworks. The forecast period presents significant potential for market expansion and profitability for key players.
North America Shale Market Segmentation
- 1. Production Analysis
- 2. Consumption Analysis
- 3. Import Market Analysis (Value & Volume)
- 4. Export Market Analysis (Value & Volume)
- 5. Price Trend Analysis
North America Shale Market Segmentation By Geography
- 1. United States
- 2. Canada
- 3. Rest of North America
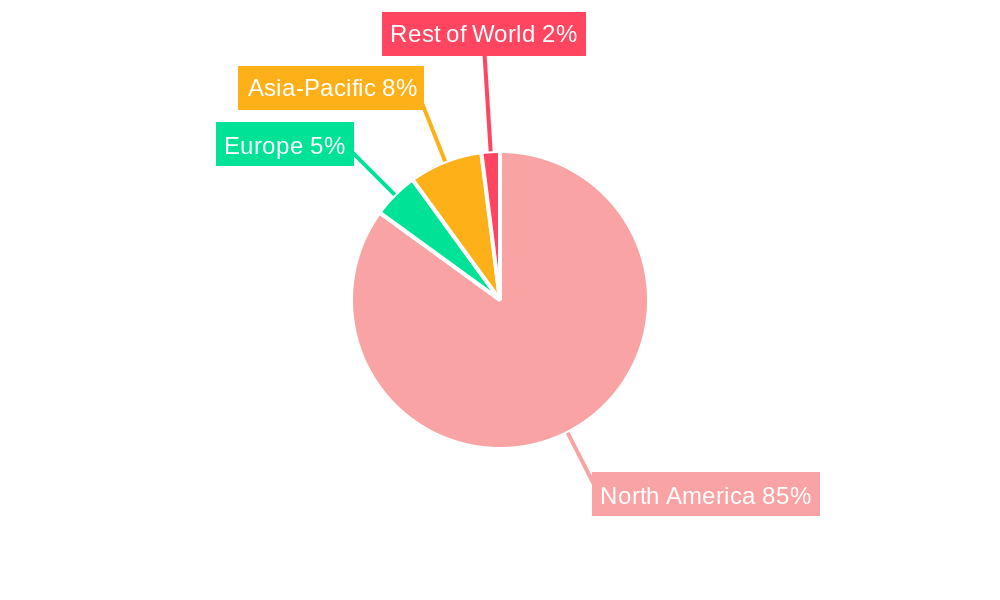
North America Shale Market Regional Market Share
Geographic Coverage of North America Shale Market
North America Shale Market REPORT HIGHLIGHTS
| Aspects | Details |
|---|---|
| Study Period | 2020-2034 |
| Base Year | 2025 |
| Estimated Year | 2026 |
| Forecast Period | 2026-2034 |
| Historical Period | 2020-2025 |
| Growth Rate | CAGR of 5.9% from 2020-2034 |
| Segmentation |
|
Table of Contents
- 1. Introduction
- 1.1. Research Scope
- 1.2. Market Segmentation
- 1.3. Research Objective
- 1.4. Definitions and Assumptions
- 2. Executive Summary
- 2.1. Market Snapshot
- 3. Market Dynamics
- 3.1. Market Drivers
- 3.2. Market Restrains
- 3.3. Market Trends
- 3.4. Market Opportunities
- 4. Market Factor Analysis
- 4.1. Porters Five Forces
- 4.1.1. Bargaining Power of Suppliers
- 4.1.2. Bargaining Power of Buyers
- 4.1.3. Threat of New Entrants
- 4.1.4. Threat of Substitutes
- 4.1.5. Competitive Rivalry
- 4.2. PESTEL analysis
- 4.3. BCG Analysis
- 4.3.1. Stars (High Growth, High Market Share)
- 4.3.2. Cash Cows (Low Growth, High Market Share)
- 4.3.3. Question Mark (High Growth, Low Market Share)
- 4.3.4. Dogs (Low Growth, Low Market Share)
- 4.4. Ansoff Matrix Analysis
- 4.5. Supply Chain Analysis
- 4.6. Regulatory Landscape
- 4.7. Current Market Potential and Opportunity Assessment (TAM–SAM–SOM Framework)
- 4.8. NRP Analyst Note
- 4.1. Porters Five Forces
- 5. Market Analysis, Insights and Forecast 2021-2033
- 5.1. Market Analysis, Insights and Forecast - by Production Analysis
- 5.2. Market Analysis, Insights and Forecast - by Consumption Analysis
- 5.3. Market Analysis, Insights and Forecast - by Import Market Analysis (Value & Volume)
- 5.4. Market Analysis, Insights and Forecast - by Export Market Analysis (Value & Volume)
- 5.5. Market Analysis, Insights and Forecast - by Price Trend Analysis
- 5.6. Market Analysis, Insights and Forecast - by Region
- 5.6.1. United States
- 5.6.2. Canada
- 5.6.3. Rest of North America
- 6. North America Shale Market Analysis, Insights and Forecast, 2021-2033
- 6.1. Market Analysis, Insights and Forecast - by Production Analysis
- 6.2. Market Analysis, Insights and Forecast - by Consumption Analysis
- 6.3. Market Analysis, Insights and Forecast - by Import Market Analysis (Value & Volume)
- 6.4. Market Analysis, Insights and Forecast - by Export Market Analysis (Value & Volume)
- 6.5. Market Analysis, Insights and Forecast - by Price Trend Analysis
- 7. United States North America Shale Market Analysis, Insights and Forecast, 2020-2032
- 7.1. Market Analysis, Insights and Forecast - by Production Analysis
- 7.2. Market Analysis, Insights and Forecast - by Consumption Analysis
- 7.3. Market Analysis, Insights and Forecast - by Import Market Analysis (Value & Volume)
- 7.4. Market Analysis, Insights and Forecast - by Export Market Analysis (Value & Volume)
- 7.5. Market Analysis, Insights and Forecast - by Price Trend Analysis
- 8. Canada North America Shale Market Analysis, Insights and Forecast, 2020-2032
- 8.1. Market Analysis, Insights and Forecast - by Production Analysis
- 8.2. Market Analysis, Insights and Forecast - by Consumption Analysis
- 8.3. Market Analysis, Insights and Forecast - by Import Market Analysis (Value & Volume)
- 8.4. Market Analysis, Insights and Forecast - by Export Market Analysis (Value & Volume)
- 8.5. Market Analysis, Insights and Forecast - by Price Trend Analysis
- 9. Rest of North America North America Shale Market Analysis, Insights and Forecast, 2020-2032
- 9.1. Market Analysis, Insights and Forecast - by Production Analysis
- 9.2. Market Analysis, Insights and Forecast - by Consumption Analysis
- 9.3. Market Analysis, Insights and Forecast - by Import Market Analysis (Value & Volume)
- 9.4. Market Analysis, Insights and Forecast - by Export Market Analysis (Value & Volume)
- 9.5. Market Analysis, Insights and Forecast - by Price Trend Analysis
- 10. Competitive Analysis
- 10.1. Company Profiles
- 10.1.1 ExxonMobil
- 10.1.1.1. Company Overview
- 10.1.1.2. Products
- 10.1.1.3. Company Financials
- 10.1.1.4. SWOT Analysis
- 10.1.2 Chevron
- 10.1.2.1. Company Overview
- 10.1.2.2. Products
- 10.1.2.3. Company Financials
- 10.1.2.4. SWOT Analysis
- 10.1.3 Marathon Petroleum
- 10.1.3.1. Company Overview
- 10.1.3.2. Products
- 10.1.3.3. Company Financials
- 10.1.3.4. SWOT Analysis
- 10.1.4 ConocoPhillips
- 10.1.4.1. Company Overview
- 10.1.4.2. Products
- 10.1.4.3. Company Financials
- 10.1.4.4. SWOT Analysis
- 10.1.5 Pioneer Natural Resources
- 10.1.5.1. Company Overview
- 10.1.5.2. Products
- 10.1.5.3. Company Financials
- 10.1.5.4. SWOT Analysis
- 10.1.1 ExxonMobil
- 10.2. Market Entropy
- 10.2.1 Company's Key Areas Served
- 10.2.2 Recent Developments
- 10.3. Company Market Share Analysis 2025
- 10.3.1 Top 5 Companies Market Share Analysis
- 10.3.2 Top 3 Companies Market Share Analysis
- 10.4. List of Potential Customers
- 11. Research Methodology
List of Figures
- Figure 1: North America Shale Market Revenue Breakdown (billion, %) by Product 2025 & 2033
- Figure 2: North America Shale Market Share (%) by Company 2025
List of Tables
- Table 1: North America Shale Market Revenue billion Forecast, by Production Analysis 2020 & 2033
- Table 2: North America Shale Market Revenue billion Forecast, by Consumption Analysis 2020 & 2033
- Table 3: North America Shale Market Revenue billion Forecast, by Import Market Analysis (Value & Volume) 2020 & 2033
- Table 4: North America Shale Market Revenue billion Forecast, by Export Market Analysis (Value & Volume) 2020 & 2033
- Table 5: North America Shale Market Revenue billion Forecast, by Price Trend Analysis 2020 & 2033
- Table 6: North America Shale Market Revenue billion Forecast, by Region 2020 & 2033
- Table 7: North America Shale Market Revenue billion Forecast, by Production Analysis 2020 & 2033
- Table 8: North America Shale Market Revenue billion Forecast, by Consumption Analysis 2020 & 2033
- Table 9: North America Shale Market Revenue billion Forecast, by Import Market Analysis (Value & Volume) 2020 & 2033
- Table 10: North America Shale Market Revenue billion Forecast, by Export Market Analysis (Value & Volume) 2020 & 2033
- Table 11: North America Shale Market Revenue billion Forecast, by Price Trend Analysis 2020 & 2033
- Table 12: North America Shale Market Revenue billion Forecast, by Country 2020 & 2033
- Table 13: North America Shale Market Revenue billion Forecast, by Production Analysis 2020 & 2033
- Table 14: North America Shale Market Revenue billion Forecast, by Consumption Analysis 2020 & 2033
- Table 15: North America Shale Market Revenue billion Forecast, by Import Market Analysis (Value & Volume) 2020 & 2033
- Table 16: North America Shale Market Revenue billion Forecast, by Export Market Analysis (Value & Volume) 2020 & 2033
- Table 17: North America Shale Market Revenue billion Forecast, by Price Trend Analysis 2020 & 2033
- Table 18: North America Shale Market Revenue billion Forecast, by Country 2020 & 2033
- Table 19: North America Shale Market Revenue billion Forecast, by Production Analysis 2020 & 2033
- Table 20: North America Shale Market Revenue billion Forecast, by Consumption Analysis 2020 & 2033
- Table 21: North America Shale Market Revenue billion Forecast, by Import Market Analysis (Value & Volume) 2020 & 2033
- Table 22: North America Shale Market Revenue billion Forecast, by Export Market Analysis (Value & Volume) 2020 & 2033
- Table 23: North America Shale Market Revenue billion Forecast, by Price Trend Analysis 2020 & 2033
- Table 24: North America Shale Market Revenue billion Forecast, by Country 2020 & 2033
Frequently Asked Questions
1. What is the projected Compound Annual Growth Rate (CAGR) of the North America Shale Market?
The projected CAGR is approximately 5.9%.
2. Which companies are prominent players in the North America Shale Market?
Key companies in the market include ExxonMobil, Chevron , Marathon Petroleum , ConocoPhillips , Pioneer Natural Resources.
3. What are the main segments of the North America Shale Market?
The market segments include Production Analysis, Consumption Analysis, Import Market Analysis (Value & Volume), Export Market Analysis (Value & Volume), Price Trend Analysis.
4. Can you provide details about the market size?
The market size is estimated to be USD 88.6 billion as of 2022.
5. What are some drivers contributing to market growth?
4.; Increasing Number of Offshore Operations 4.; Demand Coming for Unconventional Energy Sources.
6. What are the notable trends driving market growth?
Shale Gas to Dominate the Market.
7. Are there any restraints impacting market growth?
4.; Demand for Renewable Energy.
8. Can you provide examples of recent developments in the market?
N/A
9. What pricing options are available for accessing the report?
Pricing options include single-user, multi-user, and enterprise licenses priced at USD 4750, USD 5250, and USD 8750 respectively.
10. Is the market size provided in terms of value or volume?
The market size is provided in terms of value, measured in billion.
11. Are there any specific market keywords associated with the report?
Yes, the market keyword associated with the report is "North America Shale Market," which aids in identifying and referencing the specific market segment covered.
12. How do I determine which pricing option suits my needs best?
The pricing options vary based on user requirements and access needs. Individual users may opt for single-user licenses, while businesses requiring broader access may choose multi-user or enterprise licenses for cost-effective access to the report.
13. Are there any additional resources or data provided in the North America Shale Market report?
While the report offers comprehensive insights, it's advisable to review the specific contents or supplementary materials provided to ascertain if additional resources or data are available.
14. How can I stay updated on further developments or reports in the North America Shale Market?
To stay informed about further developments, trends, and reports in the North America Shale Market, consider subscribing to industry newsletters, following relevant companies and organizations, or regularly checking reputable industry news sources and publications.
Methodology
Step 1 - Identification of Relevant Samples Size from Population Database


Step 2 - Approaches for Defining Global Market Size (Value, Volume* & Price*)

Note*: In applicable scenarios
Step 3 - Data Sources
Primary Research
- Web Analytics
- Survey Reports
- Research Institute
- Latest Research Reports
- Opinion Leaders
Secondary Research
- Annual Reports
- White Paper
- Latest Press Release
- Industry Association
- Paid Database
- Investor Presentations

Step 4 - Data Triangulation
Involves using different sources of information in order to increase the validity of a study
These sources are likely to be stakeholders in a program - participants, other researchers, program staff, other community members, and so on.
Then we put all data in single framework & apply various statistical tools to find out the dynamic on the market.
During the analysis stage, feedback from the stakeholder groups would be compared to determine areas of agreement as well as areas of divergence