

Key Insights
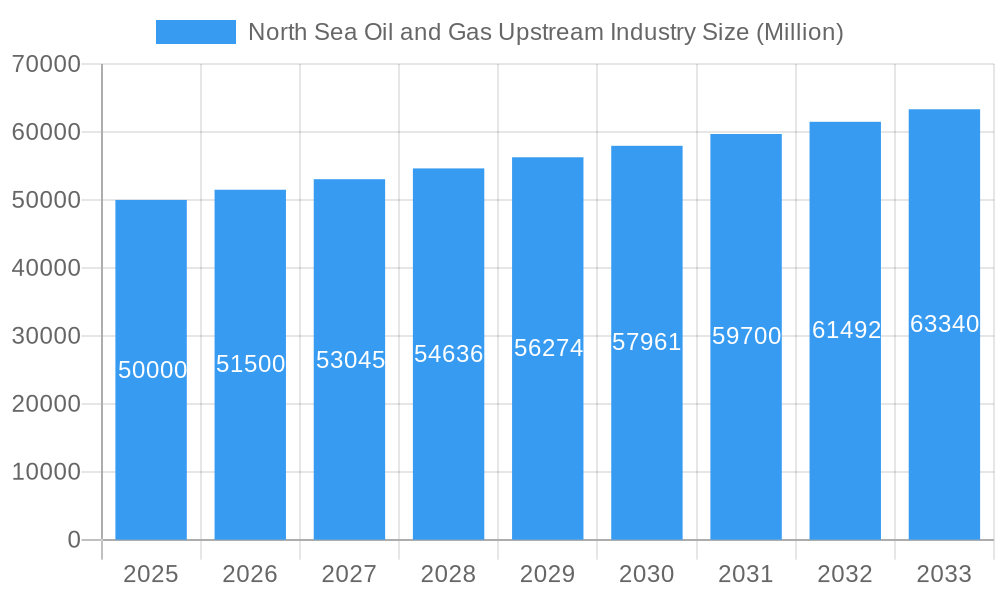
The North Sea oil and gas upstream industry is projected for moderate growth through 2033. The market, valued at $323.83 billion in 2025, is expected to achieve a Compound Annual Growth Rate (CAGR) of 1.35%. This expansion is fueled by sustained, albeit reduced, oil and gas demand from European markets, alongside technological advancements in exploration and extraction, including enhanced oil recovery and improved offshore drilling. The region benefits from existing infrastructure and established operational expertise.
North Sea Oil and Gas Upstream Industry Market Size (In Billion)
Key restraints include depleting reserves, stricter environmental regulations increasing operational costs, and the global transition to renewable energy. Market segmentation across exploration, development, and production, both onshore and offshore, reveals varied growth potential. Offshore production is anticipated to generate higher revenue due to established infrastructure.
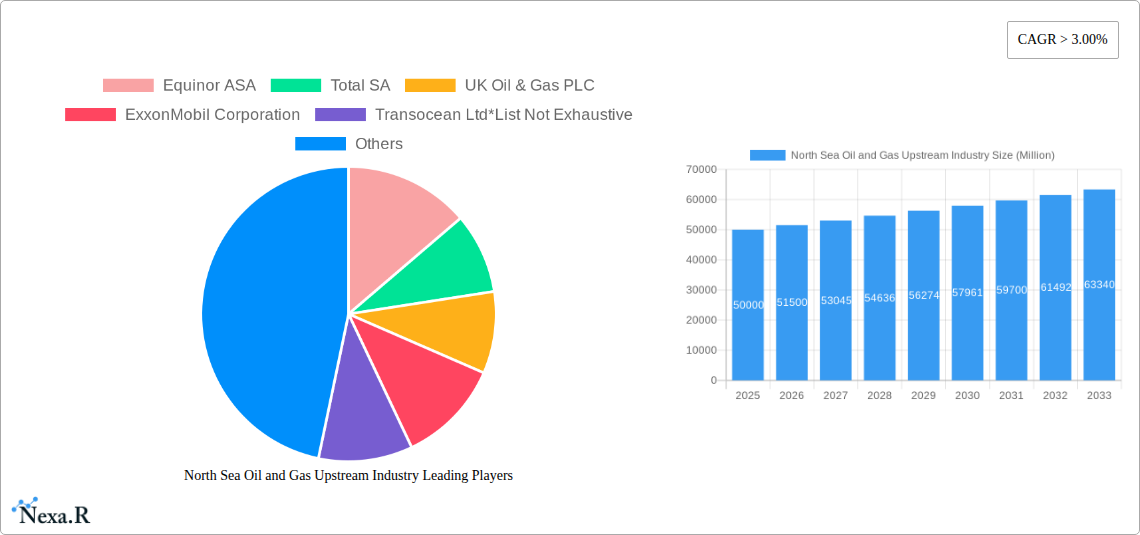
North Sea Oil and Gas Upstream Industry Company Market Share
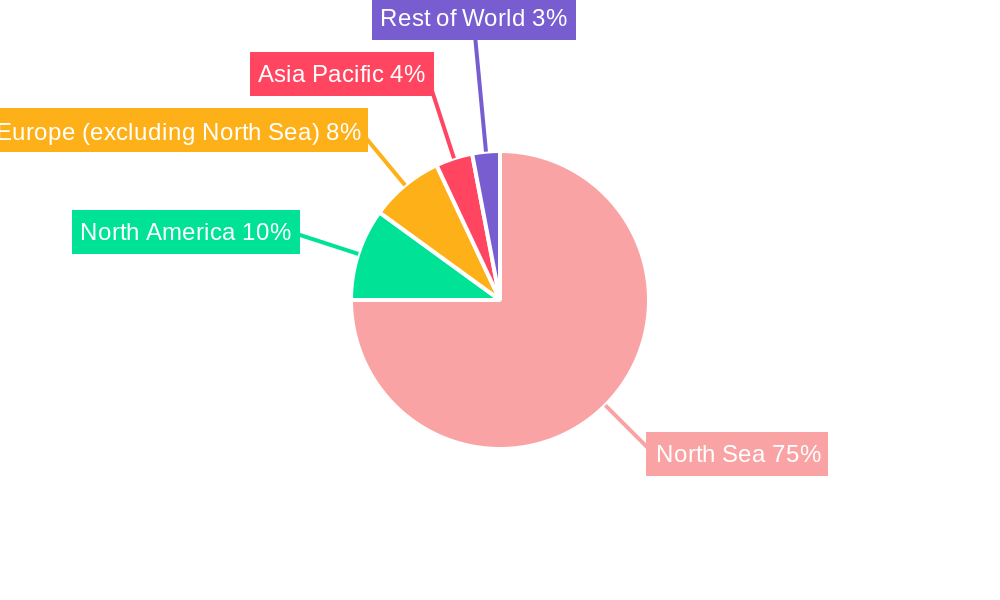
Major players like Equinor ASA, TotalEnergies, and BP PLC are diversifying into renewables, optimizing existing assets, and enhancing operational efficiency and sustainability. Regional market share is concentrated in the North Sea, with potential incremental involvement from North America and Asia-Pacific in technology and services. The 2025-2033 forecast indicates continued, moderated industry expansion, contingent on responsible resource management and investment in sustainable practices, balancing profitability with environmental stewardship and the energy transition.
North Sea Oil and Gas Upstream Industry Market Report: 2019-2033
This comprehensive report provides an in-depth analysis of the North Sea oil and gas upstream industry, covering market dynamics, growth trends, key players, and future outlook. The study period spans from 2019 to 2033, with 2025 as the base and estimated year. The report is crucial for industry professionals, investors, and policymakers seeking to understand this dynamic market. Parent market: Global Oil & Gas Upstream Industry; Child Market: North Sea Oil & Gas Upstream.
North Sea Oil and Gas Upstream Industry Market Dynamics & Structure
This section analyzes the North Sea oil and gas upstream market's competitive landscape, technological advancements, regulatory environment, and market trends. The market is characterized by a moderate level of concentration, with major players like Equinor ASA, TotalEnergies SE, BP PLC, and Shell PLC holding significant market shares (xx%). However, the presence of several smaller independent operators contributes to market dynamism.
Market Concentration & Competitive Landscape:
- High concentration among major IOCs (xx% market share collectively in 2025)
- Growing participation of independent exploration and production companies
- Intense competition for licenses and resources
- Strategic mergers and acquisitions (M&A) activities shaping the market landscape (xx M&A deals in the past 5 years, totaling xx Million)
Technological Innovation & Regulatory Frameworks:
- Technological advancements in exploration (seismic imaging, AI) and production (enhanced oil recovery) are key drivers.
- Stricter environmental regulations (emission reduction targets, carbon capture utilization and storage (CCUS)) are influencing operational strategies.
- Government policies and licensing frameworks play a crucial role in shaping investment decisions.
- Innovation barriers include high capital expenditure needs and technological complexities.
North Sea Oil and Gas Upstream Industry Growth Trends & Insights
The North Sea oil and gas upstream market experienced fluctuating growth during the historical period (2019-2024) due to volatile oil prices and the pandemic. However, recent government initiatives and renewed exploration activity signal a positive outlook for the forecast period (2025-2033). Market size is projected to reach xx Million in 2025 and xx Million by 2033, exhibiting a CAGR of xx%.
- Oil and gas price fluctuations significantly impact market growth.
- Technological advancements increase efficiency and productivity.
- Government policies (e.g., licensing rounds, tax incentives) influence investment and exploration.
- Environmental concerns and decarbonization efforts are reshaping the sector.
Dominant Regions, Countries, or Segments in North Sea Oil and Gas Upstream Industry
The offshore segment dominates the North Sea upstream market, accounting for xx% of total production in 2025, driven by substantial reserves located in deepwater areas. The UK and Norway are the leading countries, characterized by robust infrastructure, established regulatory frameworks, and extensive exploration activities.
Key Drivers for Offshore Dominance:
- Significant reserves in deepwater areas
- Advanced technological capabilities for offshore exploration and production
- Established infrastructure and skilled workforce
Key Drivers for UK and Norway Dominance:
- Favorable regulatory environments and supportive government policies
- Strong investment in exploration and infrastructure development
- Highly skilled workforce and technological expertise
North Sea Oil and Gas Upstream Industry Product Landscape
The product landscape is characterized by a range of exploration and production technologies, including advanced seismic imaging, enhanced oil recovery techniques, and subsea production systems. Innovation focuses on improving efficiency, reducing environmental impact, and accessing harder-to-reach reserves. Unique selling propositions include cost-effectiveness, enhanced safety, and reduced environmental footprint.
Key Drivers, Barriers & Challenges in North Sea Oil and Gas Upstream Industry
Key Drivers:
- Increasing global energy demand
- Government incentives for domestic energy production
- Technological advancements improving efficiency and recovery rates.
Key Challenges & Restraints:
- High exploration and production costs
- Declining reserves in mature fields
- Environmental regulations and concerns, impacting project approvals and operations.
- Supply chain disruptions causing delays and increasing operational costs (estimated xx% increase in 2024).
Emerging Opportunities in North Sea Oil and Gas Upstream Industry
Emerging opportunities include: the development of CCUS technologies, exploration of frontier areas, and the potential for green hydrogen production utilizing existing infrastructure. The integration of renewable energy sources into upstream operations presents a significant avenue for future growth.
Growth Accelerators in the North Sea Oil and Gas Upstream Industry Industry
Long-term growth will be driven by technological breakthroughs in enhanced oil recovery, strategic partnerships between operators and technology providers, and successful exploration in frontier areas. Government initiatives supporting decarbonization and CCUS technologies will also play a vital role.
Key Players Shaping the North Sea Oil and Gas Upstream Industry Market
Notable Milestones in North Sea Oil and Gas Upstream Industry Sector
- February 2022: Six new oil and gas fields approved in the UK North Sea.
- October 2022: UK government restarts North Sea oil and gas exploration licensing.
In-Depth North Sea Oil and Gas Upstream Industry Market Outlook
The North Sea oil and gas upstream market presents significant long-term growth potential, driven by technological innovation, government support, and the enduring demand for fossil fuels. Strategic partnerships and investment in decarbonization technologies will be critical for long-term success in this evolving market. The market's future hinges on successfully balancing energy security needs with environmental sustainability goals.
North Sea Oil and Gas Upstream Industry Segmentation
- 1. Production Analysis
- 2. Consumption Analysis
- 3. Import Market Analysis (Value & Volume)
- 4. Export Market Analysis (Value & Volume)
- 5. Price Trend Analysis
North Sea Oil and Gas Upstream Industry Segmentation By Geography
- 1. United Kingdom
- 2. Norway
- 3. Other Countries
North Sea Oil and Gas Upstream Industry Regional Market Share
Geographic Coverage of North Sea Oil and Gas Upstream Industry
North Sea Oil and Gas Upstream Industry REPORT HIGHLIGHTS
| Aspects | Details |
|---|---|
| Study Period | 2020-2034 |
| Base Year | 2025 |
| Estimated Year | 2026 |
| Forecast Period | 2026-2034 |
| Historical Period | 2020-2025 |
| Growth Rate | CAGR of 1.35% from 2020-2034 |
| Segmentation |
|
Table of Contents
- 1. Introduction
- 1.1. Research Scope
- 1.2. Market Segmentation
- 1.3. Research Objective
- 1.4. Definitions and Assumptions
- 2. Executive Summary
- 2.1. Market Snapshot
- 3. Market Dynamics
- 3.1. Market Drivers
- 3.2. Market Restrains
- 3.3. Market Trends
- 3.4. Market Opportunities
- 4. Market Factor Analysis
- 4.1. Porters Five Forces
- 4.1.1. Bargaining Power of Suppliers
- 4.1.2. Bargaining Power of Buyers
- 4.1.3. Threat of New Entrants
- 4.1.4. Threat of Substitutes
- 4.1.5. Competitive Rivalry
- 4.2. PESTEL analysis
- 4.3. BCG Analysis
- 4.3.1. Stars (High Growth, High Market Share)
- 4.3.2. Cash Cows (Low Growth, High Market Share)
- 4.3.3. Question Mark (High Growth, Low Market Share)
- 4.3.4. Dogs (Low Growth, Low Market Share)
- 4.4. Ansoff Matrix Analysis
- 4.5. Supply Chain Analysis
- 4.6. Regulatory Landscape
- 4.7. Current Market Potential and Opportunity Assessment (TAM–SAM–SOM Framework)
- 4.8. NRP Analyst Note
- 4.1. Porters Five Forces
- 5. Market Analysis, Insights and Forecast 2021-2033
- 5.1. Market Analysis, Insights and Forecast - by Production Analysis
- 5.2. Market Analysis, Insights and Forecast - by Consumption Analysis
- 5.3. Market Analysis, Insights and Forecast - by Import Market Analysis (Value & Volume)
- 5.4. Market Analysis, Insights and Forecast - by Export Market Analysis (Value & Volume)
- 5.5. Market Analysis, Insights and Forecast - by Price Trend Analysis
- 5.6. Market Analysis, Insights and Forecast - by Region
- 5.6.1. United Kingdom
- 5.6.2. Norway
- 5.6.3. Other Countries
- 6. Global North Sea Oil and Gas Upstream Industry Analysis, Insights and Forecast, 2021-2033
- 6.1. Market Analysis, Insights and Forecast - by Production Analysis
- 6.2. Market Analysis, Insights and Forecast - by Consumption Analysis
- 6.3. Market Analysis, Insights and Forecast - by Import Market Analysis (Value & Volume)
- 6.4. Market Analysis, Insights and Forecast - by Export Market Analysis (Value & Volume)
- 6.5. Market Analysis, Insights and Forecast - by Price Trend Analysis
- 7. United Kingdom North Sea Oil and Gas Upstream Industry Analysis, Insights and Forecast, 2020-2032
- 7.1. Market Analysis, Insights and Forecast - by Production Analysis
- 7.2. Market Analysis, Insights and Forecast - by Consumption Analysis
- 7.3. Market Analysis, Insights and Forecast - by Import Market Analysis (Value & Volume)
- 7.4. Market Analysis, Insights and Forecast - by Export Market Analysis (Value & Volume)
- 7.5. Market Analysis, Insights and Forecast - by Price Trend Analysis
- 8. Norway North Sea Oil and Gas Upstream Industry Analysis, Insights and Forecast, 2020-2032
- 8.1. Market Analysis, Insights and Forecast - by Production Analysis
- 8.2. Market Analysis, Insights and Forecast - by Consumption Analysis
- 8.3. Market Analysis, Insights and Forecast - by Import Market Analysis (Value & Volume)
- 8.4. Market Analysis, Insights and Forecast - by Export Market Analysis (Value & Volume)
- 8.5. Market Analysis, Insights and Forecast - by Price Trend Analysis
- 9. Other Countries North Sea Oil and Gas Upstream Industry Analysis, Insights and Forecast, 2020-2032
- 9.1. Market Analysis, Insights and Forecast - by Production Analysis
- 9.2. Market Analysis, Insights and Forecast - by Consumption Analysis
- 9.3. Market Analysis, Insights and Forecast - by Import Market Analysis (Value & Volume)
- 9.4. Market Analysis, Insights and Forecast - by Export Market Analysis (Value & Volume)
- 9.5. Market Analysis, Insights and Forecast - by Price Trend Analysis
- 10. Competitive Analysis
- 10.1. Company Profiles
- 10.1.1 Equinor ASA
- 10.1.1.1. Company Overview
- 10.1.1.2. Products
- 10.1.1.3. Company Financials
- 10.1.1.4. SWOT Analysis
- 10.1.2 Total SA
- 10.1.2.1. Company Overview
- 10.1.2.2. Products
- 10.1.2.3. Company Financials
- 10.1.2.4. SWOT Analysis
- 10.1.3 UK Oil & Gas PLC
- 10.1.3.1. Company Overview
- 10.1.3.2. Products
- 10.1.3.3. Company Financials
- 10.1.3.4. SWOT Analysis
- 10.1.4 ExxonMobil Corporation
- 10.1.4.1. Company Overview
- 10.1.4.2. Products
- 10.1.4.3. Company Financials
- 10.1.4.4. SWOT Analysis
- 10.1.5 Transocean Ltd*List Not Exhaustive
- 10.1.5.1. Company Overview
- 10.1.5.2. Products
- 10.1.5.3. Company Financials
- 10.1.5.4. SWOT Analysis
- 10.1.6 Royal Dutch Shell PLC
- 10.1.6.1. Company Overview
- 10.1.6.2. Products
- 10.1.6.3. Company Financials
- 10.1.6.4. SWOT Analysis
- 10.1.7 Eni SpA
- 10.1.7.1. Company Overview
- 10.1.7.2. Products
- 10.1.7.3. Company Financials
- 10.1.7.4. SWOT Analysis
- 10.1.8 BP PLC
- 10.1.8.1. Company Overview
- 10.1.8.2. Products
- 10.1.8.3. Company Financials
- 10.1.8.4. SWOT Analysis
- 10.1.9 Schlumberger Limited
- 10.1.9.1. Company Overview
- 10.1.9.2. Products
- 10.1.9.3. Company Financials
- 10.1.9.4. SWOT Analysis
- 10.1.1 Equinor ASA
- 10.2. Market Entropy
- 10.2.1 Company's Key Areas Served
- 10.2.2 Recent Developments
- 10.3. Company Market Share Analysis 2025
- 10.3.1 Top 5 Companies Market Share Analysis
- 10.3.2 Top 3 Companies Market Share Analysis
- 10.4. List of Potential Customers
- 11. Research Methodology
List of Figures
- Figure 1: Global North Sea Oil and Gas Upstream Industry Revenue Breakdown (billion, %) by Region 2025 & 2033
- Figure 2: United Kingdom North Sea Oil and Gas Upstream Industry Revenue (billion), by Production Analysis 2025 & 2033
- Figure 3: United Kingdom North Sea Oil and Gas Upstream Industry Revenue Share (%), by Production Analysis 2025 & 2033
- Figure 4: United Kingdom North Sea Oil and Gas Upstream Industry Revenue (billion), by Consumption Analysis 2025 & 2033
- Figure 5: United Kingdom North Sea Oil and Gas Upstream Industry Revenue Share (%), by Consumption Analysis 2025 & 2033
- Figure 6: United Kingdom North Sea Oil and Gas Upstream Industry Revenue (billion), by Import Market Analysis (Value & Volume) 2025 & 2033
- Figure 7: United Kingdom North Sea Oil and Gas Upstream Industry Revenue Share (%), by Import Market Analysis (Value & Volume) 2025 & 2033
- Figure 8: United Kingdom North Sea Oil and Gas Upstream Industry Revenue (billion), by Export Market Analysis (Value & Volume) 2025 & 2033
- Figure 9: United Kingdom North Sea Oil and Gas Upstream Industry Revenue Share (%), by Export Market Analysis (Value & Volume) 2025 & 2033
- Figure 10: United Kingdom North Sea Oil and Gas Upstream Industry Revenue (billion), by Price Trend Analysis 2025 & 2033
- Figure 11: United Kingdom North Sea Oil and Gas Upstream Industry Revenue Share (%), by Price Trend Analysis 2025 & 2033
- Figure 12: United Kingdom North Sea Oil and Gas Upstream Industry Revenue (billion), by Country 2025 & 2033
- Figure 13: United Kingdom North Sea Oil and Gas Upstream Industry Revenue Share (%), by Country 2025 & 2033
- Figure 14: Norway North Sea Oil and Gas Upstream Industry Revenue (billion), by Production Analysis 2025 & 2033
- Figure 15: Norway North Sea Oil and Gas Upstream Industry Revenue Share (%), by Production Analysis 2025 & 2033
- Figure 16: Norway North Sea Oil and Gas Upstream Industry Revenue (billion), by Consumption Analysis 2025 & 2033
- Figure 17: Norway North Sea Oil and Gas Upstream Industry Revenue Share (%), by Consumption Analysis 2025 & 2033
- Figure 18: Norway North Sea Oil and Gas Upstream Industry Revenue (billion), by Import Market Analysis (Value & Volume) 2025 & 2033
- Figure 19: Norway North Sea Oil and Gas Upstream Industry Revenue Share (%), by Import Market Analysis (Value & Volume) 2025 & 2033
- Figure 20: Norway North Sea Oil and Gas Upstream Industry Revenue (billion), by Export Market Analysis (Value & Volume) 2025 & 2033
- Figure 21: Norway North Sea Oil and Gas Upstream Industry Revenue Share (%), by Export Market Analysis (Value & Volume) 2025 & 2033
- Figure 22: Norway North Sea Oil and Gas Upstream Industry Revenue (billion), by Price Trend Analysis 2025 & 2033
- Figure 23: Norway North Sea Oil and Gas Upstream Industry Revenue Share (%), by Price Trend Analysis 2025 & 2033
- Figure 24: Norway North Sea Oil and Gas Upstream Industry Revenue (billion), by Country 2025 & 2033
- Figure 25: Norway North Sea Oil and Gas Upstream Industry Revenue Share (%), by Country 2025 & 2033
- Figure 26: Other Countries North Sea Oil and Gas Upstream Industry Revenue (billion), by Production Analysis 2025 & 2033
- Figure 27: Other Countries North Sea Oil and Gas Upstream Industry Revenue Share (%), by Production Analysis 2025 & 2033
- Figure 28: Other Countries North Sea Oil and Gas Upstream Industry Revenue (billion), by Consumption Analysis 2025 & 2033
- Figure 29: Other Countries North Sea Oil and Gas Upstream Industry Revenue Share (%), by Consumption Analysis 2025 & 2033
- Figure 30: Other Countries North Sea Oil and Gas Upstream Industry Revenue (billion), by Import Market Analysis (Value & Volume) 2025 & 2033
- Figure 31: Other Countries North Sea Oil and Gas Upstream Industry Revenue Share (%), by Import Market Analysis (Value & Volume) 2025 & 2033
- Figure 32: Other Countries North Sea Oil and Gas Upstream Industry Revenue (billion), by Export Market Analysis (Value & Volume) 2025 & 2033
- Figure 33: Other Countries North Sea Oil and Gas Upstream Industry Revenue Share (%), by Export Market Analysis (Value & Volume) 2025 & 2033
- Figure 34: Other Countries North Sea Oil and Gas Upstream Industry Revenue (billion), by Price Trend Analysis 2025 & 2033
- Figure 35: Other Countries North Sea Oil and Gas Upstream Industry Revenue Share (%), by Price Trend Analysis 2025 & 2033
- Figure 36: Other Countries North Sea Oil and Gas Upstream Industry Revenue (billion), by Country 2025 & 2033
- Figure 37: Other Countries North Sea Oil and Gas Upstream Industry Revenue Share (%), by Country 2025 & 2033
List of Tables
- Table 1: Global North Sea Oil and Gas Upstream Industry Revenue billion Forecast, by Production Analysis 2020 & 2033
- Table 2: Global North Sea Oil and Gas Upstream Industry Revenue billion Forecast, by Consumption Analysis 2020 & 2033
- Table 3: Global North Sea Oil and Gas Upstream Industry Revenue billion Forecast, by Import Market Analysis (Value & Volume) 2020 & 2033
- Table 4: Global North Sea Oil and Gas Upstream Industry Revenue billion Forecast, by Export Market Analysis (Value & Volume) 2020 & 2033
- Table 5: Global North Sea Oil and Gas Upstream Industry Revenue billion Forecast, by Price Trend Analysis 2020 & 2033
- Table 6: Global North Sea Oil and Gas Upstream Industry Revenue billion Forecast, by Region 2020 & 2033
- Table 7: Global North Sea Oil and Gas Upstream Industry Revenue billion Forecast, by Production Analysis 2020 & 2033
- Table 8: Global North Sea Oil and Gas Upstream Industry Revenue billion Forecast, by Consumption Analysis 2020 & 2033
- Table 9: Global North Sea Oil and Gas Upstream Industry Revenue billion Forecast, by Import Market Analysis (Value & Volume) 2020 & 2033
- Table 10: Global North Sea Oil and Gas Upstream Industry Revenue billion Forecast, by Export Market Analysis (Value & Volume) 2020 & 2033
- Table 11: Global North Sea Oil and Gas Upstream Industry Revenue billion Forecast, by Price Trend Analysis 2020 & 2033
- Table 12: Global North Sea Oil and Gas Upstream Industry Revenue billion Forecast, by Country 2020 & 2033
- Table 13: Global North Sea Oil and Gas Upstream Industry Revenue billion Forecast, by Production Analysis 2020 & 2033
- Table 14: Global North Sea Oil and Gas Upstream Industry Revenue billion Forecast, by Consumption Analysis 2020 & 2033
- Table 15: Global North Sea Oil and Gas Upstream Industry Revenue billion Forecast, by Import Market Analysis (Value & Volume) 2020 & 2033
- Table 16: Global North Sea Oil and Gas Upstream Industry Revenue billion Forecast, by Export Market Analysis (Value & Volume) 2020 & 2033
- Table 17: Global North Sea Oil and Gas Upstream Industry Revenue billion Forecast, by Price Trend Analysis 2020 & 2033
- Table 18: Global North Sea Oil and Gas Upstream Industry Revenue billion Forecast, by Country 2020 & 2033
- Table 19: Global North Sea Oil and Gas Upstream Industry Revenue billion Forecast, by Production Analysis 2020 & 2033
- Table 20: Global North Sea Oil and Gas Upstream Industry Revenue billion Forecast, by Consumption Analysis 2020 & 2033
- Table 21: Global North Sea Oil and Gas Upstream Industry Revenue billion Forecast, by Import Market Analysis (Value & Volume) 2020 & 2033
- Table 22: Global North Sea Oil and Gas Upstream Industry Revenue billion Forecast, by Export Market Analysis (Value & Volume) 2020 & 2033
- Table 23: Global North Sea Oil and Gas Upstream Industry Revenue billion Forecast, by Price Trend Analysis 2020 & 2033
- Table 24: Global North Sea Oil and Gas Upstream Industry Revenue billion Forecast, by Country 2020 & 2033
Frequently Asked Questions
1. What is the projected Compound Annual Growth Rate (CAGR) of the North Sea Oil and Gas Upstream Industry?
The projected CAGR is approximately 1.35%.
2. Which companies are prominent players in the North Sea Oil and Gas Upstream Industry?
Key companies in the market include Equinor ASA, Total SA, UK Oil & Gas PLC, ExxonMobil Corporation, Transocean Ltd*List Not Exhaustive, Royal Dutch Shell PLC, Eni SpA, BP PLC, Schlumberger Limited.
3. What are the main segments of the North Sea Oil and Gas Upstream Industry?
The market segments include Production Analysis, Consumption Analysis, Import Market Analysis (Value & Volume), Export Market Analysis (Value & Volume), Price Trend Analysis.
4. Can you provide details about the market size?
The market size is estimated to be USD 323.83 billion as of 2022.
5. What are some drivers contributing to market growth?
4.; Increasing Demand for Wood Pellets in Clean Energy Generation4.; Growing Wood Pellet Manufacturing Infrastructure.
6. What are the notable trends driving market growth?
Shallow Water Segment Expected to See Significant Market Growth.
7. Are there any restraints impacting market growth?
4.; The Adoption and Increasing Deployment of Alternative Renewable Energy.
8. Can you provide examples of recent developments in the market?
In February 2022, six new oil and gas fields in the North Sea received approval from the UK government. The finance department pushed the senior authorities to fast-track the licenses for constructing these six energy areas.
9. What pricing options are available for accessing the report?
Pricing options include single-user, multi-user, and enterprise licenses priced at USD 4750, USD 5250, and USD 8750 respectively.
10. Is the market size provided in terms of value or volume?
The market size is provided in terms of value, measured in billion.
11. Are there any specific market keywords associated with the report?
Yes, the market keyword associated with the report is "North Sea Oil and Gas Upstream Industry," which aids in identifying and referencing the specific market segment covered.
12. How do I determine which pricing option suits my needs best?
The pricing options vary based on user requirements and access needs. Individual users may opt for single-user licenses, while businesses requiring broader access may choose multi-user or enterprise licenses for cost-effective access to the report.
13. Are there any additional resources or data provided in the North Sea Oil and Gas Upstream Industry report?
While the report offers comprehensive insights, it's advisable to review the specific contents or supplementary materials provided to ascertain if additional resources or data are available.
14. How can I stay updated on further developments or reports in the North Sea Oil and Gas Upstream Industry?
To stay informed about further developments, trends, and reports in the North Sea Oil and Gas Upstream Industry, consider subscribing to industry newsletters, following relevant companies and organizations, or regularly checking reputable industry news sources and publications.
Methodology
Step 1 - Identification of Relevant Samples Size from Population Database


Step 2 - Approaches for Defining Global Market Size (Value, Volume* & Price*)

Note*: In applicable scenarios
Step 3 - Data Sources
Primary Research
- Web Analytics
- Survey Reports
- Research Institute
- Latest Research Reports
- Opinion Leaders
Secondary Research
- Annual Reports
- White Paper
- Latest Press Release
- Industry Association
- Paid Database
- Investor Presentations

Step 4 - Data Triangulation
Involves using different sources of information in order to increase the validity of a study
These sources are likely to be stakeholders in a program - participants, other researchers, program staff, other community members, and so on.
Then we put all data in single framework & apply various statistical tools to find out the dynamic on the market.
During the analysis stage, feedback from the stakeholder groups would be compared to determine areas of agreement as well as areas of divergence