

Key Insights
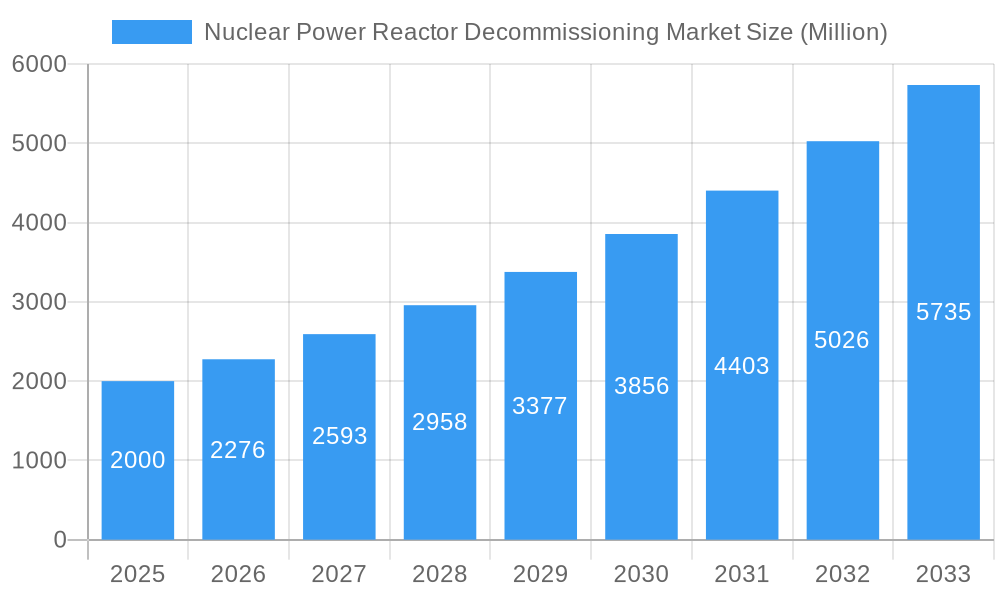
The Nuclear Power Reactor Decommissioning market is poised for significant expansion, driven by the global aging nuclear fleet and evolving regulatory mandates for safe and efficient shutdown. The market was valued at $8170.1 million in 2023 and is projected to grow at a Compound Annual Growth Rate (CAGR) of 4%. Key growth drivers include an increasing number of reactors reaching end-of-life, heightened safety standards, and advancements in dismantling and waste management technologies. The market is segmented by reactor type, application, and capacity. North America, Europe, and Asia-Pacific lead the market due to substantial installed bases of aging reactors and established decommissioning infrastructure.
Nuclear Power Reactor Decommissioning Market Market Size (In Billion)
Intense competition characterizes the market, with key players focusing on technological innovation and service portfolio expansion. While high costs and regulatory complexities present challenges, the long-term outlook remains robust, supported by ongoing technological advancements and a global emphasis on nuclear safety. Significant investment opportunities are attracting new market participants.
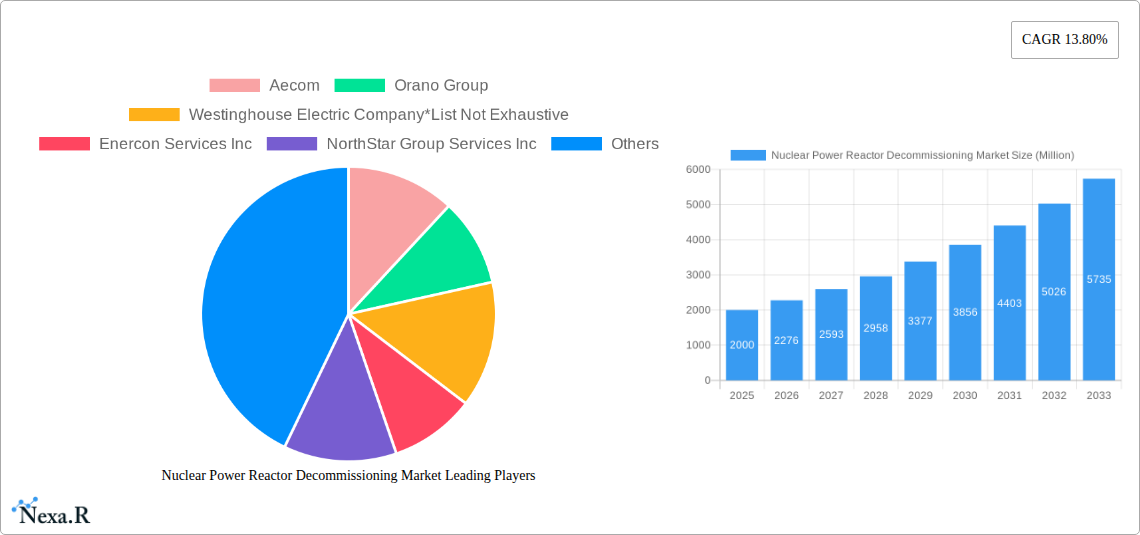
Nuclear Power Reactor Decommissioning Market Company Market Share
Nuclear Power Reactor Decommissioning Market: A Comprehensive Report (2019-2033)
This comprehensive report provides a detailed analysis of the global Nuclear Power Reactor Decommissioning market, offering invaluable insights for industry professionals, investors, and strategic decision-makers. The study covers the period from 2019 to 2033, with 2025 serving as the base and estimated year. The market is segmented by reactor type, application, and capacity, providing a granular understanding of the diverse landscape. Key players such as Aecom, Orano Group, Westinghouse Electric Company, Enercon Services Inc, NorthStar Group Services Inc, GE Hitachi Nuclear Services, James Fisher & Sons PLC, Bechtel Group Inc, Fluor Corporation, Babcock International Group PLC, and Studsvik AB are analyzed, though the list is not exhaustive. The report projects a market value reaching xx Million by 2033.
Nuclear Power Reactor Decommissioning Market Dynamics & Structure
The nuclear power reactor decommissioning market is characterized by a moderately concentrated structure with a few large players dominating the landscape. Technological innovation, driven by advancements in robotics, remote handling systems, and waste management techniques, is a crucial factor shaping market growth. Stringent regulatory frameworks governing nuclear waste disposal and safety protocols significantly influence industry practices. While there are few direct competitive substitutes, the market faces indirect competition from alternative energy sources. The end-user demographic primarily consists of government agencies, nuclear power plant operators, and specialized decommissioning contractors. M&A activities are prevalent, with larger companies acquiring smaller firms to expand their service portfolios and geographic reach.
- Market Concentration: Moderately concentrated, with top 5 players holding approximately xx% market share in 2025.
- Technological Innovation: Focus on automation, robotics, and advanced waste treatment technologies.
- Regulatory Framework: Stringent regulations impacting decommissioning timelines and costs.
- Competitive Substitutes: Limited direct substitutes, but indirect competition from renewable energy sources.
- M&A Activity: Significant M&A activity observed in the historical period, with an average of xx deals per year.
Nuclear Power Reactor Decommissioning Market Growth Trends & Insights
The global nuclear power reactor decommissioning market is experiencing robust growth, driven by the aging nuclear power plant infrastructure globally and increasing regulatory pressure for timely decommissioning. The market size witnessed a Compound Annual Growth Rate (CAGR) of xx% during the historical period (2019-2024) and is projected to maintain a CAGR of xx% during the forecast period (2025-2033). This growth is fueled by factors such as rising demand for safe and efficient decommissioning solutions, technological advancements, and increasing government initiatives. The market penetration rate is expected to reach xx% by 2033. Technological disruptions, such as the development of advanced robotics and AI-driven solutions, are accelerating the decommissioning process and reducing costs. Changes in consumer behavior are minimal, as the market is largely B2B focused.
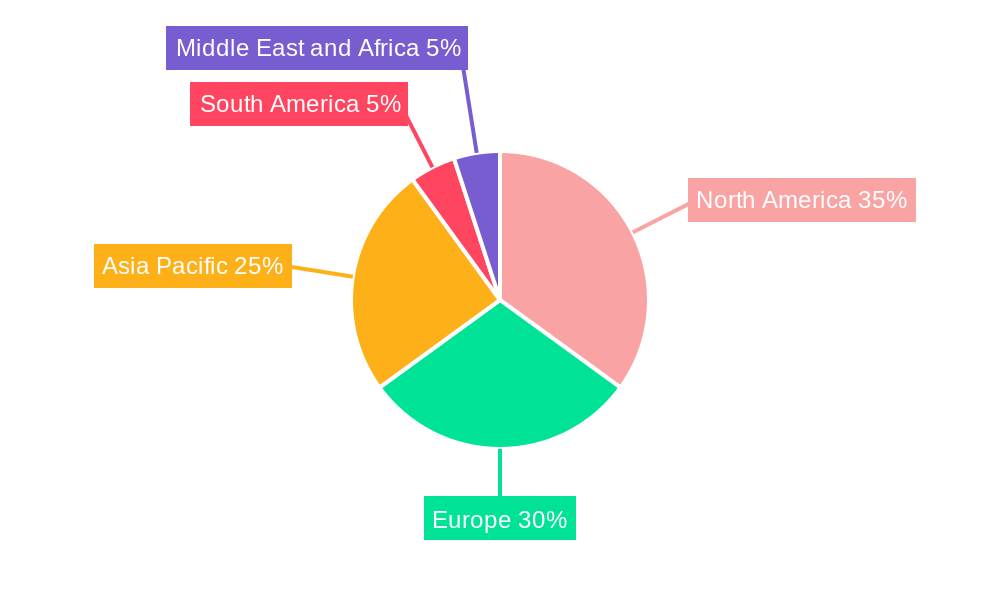
Dominant Regions, Countries, or Segments in Nuclear Power Reactor Decommissioning Market
North America currently holds the largest market share, primarily driven by the presence of numerous aging nuclear power plants and supportive government regulations. Europe follows as a significant market, owing to its mature nuclear power industry. Within the segments, the Pressurized Water Reactor (PWR) segment dominates due to the widespread use of PWR technology globally. The Commercial Power Reactor application segment constitutes the largest share due to the substantial number of commercial reactors approaching the end of their operational lifespan. The 100-1000 MW capacity segment is also prominent, aligning with the majority of operational reactors.
- Key Drivers (North America): Large number of aging nuclear plants, stringent regulations, robust government funding.
- Key Drivers (Europe): High density of operational nuclear plants, stringent environmental regulations, technological advancements.
- Segment Dominance (Reactor Type): Pressurized Water Reactor (PWR) due to global prevalence.
- Segment Dominance (Application): Commercial Power Reactor due to large number of decommissioning projects.
- Segment Dominance (Capacity): 100-1000 MW, reflecting the typical capacity of operational reactors.
Nuclear Power Reactor Decommissioning Market Product Landscape
The product landscape is characterized by a wide range of services including site characterization, dismantling, waste management, and site restoration. Innovations focus on automation, robotics, and advanced waste treatment technologies to enhance efficiency and safety. Unique selling propositions include specialized expertise in handling radioactive materials, advanced decommissioning techniques, and comprehensive project management capabilities. Technological advancements, such as the development of remote-controlled robots and AI-powered monitoring systems, are improving the safety and speed of decommissioning processes.
Key Drivers, Barriers & Challenges in Nuclear Power Reactor Decommissioning Market
Key Drivers: Aging nuclear power plant infrastructure, stringent regulatory requirements for timely decommissioning, government incentives and funding, and advancements in decommissioning technologies.
Challenges & Restraints: High decommissioning costs, complex regulatory approvals and licensing processes, the need for specialized expertise and equipment, and potential environmental and public safety concerns. Supply chain issues relating to specialized equipment can also lead to project delays, with an estimated xx% of projects experiencing delays due to this.
Emerging Opportunities in Nuclear Power Reactor Decommissioning Market
Emerging opportunities include the increasing demand for decommissioning services in developing countries with expanding nuclear power programs. Innovative applications of advanced technologies, such as AI and robotics, will enhance efficiency and cost-effectiveness. Evolving consumer preferences are minimal, as the target clients are primarily governmental bodies and regulated industries. The market offers potential growth in developing specialized services for different reactor types and sizes.
Growth Accelerators in the Nuclear Power Reactor Decommissioning Market Industry
Technological breakthroughs in robotics, AI, and waste management are significantly accelerating market growth. Strategic partnerships between technology providers and decommissioning contractors are driving innovation and cost reduction. Market expansion strategies, focusing on emerging economies with increasing numbers of aging nuclear plants, represent significant growth opportunities.
Key Players Shaping the Nuclear Power Reactor Decommissioning Market Market
- Aecom
- Orano Group
- Westinghouse Electric Company
- Enercon Services Inc
- NorthStar Group Services Inc
- GE Hitachi Nuclear Services
- James Fisher & Sons PLC
- Bechtel Group Inc
- Fluor Corporation
- Babcock International Group PLC
- Studsvik AB
Notable Milestones in Nuclear Power Reactor Decommissioning Market Sector
- 2022: Introduction of a new robotic system by [Company Name] significantly reducing decommissioning time.
- 2021: Successful completion of a large-scale decommissioning project by [Company Name] showcasing advanced waste management techniques.
- 2020: Regulatory changes in [Country] easing the approval process for decommissioning projects. (Further milestones can be added as data becomes available.)
In-Depth Nuclear Power Reactor Decommissioning Market Market Outlook
The future of the nuclear power reactor decommissioning market is promising, driven by the continued aging of existing nuclear power plants worldwide and the increasing adoption of stringent safety regulations. Strategic opportunities lie in leveraging technological advancements to enhance efficiency, safety, and cost-effectiveness. Focusing on emerging markets and developing specialized services for different reactor types will further propel market growth. The global market is poised for sustained expansion, offering significant opportunities for both established and emerging players.
Nuclear Power Reactor Decommissioning Market Segmentation
-
1. Reactor Type
- 1.1. Pressurized Water Reactor
- 1.2. Pressurized Heavy Water Reactor
- 1.3. Boiling Water Reactor
- 1.4. High-temperature Gas-cooled Reactor
- 1.5. Liquid Metal Fast Breeder Reactor
- 1.6. Other Reactor Types
-
2. Application
- 2.1. Commercial Power Reactor
- 2.2. Prototype Power Reactor
- 2.3. Research Reactor
-
3. Capacity
- 3.1. Below 100 MW
- 3.2. 100-1000 MW
- 3.3. Above 1000 MW
Nuclear Power Reactor Decommissioning Market Segmentation By Geography
- 1. North America
- 2. Asia Pacific
- 3. Europe
- 4. South America
- 5. Middle East and Africa
Nuclear Power Reactor Decommissioning Market Regional Market Share
Geographic Coverage of Nuclear Power Reactor Decommissioning Market
Nuclear Power Reactor Decommissioning Market REPORT HIGHLIGHTS
| Aspects | Details |
|---|---|
| Study Period | 2020-2034 |
| Base Year | 2025 |
| Estimated Year | 2026 |
| Forecast Period | 2026-2034 |
| Historical Period | 2020-2025 |
| Growth Rate | CAGR of 4% from 2020-2034 |
| Segmentation |
|
Table of Contents
- 1. Introduction
- 1.1. Research Scope
- 1.2. Market Segmentation
- 1.3. Research Objective
- 1.4. Definitions and Assumptions
- 2. Executive Summary
- 2.1. Market Snapshot
- 3. Market Dynamics
- 3.1. Market Drivers
- 3.2. Market Restrains
- 3.3. Market Trends
- 3.4. Market Opportunities
- 4. Market Factor Analysis
- 4.1. Porters Five Forces
- 4.1.1. Bargaining Power of Suppliers
- 4.1.2. Bargaining Power of Buyers
- 4.1.3. Threat of New Entrants
- 4.1.4. Threat of Substitutes
- 4.1.5. Competitive Rivalry
- 4.2. PESTEL analysis
- 4.3. BCG Analysis
- 4.3.1. Stars (High Growth, High Market Share)
- 4.3.2. Cash Cows (Low Growth, High Market Share)
- 4.3.3. Question Mark (High Growth, Low Market Share)
- 4.3.4. Dogs (Low Growth, Low Market Share)
- 4.4. Ansoff Matrix Analysis
- 4.5. Supply Chain Analysis
- 4.6. Regulatory Landscape
- 4.7. Current Market Potential and Opportunity Assessment (TAM–SAM–SOM Framework)
- 4.8. NRP Analyst Note
- 4.1. Porters Five Forces
- 5. Market Analysis, Insights and Forecast 2021-2033
- 5.1. Market Analysis, Insights and Forecast - by Reactor Type
- 5.1.1. Pressurized Water Reactor
- 5.1.2. Pressurized Heavy Water Reactor
- 5.1.3. Boiling Water Reactor
- 5.1.4. High-temperature Gas-cooled Reactor
- 5.1.5. Liquid Metal Fast Breeder Reactor
- 5.1.6. Other Reactor Types
- 5.2. Market Analysis, Insights and Forecast - by Application
- 5.2.1. Commercial Power Reactor
- 5.2.2. Prototype Power Reactor
- 5.2.3. Research Reactor
- 5.3. Market Analysis, Insights and Forecast - by Capacity
- 5.3.1. Below 100 MW
- 5.3.2. 100-1000 MW
- 5.3.3. Above 1000 MW
- 5.4. Market Analysis, Insights and Forecast - by Region
- 5.4.1. North America
- 5.4.2. Asia Pacific
- 5.4.3. Europe
- 5.4.4. South America
- 5.4.5. Middle East and Africa
- 5.1. Market Analysis, Insights and Forecast - by Reactor Type
- 6. Global Nuclear Power Reactor Decommissioning Market Analysis, Insights and Forecast, 2021-2033
- 6.1. Market Analysis, Insights and Forecast - by Reactor Type
- 6.1.1. Pressurized Water Reactor
- 6.1.2. Pressurized Heavy Water Reactor
- 6.1.3. Boiling Water Reactor
- 6.1.4. High-temperature Gas-cooled Reactor
- 6.1.5. Liquid Metal Fast Breeder Reactor
- 6.1.6. Other Reactor Types
- 6.2. Market Analysis, Insights and Forecast - by Application
- 6.2.1. Commercial Power Reactor
- 6.2.2. Prototype Power Reactor
- 6.2.3. Research Reactor
- 6.3. Market Analysis, Insights and Forecast - by Capacity
- 6.3.1. Below 100 MW
- 6.3.2. 100-1000 MW
- 6.3.3. Above 1000 MW
- 6.1. Market Analysis, Insights and Forecast - by Reactor Type
- 7. North America Nuclear Power Reactor Decommissioning Market Analysis, Insights and Forecast, 2020-2032
- 7.1. Market Analysis, Insights and Forecast - by Reactor Type
- 7.1.1. Pressurized Water Reactor
- 7.1.2. Pressurized Heavy Water Reactor
- 7.1.3. Boiling Water Reactor
- 7.1.4. High-temperature Gas-cooled Reactor
- 7.1.5. Liquid Metal Fast Breeder Reactor
- 7.1.6. Other Reactor Types
- 7.2. Market Analysis, Insights and Forecast - by Application
- 7.2.1. Commercial Power Reactor
- 7.2.2. Prototype Power Reactor
- 7.2.3. Research Reactor
- 7.3. Market Analysis, Insights and Forecast - by Capacity
- 7.3.1. Below 100 MW
- 7.3.2. 100-1000 MW
- 7.3.3. Above 1000 MW
- 7.1. Market Analysis, Insights and Forecast - by Reactor Type
- 8. Asia Pacific Nuclear Power Reactor Decommissioning Market Analysis, Insights and Forecast, 2020-2032
- 8.1. Market Analysis, Insights and Forecast - by Reactor Type
- 8.1.1. Pressurized Water Reactor
- 8.1.2. Pressurized Heavy Water Reactor
- 8.1.3. Boiling Water Reactor
- 8.1.4. High-temperature Gas-cooled Reactor
- 8.1.5. Liquid Metal Fast Breeder Reactor
- 8.1.6. Other Reactor Types
- 8.2. Market Analysis, Insights and Forecast - by Application
- 8.2.1. Commercial Power Reactor
- 8.2.2. Prototype Power Reactor
- 8.2.3. Research Reactor
- 8.3. Market Analysis, Insights and Forecast - by Capacity
- 8.3.1. Below 100 MW
- 8.3.2. 100-1000 MW
- 8.3.3. Above 1000 MW
- 8.1. Market Analysis, Insights and Forecast - by Reactor Type
- 9. Europe Nuclear Power Reactor Decommissioning Market Analysis, Insights and Forecast, 2020-2032
- 9.1. Market Analysis, Insights and Forecast - by Reactor Type
- 9.1.1. Pressurized Water Reactor
- 9.1.2. Pressurized Heavy Water Reactor
- 9.1.3. Boiling Water Reactor
- 9.1.4. High-temperature Gas-cooled Reactor
- 9.1.5. Liquid Metal Fast Breeder Reactor
- 9.1.6. Other Reactor Types
- 9.2. Market Analysis, Insights and Forecast - by Application
- 9.2.1. Commercial Power Reactor
- 9.2.2. Prototype Power Reactor
- 9.2.3. Research Reactor
- 9.3. Market Analysis, Insights and Forecast - by Capacity
- 9.3.1. Below 100 MW
- 9.3.2. 100-1000 MW
- 9.3.3. Above 1000 MW
- 9.1. Market Analysis, Insights and Forecast - by Reactor Type
- 10. South America Nuclear Power Reactor Decommissioning Market Analysis, Insights and Forecast, 2020-2032
- 10.1. Market Analysis, Insights and Forecast - by Reactor Type
- 10.1.1. Pressurized Water Reactor
- 10.1.2. Pressurized Heavy Water Reactor
- 10.1.3. Boiling Water Reactor
- 10.1.4. High-temperature Gas-cooled Reactor
- 10.1.5. Liquid Metal Fast Breeder Reactor
- 10.1.6. Other Reactor Types
- 10.2. Market Analysis, Insights and Forecast - by Application
- 10.2.1. Commercial Power Reactor
- 10.2.2. Prototype Power Reactor
- 10.2.3. Research Reactor
- 10.3. Market Analysis, Insights and Forecast - by Capacity
- 10.3.1. Below 100 MW
- 10.3.2. 100-1000 MW
- 10.3.3. Above 1000 MW
- 10.1. Market Analysis, Insights and Forecast - by Reactor Type
- 11. Middle East and Africa Nuclear Power Reactor Decommissioning Market Analysis, Insights and Forecast, 2020-2032
- 11.1. Market Analysis, Insights and Forecast - by Reactor Type
- 11.1.1. Pressurized Water Reactor
- 11.1.2. Pressurized Heavy Water Reactor
- 11.1.3. Boiling Water Reactor
- 11.1.4. High-temperature Gas-cooled Reactor
- 11.1.5. Liquid Metal Fast Breeder Reactor
- 11.1.6. Other Reactor Types
- 11.2. Market Analysis, Insights and Forecast - by Application
- 11.2.1. Commercial Power Reactor
- 11.2.2. Prototype Power Reactor
- 11.2.3. Research Reactor
- 11.3. Market Analysis, Insights and Forecast - by Capacity
- 11.3.1. Below 100 MW
- 11.3.2. 100-1000 MW
- 11.3.3. Above 1000 MW
- 11.1. Market Analysis, Insights and Forecast - by Reactor Type
- 12. Competitive Analysis
- 12.1. Company Profiles
- 12.1.1 Aecom
- 12.1.1.1. Company Overview
- 12.1.1.2. Products
- 12.1.1.3. Company Financials
- 12.1.1.4. SWOT Analysis
- 12.1.2 Orano Group
- 12.1.2.1. Company Overview
- 12.1.2.2. Products
- 12.1.2.3. Company Financials
- 12.1.2.4. SWOT Analysis
- 12.1.3 Westinghouse Electric Company*List Not Exhaustive
- 12.1.3.1. Company Overview
- 12.1.3.2. Products
- 12.1.3.3. Company Financials
- 12.1.3.4. SWOT Analysis
- 12.1.4 Enercon Services Inc
- 12.1.4.1. Company Overview
- 12.1.4.2. Products
- 12.1.4.3. Company Financials
- 12.1.4.4. SWOT Analysis
- 12.1.5 NorthStar Group Services Inc
- 12.1.5.1. Company Overview
- 12.1.5.2. Products
- 12.1.5.3. Company Financials
- 12.1.5.4. SWOT Analysis
- 12.1.6 GE Hitachi Nuclear Services
- 12.1.6.1. Company Overview
- 12.1.6.2. Products
- 12.1.6.3. Company Financials
- 12.1.6.4. SWOT Analysis
- 12.1.7 James Fisher & Sons PLC
- 12.1.7.1. Company Overview
- 12.1.7.2. Products
- 12.1.7.3. Company Financials
- 12.1.7.4. SWOT Analysis
- 12.1.8 Bechtel Group Inc
- 12.1.8.1. Company Overview
- 12.1.8.2. Products
- 12.1.8.3. Company Financials
- 12.1.8.4. SWOT Analysis
- 12.1.9 Fluor Corporation
- 12.1.9.1. Company Overview
- 12.1.9.2. Products
- 12.1.9.3. Company Financials
- 12.1.9.4. SWOT Analysis
- 12.1.10 Babcock International Group PLC
- 12.1.10.1. Company Overview
- 12.1.10.2. Products
- 12.1.10.3. Company Financials
- 12.1.10.4. SWOT Analysis
- 12.1.11 Studsvik AB
- 12.1.11.1. Company Overview
- 12.1.11.2. Products
- 12.1.11.3. Company Financials
- 12.1.11.4. SWOT Analysis
- 12.1.1 Aecom
- 12.2. Market Entropy
- 12.2.1 Company's Key Areas Served
- 12.2.2 Recent Developments
- 12.3. Company Market Share Analysis 2025
- 12.3.1 Top 5 Companies Market Share Analysis
- 12.3.2 Top 3 Companies Market Share Analysis
- 12.4. List of Potential Customers
- 13. Research Methodology
List of Figures
- Figure 1: Global Nuclear Power Reactor Decommissioning Market Revenue Breakdown (million, %) by Region 2025 & 2033
- Figure 2: North America Nuclear Power Reactor Decommissioning Market Revenue (million), by Reactor Type 2025 & 2033
- Figure 3: North America Nuclear Power Reactor Decommissioning Market Revenue Share (%), by Reactor Type 2025 & 2033
- Figure 4: North America Nuclear Power Reactor Decommissioning Market Revenue (million), by Application 2025 & 2033
- Figure 5: North America Nuclear Power Reactor Decommissioning Market Revenue Share (%), by Application 2025 & 2033
- Figure 6: North America Nuclear Power Reactor Decommissioning Market Revenue (million), by Capacity 2025 & 2033
- Figure 7: North America Nuclear Power Reactor Decommissioning Market Revenue Share (%), by Capacity 2025 & 2033
- Figure 8: North America Nuclear Power Reactor Decommissioning Market Revenue (million), by Country 2025 & 2033
- Figure 9: North America Nuclear Power Reactor Decommissioning Market Revenue Share (%), by Country 2025 & 2033
- Figure 10: Asia Pacific Nuclear Power Reactor Decommissioning Market Revenue (million), by Reactor Type 2025 & 2033
- Figure 11: Asia Pacific Nuclear Power Reactor Decommissioning Market Revenue Share (%), by Reactor Type 2025 & 2033
- Figure 12: Asia Pacific Nuclear Power Reactor Decommissioning Market Revenue (million), by Application 2025 & 2033
- Figure 13: Asia Pacific Nuclear Power Reactor Decommissioning Market Revenue Share (%), by Application 2025 & 2033
- Figure 14: Asia Pacific Nuclear Power Reactor Decommissioning Market Revenue (million), by Capacity 2025 & 2033
- Figure 15: Asia Pacific Nuclear Power Reactor Decommissioning Market Revenue Share (%), by Capacity 2025 & 2033
- Figure 16: Asia Pacific Nuclear Power Reactor Decommissioning Market Revenue (million), by Country 2025 & 2033
- Figure 17: Asia Pacific Nuclear Power Reactor Decommissioning Market Revenue Share (%), by Country 2025 & 2033
- Figure 18: Europe Nuclear Power Reactor Decommissioning Market Revenue (million), by Reactor Type 2025 & 2033
- Figure 19: Europe Nuclear Power Reactor Decommissioning Market Revenue Share (%), by Reactor Type 2025 & 2033
- Figure 20: Europe Nuclear Power Reactor Decommissioning Market Revenue (million), by Application 2025 & 2033
- Figure 21: Europe Nuclear Power Reactor Decommissioning Market Revenue Share (%), by Application 2025 & 2033
- Figure 22: Europe Nuclear Power Reactor Decommissioning Market Revenue (million), by Capacity 2025 & 2033
- Figure 23: Europe Nuclear Power Reactor Decommissioning Market Revenue Share (%), by Capacity 2025 & 2033
- Figure 24: Europe Nuclear Power Reactor Decommissioning Market Revenue (million), by Country 2025 & 2033
- Figure 25: Europe Nuclear Power Reactor Decommissioning Market Revenue Share (%), by Country 2025 & 2033
- Figure 26: South America Nuclear Power Reactor Decommissioning Market Revenue (million), by Reactor Type 2025 & 2033
- Figure 27: South America Nuclear Power Reactor Decommissioning Market Revenue Share (%), by Reactor Type 2025 & 2033
- Figure 28: South America Nuclear Power Reactor Decommissioning Market Revenue (million), by Application 2025 & 2033
- Figure 29: South America Nuclear Power Reactor Decommissioning Market Revenue Share (%), by Application 2025 & 2033
- Figure 30: South America Nuclear Power Reactor Decommissioning Market Revenue (million), by Capacity 2025 & 2033
- Figure 31: South America Nuclear Power Reactor Decommissioning Market Revenue Share (%), by Capacity 2025 & 2033
- Figure 32: South America Nuclear Power Reactor Decommissioning Market Revenue (million), by Country 2025 & 2033
- Figure 33: South America Nuclear Power Reactor Decommissioning Market Revenue Share (%), by Country 2025 & 2033
- Figure 34: Middle East and Africa Nuclear Power Reactor Decommissioning Market Revenue (million), by Reactor Type 2025 & 2033
- Figure 35: Middle East and Africa Nuclear Power Reactor Decommissioning Market Revenue Share (%), by Reactor Type 2025 & 2033
- Figure 36: Middle East and Africa Nuclear Power Reactor Decommissioning Market Revenue (million), by Application 2025 & 2033
- Figure 37: Middle East and Africa Nuclear Power Reactor Decommissioning Market Revenue Share (%), by Application 2025 & 2033
- Figure 38: Middle East and Africa Nuclear Power Reactor Decommissioning Market Revenue (million), by Capacity 2025 & 2033
- Figure 39: Middle East and Africa Nuclear Power Reactor Decommissioning Market Revenue Share (%), by Capacity 2025 & 2033
- Figure 40: Middle East and Africa Nuclear Power Reactor Decommissioning Market Revenue (million), by Country 2025 & 2033
- Figure 41: Middle East and Africa Nuclear Power Reactor Decommissioning Market Revenue Share (%), by Country 2025 & 2033
List of Tables
- Table 1: Global Nuclear Power Reactor Decommissioning Market Revenue million Forecast, by Reactor Type 2020 & 2033
- Table 2: Global Nuclear Power Reactor Decommissioning Market Revenue million Forecast, by Application 2020 & 2033
- Table 3: Global Nuclear Power Reactor Decommissioning Market Revenue million Forecast, by Capacity 2020 & 2033
- Table 4: Global Nuclear Power Reactor Decommissioning Market Revenue million Forecast, by Region 2020 & 2033
- Table 5: Global Nuclear Power Reactor Decommissioning Market Revenue million Forecast, by Reactor Type 2020 & 2033
- Table 6: Global Nuclear Power Reactor Decommissioning Market Revenue million Forecast, by Application 2020 & 2033
- Table 7: Global Nuclear Power Reactor Decommissioning Market Revenue million Forecast, by Capacity 2020 & 2033
- Table 8: Global Nuclear Power Reactor Decommissioning Market Revenue million Forecast, by Country 2020 & 2033
- Table 9: Global Nuclear Power Reactor Decommissioning Market Revenue million Forecast, by Reactor Type 2020 & 2033
- Table 10: Global Nuclear Power Reactor Decommissioning Market Revenue million Forecast, by Application 2020 & 2033
- Table 11: Global Nuclear Power Reactor Decommissioning Market Revenue million Forecast, by Capacity 2020 & 2033
- Table 12: Global Nuclear Power Reactor Decommissioning Market Revenue million Forecast, by Country 2020 & 2033
- Table 13: Global Nuclear Power Reactor Decommissioning Market Revenue million Forecast, by Reactor Type 2020 & 2033
- Table 14: Global Nuclear Power Reactor Decommissioning Market Revenue million Forecast, by Application 2020 & 2033
- Table 15: Global Nuclear Power Reactor Decommissioning Market Revenue million Forecast, by Capacity 2020 & 2033
- Table 16: Global Nuclear Power Reactor Decommissioning Market Revenue million Forecast, by Country 2020 & 2033
- Table 17: Global Nuclear Power Reactor Decommissioning Market Revenue million Forecast, by Reactor Type 2020 & 2033
- Table 18: Global Nuclear Power Reactor Decommissioning Market Revenue million Forecast, by Application 2020 & 2033
- Table 19: Global Nuclear Power Reactor Decommissioning Market Revenue million Forecast, by Capacity 2020 & 2033
- Table 20: Global Nuclear Power Reactor Decommissioning Market Revenue million Forecast, by Country 2020 & 2033
- Table 21: Global Nuclear Power Reactor Decommissioning Market Revenue million Forecast, by Reactor Type 2020 & 2033
- Table 22: Global Nuclear Power Reactor Decommissioning Market Revenue million Forecast, by Application 2020 & 2033
- Table 23: Global Nuclear Power Reactor Decommissioning Market Revenue million Forecast, by Capacity 2020 & 2033
- Table 24: Global Nuclear Power Reactor Decommissioning Market Revenue million Forecast, by Country 2020 & 2033
Frequently Asked Questions
1. What is the projected Compound Annual Growth Rate (CAGR) of the Nuclear Power Reactor Decommissioning Market?
The projected CAGR is approximately 4%.
2. Which companies are prominent players in the Nuclear Power Reactor Decommissioning Market?
Key companies in the market include Aecom, Orano Group, Westinghouse Electric Company*List Not Exhaustive, Enercon Services Inc, NorthStar Group Services Inc, GE Hitachi Nuclear Services, James Fisher & Sons PLC, Bechtel Group Inc, Fluor Corporation, Babcock International Group PLC, Studsvik AB.
3. What are the main segments of the Nuclear Power Reactor Decommissioning Market?
The market segments include Reactor Type, Application, Capacity.
4. Can you provide details about the market size?
The market size is estimated to be USD 8170.1 million as of 2022.
5. What are some drivers contributing to market growth?
4.; Presence of Strict Government Regulations to Control Air Pollution.
6. What are the notable trends driving market growth?
Commercial Reactors Segment is Expected to Dominate the Market.
7. Are there any restraints impacting market growth?
4.; Increasing Adoption of Renewable Energy.
8. Can you provide examples of recent developments in the market?
N/A
9. What pricing options are available for accessing the report?
Pricing options include single-user, multi-user, and enterprise licenses priced at USD 4750, USD 5250, and USD 8750 respectively.
10. Is the market size provided in terms of value or volume?
The market size is provided in terms of value, measured in million.
11. Are there any specific market keywords associated with the report?
Yes, the market keyword associated with the report is "Nuclear Power Reactor Decommissioning Market," which aids in identifying and referencing the specific market segment covered.
12. How do I determine which pricing option suits my needs best?
The pricing options vary based on user requirements and access needs. Individual users may opt for single-user licenses, while businesses requiring broader access may choose multi-user or enterprise licenses for cost-effective access to the report.
13. Are there any additional resources or data provided in the Nuclear Power Reactor Decommissioning Market report?
While the report offers comprehensive insights, it's advisable to review the specific contents or supplementary materials provided to ascertain if additional resources or data are available.
14. How can I stay updated on further developments or reports in the Nuclear Power Reactor Decommissioning Market?
To stay informed about further developments, trends, and reports in the Nuclear Power Reactor Decommissioning Market, consider subscribing to industry newsletters, following relevant companies and organizations, or regularly checking reputable industry news sources and publications.
Methodology
Step 1 - Identification of Relevant Samples Size from Population Database


Step 2 - Approaches for Defining Global Market Size (Value, Volume* & Price*)

Note*: In applicable scenarios
Step 3 - Data Sources
Primary Research
- Web Analytics
- Survey Reports
- Research Institute
- Latest Research Reports
- Opinion Leaders
Secondary Research
- Annual Reports
- White Paper
- Latest Press Release
- Industry Association
- Paid Database
- Investor Presentations

Step 4 - Data Triangulation
Involves using different sources of information in order to increase the validity of a study
These sources are likely to be stakeholders in a program - participants, other researchers, program staff, other community members, and so on.
Then we put all data in single framework & apply various statistical tools to find out the dynamic on the market.
During the analysis stage, feedback from the stakeholder groups would be compared to determine areas of agreement as well as areas of divergence