

Key Insights
The global oil and gas pump market is poised for significant expansion, driven by escalating exploration and production activities worldwide. Projections indicate a Compound Annual Growth Rate (CAGR) of 8.8%, reflecting sustained market growth fueled by key industry drivers. Increasing global energy demand, particularly from emerging economies, necessitates advanced oil and gas extraction, directly boosting the requirement for efficient and dependable pumping solutions. Innovations such as intelligent pumps, offering enhanced performance and remote monitoring, are also contributing to market acceleration. The market is strategically segmented by pump type, including dynamic and positive displacement pumps, and by application, encompassing upstream, midstream, and downstream operations. Dynamic pumps currently lead the market due to their broad applicability, while positive displacement pumps serve specialized high-pressure and precise flow control needs. The upstream segment, integral to exploration and drilling, is anticipated to experience robust growth, supported by ongoing onshore and offshore exploration initiatives. However, market dynamics are influenced by potential restraints such as volatile oil and gas prices, stringent environmental regulations, and a growing emphasis on renewable energy alternatives. Notwithstanding these challenges, the oil and gas pump market's long-term outlook remains optimistic, with continued growth anticipated throughout the forecast period.
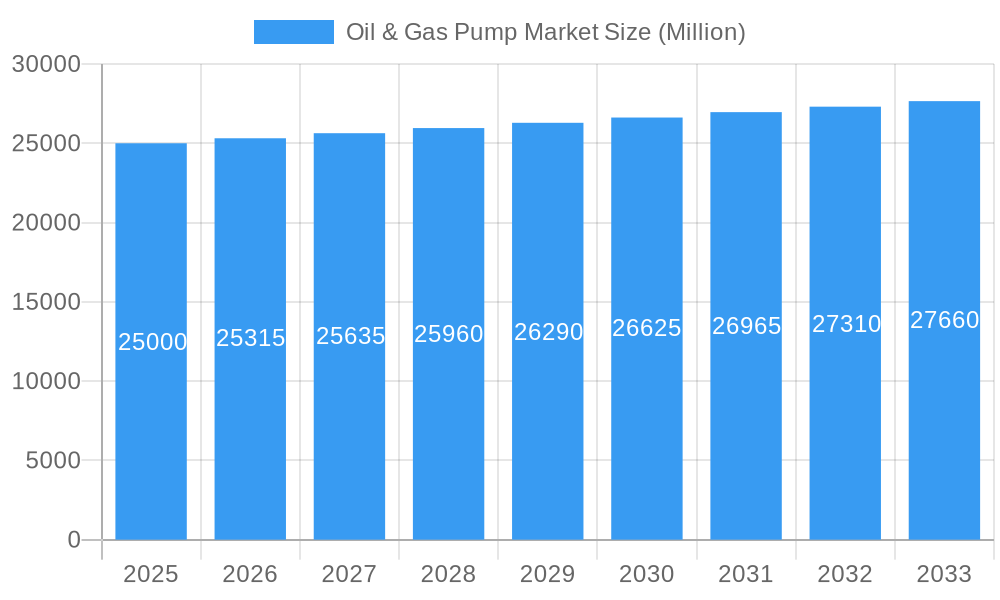
Oil & Gas Pump Market Market Size (In Billion)
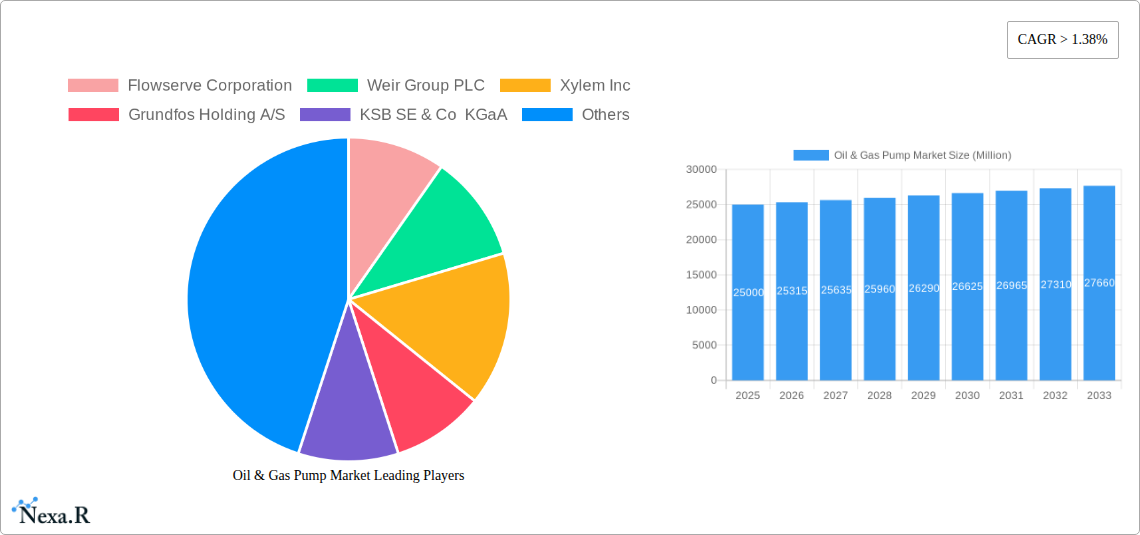
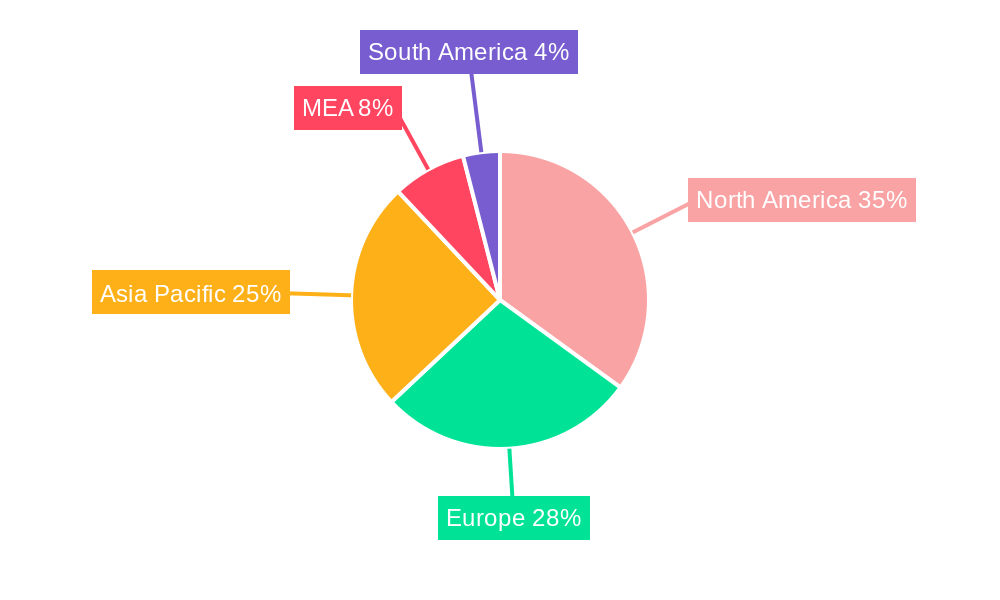
Geographically, the market is prominently represented across North America, Europe, and the Asia-Pacific region. North America commands a substantial market share, underpinned by vigorous oil and gas operations in the United States and Canada. Europe maintains a strong presence, while the Asia-Pacific region offers substantial growth potential, driven by significant investments in energy infrastructure and rising energy consumption in nations like China and India. The Middle East and Africa region presents considerable opportunities due to its extensive oil and gas reserves. Leading manufacturers, including Flowserve Corporation, Weir Group PLC, and Xylem Inc., are actively enhancing their product offerings and expanding their global reach to meet escalating demand. Strategic collaborations, mergers, and acquisitions are also reshaping the competitive landscape, fostering innovation and market consolidation. The forecast period, from 2025 to 2033, is expected to witness continued technological advancements, expansion into nascent markets, and an amplified focus on sustainability within the oil and gas sector, all of which will shape the market's growth trajectory.
Oil & Gas Pump Market Company Market Share
The global oil and gas pump market is projected to reach $14.27 billion by 2025, growing at a CAGR of 8.8% from the base year. Unit: billion.
Oil & Gas Pump Market: A Comprehensive Market Report (2019-2033)
This comprehensive report provides a detailed analysis of the Oil & Gas Pump Market, encompassing market dynamics, growth trends, regional dominance, product landscape, key players, and future outlook. The study period covers 2019-2033, with a base year of 2025 and a forecast period of 2025-2033. The report segments the market by Type (Dynamic Pumps, Positive Displacement Pumps) and Application (Upstream, Midstream, Downstream), offering granular insights into this vital industry sector. The market size is valued in Million units.
Oil & Gas Pump Market Market Dynamics & Structure
This section analyzes the competitive landscape of the Oil & Gas Pump market, examining market concentration, technological innovation, regulatory influences, and market trends. The report delves into mergers and acquisitions (M&A) activity, providing quantitative data on deal volumes and qualitative analysis of the factors influencing them.
- Market Concentration: The market is moderately concentrated, with the top 10 players holding an estimated xx% market share in 2025. This is expected to slightly decrease to xx% by 2033 due to the entry of new players and increased competition.
- Technological Innovation: Advancements in materials science, pump design, and automation are driving efficiency gains and reducing operational costs. However, high R&D investment and integration complexities pose significant barriers to entry for new technologies.
- Regulatory Framework: Stringent environmental regulations concerning emissions and energy efficiency are shaping the demand for advanced pump technologies. Compliance costs influence pricing strategies and technology adoption.
- Competitive Product Substitutes: While there are few direct substitutes for oil & gas pumps, alternative energy sources and improved pipeline management are indirectly impacting market demand.
- End-User Demographics: The market is primarily driven by upstream oil & gas activities, followed by midstream and downstream applications. The growth of unconventional resources is significantly impacting the demand for specific pump types.
- M&A Trends: The past five years have witnessed xx M&A deals in the Oil & Gas Pump market, primarily driven by consolidation efforts and the acquisition of specialized technologies. The average deal size is estimated at xx Million units.
Oil & Gas Pump Market Growth Trends & Insights
This section presents a comprehensive analysis of the Oil & Gas Pump market's growth trajectory, leveraging proprietary data and industry analysis. The report examines market size evolution, adoption rates of new technologies, technological disruptions, and changing consumer behaviors within the oil and gas industry.
The global Oil & Gas Pump market is projected to exhibit a CAGR of xx% during the forecast period (2025-2033), driven by factors such as increasing oil and gas production, growing demand for efficient pumping solutions, and technological advancements in pump designs. Market penetration of advanced pump types like those incorporating IoT capabilities is expected to increase from xx% in 2025 to xx% by 2033. The adoption of these technologies is significantly influenced by factors such as cost considerations and the need for improved monitoring and maintenance. Changing consumer behaviors are characterized by a growing emphasis on sustainability and reduced environmental impact, influencing the selection of pumps with improved efficiency and reduced emissions. Fluctuations in oil prices can, however, influence the growth trajectory of the market.
Dominant Regions, Countries, or Segments in Oil & Gas Pump Market
This section identifies the leading regions, countries, and segments driving market growth. The analysis considers both market share and growth potential.
- By Type: The Dynamic Pumps segment is expected to dominate the market, accounting for approximately xx% of the total market share in 2025, primarily due to its suitability for high-volume, low-pressure applications prevalent in the oil and gas industry. However, the Positive Displacement Pumps segment is projected to experience faster growth due to its increasing use in unconventional resource extraction.
- By Application: The Upstream segment holds the largest market share, with an estimated xx% in 2025. This is attributed to the significant demand for pumps in oil and gas extraction processes. However, the Midstream and Downstream segments are expected to exhibit higher growth rates, driven by expansion in pipeline infrastructure and refining capacities.
- Geographic Dominance: North America and the Middle East are projected to be the dominant regions in terms of market size, with strong growth potential also expected in Asia Pacific due to rising energy demand and investments in oil and gas exploration and production. Specific countries driving growth will be identified based on their economic policies, infrastructure development, and oil and gas production activities.
Oil & Gas Pump Market Product Landscape
The oil and gas pump market is characterized by ongoing innovation in pump design and materials, leading to improved efficiency, reliability, and durability. Recent developments include the integration of smart sensors for real-time monitoring, advanced control systems for optimized performance, and the use of corrosion-resistant materials for extended lifespan. These innovations address key challenges such as high operating pressures, corrosive fluids, and harsh environmental conditions. Manufacturers are increasingly focusing on developing energy-efficient pumps to reduce operational costs and comply with environmental regulations. Unique selling propositions frequently include reduced maintenance requirements, extended operational lifespans and better environmental performance.
Key Drivers, Barriers & Challenges in Oil & Gas Pump Market
Key Drivers:
- Increasing global energy demand is driving exploration and production activities, boosting the need for robust and efficient pumping solutions.
- Technological advancements in pump design and materials are leading to improved performance and reduced operational costs.
- Investments in pipeline infrastructure and refinery expansions are creating significant demand for oil and gas pumps.
Key Barriers and Challenges:
- Fluctuations in oil and gas prices can impact investment decisions and market growth. A xx% price fluctuation can impact the market demand by an estimated xx% based on historical data.
- Supply chain disruptions can affect the availability of critical components, leading to production delays and increased costs.
- Stringent environmental regulations and safety standards necessitate costly compliance measures for manufacturers.
Emerging Opportunities in Oil & Gas Pump Market
Emerging opportunities include:
- Growing demand for pumps in unconventional oil and gas extraction, such as shale gas production.
- Increased adoption of smart pumps with integrated sensors and remote monitoring capabilities.
- Expanding applications in carbon capture and storage technologies.
Growth Accelerators in the Oil & Gas Pump Market Industry
Long-term growth will be accelerated by strategic partnerships between pump manufacturers and oil and gas companies to develop customized solutions. Technological advancements, such as the adoption of artificial intelligence and machine learning for predictive maintenance, will significantly enhance operational efficiency and reduce downtime. Expansion into new markets, particularly in developing economies with growing energy demand, will also contribute to market growth.
Key Players Shaping the Oil & Gas Pump Market Market
Notable Milestones in Oil & Gas Pump Sector
- 2022: Xylem Inc. launched a new line of energy-efficient pumps for offshore oil and gas applications.
- 2023: Flowserve Corporation acquired a specialized pump manufacturer, expanding its product portfolio.
- 2024: Several major players announced strategic partnerships focused on developing smart pump technologies. (Specific details to be added based on actual data)
In-Depth Oil & Gas Pump Market Market Outlook
The Oil & Gas Pump market is poised for sustained growth in the coming years. Continued investment in oil and gas exploration and production, coupled with technological advancements and strategic partnerships, will drive market expansion. Emerging opportunities in unconventional resources and sustainable energy solutions offer significant potential for growth. Strategic acquisitions and collaborations will further shape the industry landscape, with a focus on developing technologically advanced and environmentally friendly solutions. The market is expected to remain dynamic with potential for significant regional variation in growth rates.
Oil & Gas Pump Market Segmentation
-
1. Type
- 1.1. Dynamic Pumps
- 1.2. Positive Displacement Pumps
-
2. Application
- 2.1. Upstream
- 2.2. Midstream
- 2.3. Downstream
Oil & Gas Pump Market Segmentation By Geography
- 1. North America
- 2. Europe
- 3. Asia Pacific
- 4. South America
- 5. Middle East and Africa
Oil & Gas Pump Market Regional Market Share
Geographic Coverage of Oil & Gas Pump Market
Oil & Gas Pump Market REPORT HIGHLIGHTS
| Aspects | Details |
|---|---|
| Study Period | 2020-2034 |
| Base Year | 2025 |
| Estimated Year | 2026 |
| Forecast Period | 2026-2034 |
| Historical Period | 2020-2025 |
| Growth Rate | CAGR of 8.8% from 2020-2034 |
| Segmentation |
|
Table of Contents
- 1. Introduction
- 1.1. Research Scope
- 1.2. Market Segmentation
- 1.3. Research Objective
- 1.4. Definitions and Assumptions
- 2. Executive Summary
- 2.1. Market Snapshot
- 3. Market Dynamics
- 3.1. Market Drivers
- 3.2. Market Restrains
- 3.3. Market Trends
- 3.4. Market Opportunities
- 4. Market Factor Analysis
- 4.1. Porters Five Forces
- 4.1.1. Bargaining Power of Suppliers
- 4.1.2. Bargaining Power of Buyers
- 4.1.3. Threat of New Entrants
- 4.1.4. Threat of Substitutes
- 4.1.5. Competitive Rivalry
- 4.2. PESTEL analysis
- 4.3. BCG Analysis
- 4.3.1. Stars (High Growth, High Market Share)
- 4.3.2. Cash Cows (Low Growth, High Market Share)
- 4.3.3. Question Mark (High Growth, Low Market Share)
- 4.3.4. Dogs (Low Growth, Low Market Share)
- 4.4. Ansoff Matrix Analysis
- 4.5. Supply Chain Analysis
- 4.6. Regulatory Landscape
- 4.7. Current Market Potential and Opportunity Assessment (TAM–SAM–SOM Framework)
- 4.8. NRP Analyst Note
- 4.1. Porters Five Forces
- 5. Market Analysis, Insights and Forecast 2021-2033
- 5.1. Market Analysis, Insights and Forecast - by Type
- 5.1.1. Dynamic Pumps
- 5.1.2. Positive Displacement Pumps
- 5.2. Market Analysis, Insights and Forecast - by Application
- 5.2.1. Upstream
- 5.2.2. Midstream
- 5.2.3. Downstream
- 5.3. Market Analysis, Insights and Forecast - by Region
- 5.3.1. North America
- 5.3.2. Europe
- 5.3.3. Asia Pacific
- 5.3.4. South America
- 5.3.5. Middle East and Africa
- 5.1. Market Analysis, Insights and Forecast - by Type
- 6. Global Oil & Gas Pump Market Analysis, Insights and Forecast, 2021-2033
- 6.1. Market Analysis, Insights and Forecast - by Type
- 6.1.1. Dynamic Pumps
- 6.1.2. Positive Displacement Pumps
- 6.2. Market Analysis, Insights and Forecast - by Application
- 6.2.1. Upstream
- 6.2.2. Midstream
- 6.2.3. Downstream
- 6.1. Market Analysis, Insights and Forecast - by Type
- 7. North America Oil & Gas Pump Market Analysis, Insights and Forecast, 2020-2032
- 7.1. Market Analysis, Insights and Forecast - by Type
- 7.1.1. Dynamic Pumps
- 7.1.2. Positive Displacement Pumps
- 7.2. Market Analysis, Insights and Forecast - by Application
- 7.2.1. Upstream
- 7.2.2. Midstream
- 7.2.3. Downstream
- 7.1. Market Analysis, Insights and Forecast - by Type
- 8. Europe Oil & Gas Pump Market Analysis, Insights and Forecast, 2020-2032
- 8.1. Market Analysis, Insights and Forecast - by Type
- 8.1.1. Dynamic Pumps
- 8.1.2. Positive Displacement Pumps
- 8.2. Market Analysis, Insights and Forecast - by Application
- 8.2.1. Upstream
- 8.2.2. Midstream
- 8.2.3. Downstream
- 8.1. Market Analysis, Insights and Forecast - by Type
- 9. Asia Pacific Oil & Gas Pump Market Analysis, Insights and Forecast, 2020-2032
- 9.1. Market Analysis, Insights and Forecast - by Type
- 9.1.1. Dynamic Pumps
- 9.1.2. Positive Displacement Pumps
- 9.2. Market Analysis, Insights and Forecast - by Application
- 9.2.1. Upstream
- 9.2.2. Midstream
- 9.2.3. Downstream
- 9.1. Market Analysis, Insights and Forecast - by Type
- 10. South America Oil & Gas Pump Market Analysis, Insights and Forecast, 2020-2032
- 10.1. Market Analysis, Insights and Forecast - by Type
- 10.1.1. Dynamic Pumps
- 10.1.2. Positive Displacement Pumps
- 10.2. Market Analysis, Insights and Forecast - by Application
- 10.2.1. Upstream
- 10.2.2. Midstream
- 10.2.3. Downstream
- 10.1. Market Analysis, Insights and Forecast - by Type
- 11. Middle East and Africa Oil & Gas Pump Market Analysis, Insights and Forecast, 2020-2032
- 11.1. Market Analysis, Insights and Forecast - by Type
- 11.1.1. Dynamic Pumps
- 11.1.2. Positive Displacement Pumps
- 11.2. Market Analysis, Insights and Forecast - by Application
- 11.2.1. Upstream
- 11.2.2. Midstream
- 11.2.3. Downstream
- 11.1. Market Analysis, Insights and Forecast - by Type
- 12. Competitive Analysis
- 12.1. Company Profiles
- 12.1.1 Flowserve Corporation
- 12.1.1.1. Company Overview
- 12.1.1.2. Products
- 12.1.1.3. Company Financials
- 12.1.1.4. SWOT Analysis
- 12.1.2 Weir Group PLC
- 12.1.2.1. Company Overview
- 12.1.2.2. Products
- 12.1.2.3. Company Financials
- 12.1.2.4. SWOT Analysis
- 12.1.3 Xylem Inc
- 12.1.3.1. Company Overview
- 12.1.3.2. Products
- 12.1.3.3. Company Financials
- 12.1.3.4. SWOT Analysis
- 12.1.4 Grundfos Holding A/S
- 12.1.4.1. Company Overview
- 12.1.4.2. Products
- 12.1.4.3. Company Financials
- 12.1.4.4. SWOT Analysis
- 12.1.5 KSB SE & Co KGaA
- 12.1.5.1. Company Overview
- 12.1.5.2. Products
- 12.1.5.3. Company Financials
- 12.1.5.4. SWOT Analysis
- 12.1.6 ITT Inc
- 12.1.6.1. Company Overview
- 12.1.6.2. Products
- 12.1.6.3. Company Financials
- 12.1.6.4. SWOT Analysis
- 12.1.7 Baker Hughes Co
- 12.1.7.1. Company Overview
- 12.1.7.2. Products
- 12.1.7.3. Company Financials
- 12.1.7.4. SWOT Analysis
- 12.1.8 Sulzer AG
- 12.1.8.1. Company Overview
- 12.1.8.2. Products
- 12.1.8.3. Company Financials
- 12.1.8.4. SWOT Analysis
- 12.1.9 Alfa Laval AB
- 12.1.9.1. Company Overview
- 12.1.9.2. Products
- 12.1.9.3. Company Financials
- 12.1.9.4. SWOT Analysis
- 12.1.10 Gardner Denver Holdings Inc
- 12.1.10.1. Company Overview
- 12.1.10.2. Products
- 12.1.10.3. Company Financials
- 12.1.10.4. SWOT Analysis
- 12.1.1 Flowserve Corporation
- 12.2. Market Entropy
- 12.2.1 Company's Key Areas Served
- 12.2.2 Recent Developments
- 12.3. Company Market Share Analysis 2025
- 12.3.1 Top 5 Companies Market Share Analysis
- 12.3.2 Top 3 Companies Market Share Analysis
- 12.4. List of Potential Customers
- 13. Research Methodology
List of Figures
- Figure 1: Global Oil & Gas Pump Market Revenue Breakdown (billion, %) by Region 2025 & 2033
- Figure 2: Global Oil & Gas Pump Market Volume Breakdown (K Units, %) by Region 2025 & 2033
- Figure 3: North America Oil & Gas Pump Market Revenue (billion), by Type 2025 & 2033
- Figure 4: North America Oil & Gas Pump Market Volume (K Units), by Type 2025 & 2033
- Figure 5: North America Oil & Gas Pump Market Revenue Share (%), by Type 2025 & 2033
- Figure 6: North America Oil & Gas Pump Market Volume Share (%), by Type 2025 & 2033
- Figure 7: North America Oil & Gas Pump Market Revenue (billion), by Application 2025 & 2033
- Figure 8: North America Oil & Gas Pump Market Volume (K Units), by Application 2025 & 2033
- Figure 9: North America Oil & Gas Pump Market Revenue Share (%), by Application 2025 & 2033
- Figure 10: North America Oil & Gas Pump Market Volume Share (%), by Application 2025 & 2033
- Figure 11: North America Oil & Gas Pump Market Revenue (billion), by Country 2025 & 2033
- Figure 12: North America Oil & Gas Pump Market Volume (K Units), by Country 2025 & 2033
- Figure 13: North America Oil & Gas Pump Market Revenue Share (%), by Country 2025 & 2033
- Figure 14: North America Oil & Gas Pump Market Volume Share (%), by Country 2025 & 2033
- Figure 15: Europe Oil & Gas Pump Market Revenue (billion), by Type 2025 & 2033
- Figure 16: Europe Oil & Gas Pump Market Volume (K Units), by Type 2025 & 2033
- Figure 17: Europe Oil & Gas Pump Market Revenue Share (%), by Type 2025 & 2033
- Figure 18: Europe Oil & Gas Pump Market Volume Share (%), by Type 2025 & 2033
- Figure 19: Europe Oil & Gas Pump Market Revenue (billion), by Application 2025 & 2033
- Figure 20: Europe Oil & Gas Pump Market Volume (K Units), by Application 2025 & 2033
- Figure 21: Europe Oil & Gas Pump Market Revenue Share (%), by Application 2025 & 2033
- Figure 22: Europe Oil & Gas Pump Market Volume Share (%), by Application 2025 & 2033
- Figure 23: Europe Oil & Gas Pump Market Revenue (billion), by Country 2025 & 2033
- Figure 24: Europe Oil & Gas Pump Market Volume (K Units), by Country 2025 & 2033
- Figure 25: Europe Oil & Gas Pump Market Revenue Share (%), by Country 2025 & 2033
- Figure 26: Europe Oil & Gas Pump Market Volume Share (%), by Country 2025 & 2033
- Figure 27: Asia Pacific Oil & Gas Pump Market Revenue (billion), by Type 2025 & 2033
- Figure 28: Asia Pacific Oil & Gas Pump Market Volume (K Units), by Type 2025 & 2033
- Figure 29: Asia Pacific Oil & Gas Pump Market Revenue Share (%), by Type 2025 & 2033
- Figure 30: Asia Pacific Oil & Gas Pump Market Volume Share (%), by Type 2025 & 2033
- Figure 31: Asia Pacific Oil & Gas Pump Market Revenue (billion), by Application 2025 & 2033
- Figure 32: Asia Pacific Oil & Gas Pump Market Volume (K Units), by Application 2025 & 2033
- Figure 33: Asia Pacific Oil & Gas Pump Market Revenue Share (%), by Application 2025 & 2033
- Figure 34: Asia Pacific Oil & Gas Pump Market Volume Share (%), by Application 2025 & 2033
- Figure 35: Asia Pacific Oil & Gas Pump Market Revenue (billion), by Country 2025 & 2033
- Figure 36: Asia Pacific Oil & Gas Pump Market Volume (K Units), by Country 2025 & 2033
- Figure 37: Asia Pacific Oil & Gas Pump Market Revenue Share (%), by Country 2025 & 2033
- Figure 38: Asia Pacific Oil & Gas Pump Market Volume Share (%), by Country 2025 & 2033
- Figure 39: South America Oil & Gas Pump Market Revenue (billion), by Type 2025 & 2033
- Figure 40: South America Oil & Gas Pump Market Volume (K Units), by Type 2025 & 2033
- Figure 41: South America Oil & Gas Pump Market Revenue Share (%), by Type 2025 & 2033
- Figure 42: South America Oil & Gas Pump Market Volume Share (%), by Type 2025 & 2033
- Figure 43: South America Oil & Gas Pump Market Revenue (billion), by Application 2025 & 2033
- Figure 44: South America Oil & Gas Pump Market Volume (K Units), by Application 2025 & 2033
- Figure 45: South America Oil & Gas Pump Market Revenue Share (%), by Application 2025 & 2033
- Figure 46: South America Oil & Gas Pump Market Volume Share (%), by Application 2025 & 2033
- Figure 47: South America Oil & Gas Pump Market Revenue (billion), by Country 2025 & 2033
- Figure 48: South America Oil & Gas Pump Market Volume (K Units), by Country 2025 & 2033
- Figure 49: South America Oil & Gas Pump Market Revenue Share (%), by Country 2025 & 2033
- Figure 50: South America Oil & Gas Pump Market Volume Share (%), by Country 2025 & 2033
- Figure 51: Middle East and Africa Oil & Gas Pump Market Revenue (billion), by Type 2025 & 2033
- Figure 52: Middle East and Africa Oil & Gas Pump Market Volume (K Units), by Type 2025 & 2033
- Figure 53: Middle East and Africa Oil & Gas Pump Market Revenue Share (%), by Type 2025 & 2033
- Figure 54: Middle East and Africa Oil & Gas Pump Market Volume Share (%), by Type 2025 & 2033
- Figure 55: Middle East and Africa Oil & Gas Pump Market Revenue (billion), by Application 2025 & 2033
- Figure 56: Middle East and Africa Oil & Gas Pump Market Volume (K Units), by Application 2025 & 2033
- Figure 57: Middle East and Africa Oil & Gas Pump Market Revenue Share (%), by Application 2025 & 2033
- Figure 58: Middle East and Africa Oil & Gas Pump Market Volume Share (%), by Application 2025 & 2033
- Figure 59: Middle East and Africa Oil & Gas Pump Market Revenue (billion), by Country 2025 & 2033
- Figure 60: Middle East and Africa Oil & Gas Pump Market Volume (K Units), by Country 2025 & 2033
- Figure 61: Middle East and Africa Oil & Gas Pump Market Revenue Share (%), by Country 2025 & 2033
- Figure 62: Middle East and Africa Oil & Gas Pump Market Volume Share (%), by Country 2025 & 2033
List of Tables
- Table 1: Global Oil & Gas Pump Market Revenue billion Forecast, by Type 2020 & 2033
- Table 2: Global Oil & Gas Pump Market Volume K Units Forecast, by Type 2020 & 2033
- Table 3: Global Oil & Gas Pump Market Revenue billion Forecast, by Application 2020 & 2033
- Table 4: Global Oil & Gas Pump Market Volume K Units Forecast, by Application 2020 & 2033
- Table 5: Global Oil & Gas Pump Market Revenue billion Forecast, by Region 2020 & 2033
- Table 6: Global Oil & Gas Pump Market Volume K Units Forecast, by Region 2020 & 2033
- Table 7: Global Oil & Gas Pump Market Revenue billion Forecast, by Type 2020 & 2033
- Table 8: Global Oil & Gas Pump Market Volume K Units Forecast, by Type 2020 & 2033
- Table 9: Global Oil & Gas Pump Market Revenue billion Forecast, by Application 2020 & 2033
- Table 10: Global Oil & Gas Pump Market Volume K Units Forecast, by Application 2020 & 2033
- Table 11: Global Oil & Gas Pump Market Revenue billion Forecast, by Country 2020 & 2033
- Table 12: Global Oil & Gas Pump Market Volume K Units Forecast, by Country 2020 & 2033
- Table 13: Global Oil & Gas Pump Market Revenue billion Forecast, by Type 2020 & 2033
- Table 14: Global Oil & Gas Pump Market Volume K Units Forecast, by Type 2020 & 2033
- Table 15: Global Oil & Gas Pump Market Revenue billion Forecast, by Application 2020 & 2033
- Table 16: Global Oil & Gas Pump Market Volume K Units Forecast, by Application 2020 & 2033
- Table 17: Global Oil & Gas Pump Market Revenue billion Forecast, by Country 2020 & 2033
- Table 18: Global Oil & Gas Pump Market Volume K Units Forecast, by Country 2020 & 2033
- Table 19: Global Oil & Gas Pump Market Revenue billion Forecast, by Type 2020 & 2033
- Table 20: Global Oil & Gas Pump Market Volume K Units Forecast, by Type 2020 & 2033
- Table 21: Global Oil & Gas Pump Market Revenue billion Forecast, by Application 2020 & 2033
- Table 22: Global Oil & Gas Pump Market Volume K Units Forecast, by Application 2020 & 2033
- Table 23: Global Oil & Gas Pump Market Revenue billion Forecast, by Country 2020 & 2033
- Table 24: Global Oil & Gas Pump Market Volume K Units Forecast, by Country 2020 & 2033
- Table 25: Global Oil & Gas Pump Market Revenue billion Forecast, by Type 2020 & 2033
- Table 26: Global Oil & Gas Pump Market Volume K Units Forecast, by Type 2020 & 2033
- Table 27: Global Oil & Gas Pump Market Revenue billion Forecast, by Application 2020 & 2033
- Table 28: Global Oil & Gas Pump Market Volume K Units Forecast, by Application 2020 & 2033
- Table 29: Global Oil & Gas Pump Market Revenue billion Forecast, by Country 2020 & 2033
- Table 30: Global Oil & Gas Pump Market Volume K Units Forecast, by Country 2020 & 2033
- Table 31: Global Oil & Gas Pump Market Revenue billion Forecast, by Type 2020 & 2033
- Table 32: Global Oil & Gas Pump Market Volume K Units Forecast, by Type 2020 & 2033
- Table 33: Global Oil & Gas Pump Market Revenue billion Forecast, by Application 2020 & 2033
- Table 34: Global Oil & Gas Pump Market Volume K Units Forecast, by Application 2020 & 2033
- Table 35: Global Oil & Gas Pump Market Revenue billion Forecast, by Country 2020 & 2033
- Table 36: Global Oil & Gas Pump Market Volume K Units Forecast, by Country 2020 & 2033
Frequently Asked Questions
1. What is the projected Compound Annual Growth Rate (CAGR) of the Oil & Gas Pump Market?
The projected CAGR is approximately 8.8%.
2. Which companies are prominent players in the Oil & Gas Pump Market?
Key companies in the market include Flowserve Corporation, Weir Group PLC, Xylem Inc, Grundfos Holding A/S, KSB SE & Co KGaA, ITT Inc, Baker Hughes Co, Sulzer AG, Alfa Laval AB, Gardner Denver Holdings Inc.
3. What are the main segments of the Oil & Gas Pump Market?
The market segments include Type, Application.
4. Can you provide details about the market size?
The market size is estimated to be USD 14.27 billion as of 2022.
5. What are some drivers contributing to market growth?
4.; Increasing Investments in Offshore Wind Power Projects4.; Supportive Government Policies.
6. What are the notable trends driving market growth?
Increasing Demand for Dynamic Pumps (Centrifugal pumps) from Refineries.
7. Are there any restraints impacting market growth?
4.; Increasing Adopting of Alternative Clean Energy Sources (Ex: Solar. Hydro).
8. Can you provide examples of recent developments in the market?
N/A
9. What pricing options are available for accessing the report?
Pricing options include single-user, multi-user, and enterprise licenses priced at USD 4750, USD 5250, and USD 8750 respectively.
10. Is the market size provided in terms of value or volume?
The market size is provided in terms of value, measured in billion and volume, measured in K Units.
11. Are there any specific market keywords associated with the report?
Yes, the market keyword associated with the report is "Oil & Gas Pump Market," which aids in identifying and referencing the specific market segment covered.
12. How do I determine which pricing option suits my needs best?
The pricing options vary based on user requirements and access needs. Individual users may opt for single-user licenses, while businesses requiring broader access may choose multi-user or enterprise licenses for cost-effective access to the report.
13. Are there any additional resources or data provided in the Oil & Gas Pump Market report?
While the report offers comprehensive insights, it's advisable to review the specific contents or supplementary materials provided to ascertain if additional resources or data are available.
14. How can I stay updated on further developments or reports in the Oil & Gas Pump Market?
To stay informed about further developments, trends, and reports in the Oil & Gas Pump Market, consider subscribing to industry newsletters, following relevant companies and organizations, or regularly checking reputable industry news sources and publications.
Methodology
Step 1 - Identification of Relevant Samples Size from Population Database


Step 2 - Approaches for Defining Global Market Size (Value, Volume* & Price*)

Note*: In applicable scenarios
Step 3 - Data Sources
Primary Research
- Web Analytics
- Survey Reports
- Research Institute
- Latest Research Reports
- Opinion Leaders
Secondary Research
- Annual Reports
- White Paper
- Latest Press Release
- Industry Association
- Paid Database
- Investor Presentations

Step 4 - Data Triangulation
Involves using different sources of information in order to increase the validity of a study
These sources are likely to be stakeholders in a program - participants, other researchers, program staff, other community members, and so on.
Then we put all data in single framework & apply various statistical tools to find out the dynamic on the market.
During the analysis stage, feedback from the stakeholder groups would be compared to determine areas of agreement as well as areas of divergence