

Key Insights
The open-source infrastructure market is experiencing robust growth, driven by increasing adoption of cloud-native technologies, the need for greater agility and cost efficiency, and a rising preference for flexible and customizable solutions. The market, estimated at $50 billion in 2025, is projected to expand significantly over the next decade, fueled by continuous innovation in areas like containerization (Docker, Kubernetes), data management (Hadoop, Spark), and serverless computing. Key players such as Amazon Web Services, Microsoft, Google, and Red Hat are actively contributing to and benefiting from this ecosystem, either through direct open-source contributions or by offering commercial support and services built around open-source technologies. The market's segmentation includes infrastructure-as-a-service (IaaS), platform-as-a-service (PaaS), and software-as-a-service (SaaS), each showing strong growth, albeit at varying rates. The competitive landscape is dynamic, with both established tech giants and agile startups vying for market share. The growing demand for skilled open-source professionals and the complexities associated with managing diverse open-source components represent some of the key challenges hindering widespread adoption.
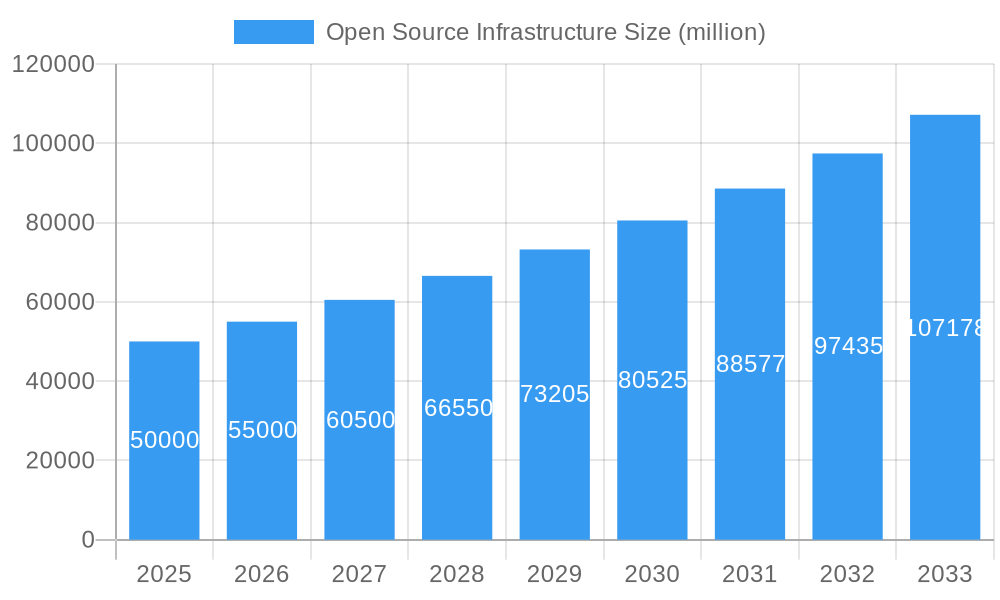
Open Source Infrastructure Market Size (In Billion)
Despite these challenges, the long-term outlook for the open-source infrastructure market remains exceptionally positive. The inherent flexibility and cost-effectiveness of open-source solutions continue to attract businesses of all sizes, from startups to enterprises. Furthermore, the strong community support and collaborative nature of open-source development foster continuous improvement and innovation, further solidifying its position as a crucial component of modern IT infrastructure. The convergence of open-source technologies with cloud computing and artificial intelligence is expected to accelerate growth even further, creating new opportunities for both vendors and users alike. Future market trends will likely center on increased security features, improved interoperability, and the seamless integration of AI/ML capabilities within open-source platforms.
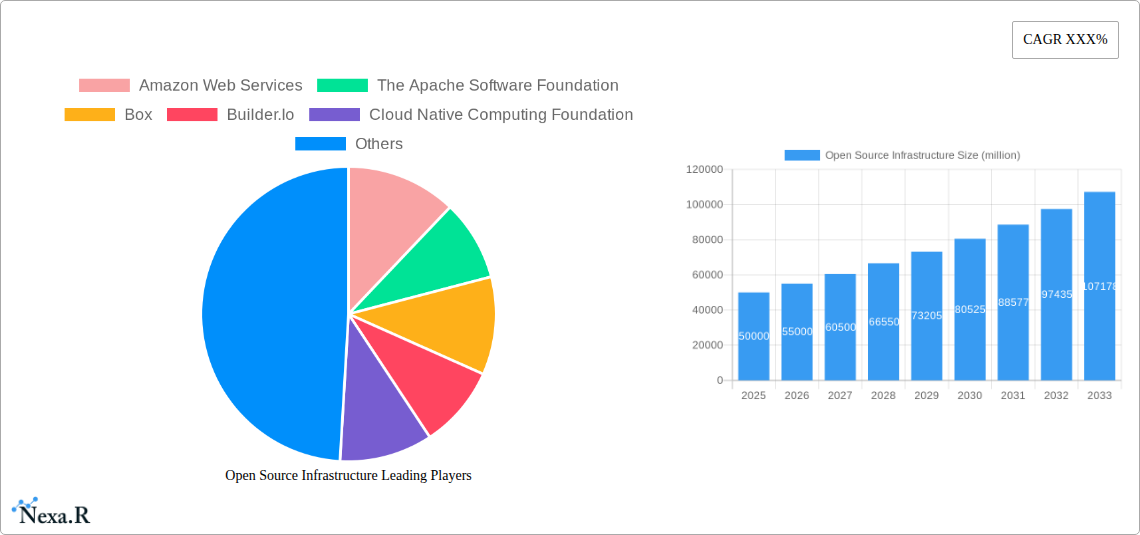
Open Source Infrastructure Company Market Share
Open Source Infrastructure Market Report: 2019-2033
This comprehensive report provides a detailed analysis of the Open Source Infrastructure market, encompassing market dynamics, growth trends, regional dominance, product landscape, key players, and future outlook. The study period spans 2019-2033, with 2025 serving as the base and estimated year. The forecast period is 2025-2033, and the historical period covers 2019-2024. This report is crucial for businesses, investors, and researchers seeking to understand and capitalize on opportunities within this rapidly evolving sector. The total market size in 2025 is estimated at $XX billion.
Open Source Infrastructure Market Dynamics & Structure
The Open Source Infrastructure market exhibits a dynamic landscape characterized by intense competition, rapid technological advancements, and evolving regulatory frameworks. Market concentration is moderate, with a few major players holding significant shares, while numerous smaller players contribute to innovation. The market is driven by the increasing adoption of cloud computing, DevOps practices, and containerization technologies. Mergers and acquisitions (M&A) activity has been significant, with larger players acquiring smaller companies to expand their product portfolios and capabilities. The historical period (2019-2024) witnessed approximately XX M&A deals, with an average deal value of $XX million. Innovation barriers include the complexity of integrating open-source components, ensuring security, and addressing the lack of centralized support.
- Market Concentration: Moderately concentrated, with top 5 players holding approximately XX% market share in 2025.
- Technological Innovation Drivers: Cloud computing, containerization (Docker, Kubernetes), AI/ML integration, serverless computing.
- Regulatory Frameworks: Varying regulations across different jurisdictions impact data privacy, security, and compliance.
- Competitive Product Substitutes: Proprietary infrastructure solutions from major cloud providers.
- End-User Demographics: Primarily enterprises, SMBs, and government organizations across various industries.
- M&A Trends: Consolidation expected to continue, driven by the desire for expanded capabilities and market share.
Open Source Infrastructure Growth Trends & Insights
The Open Source Infrastructure market has experienced substantial growth over the past few years, driven by factors such as the increasing adoption of cloud-native applications, the rise of DevOps practices, and the growing demand for cost-effective and flexible IT solutions. The market size grew from $XX billion in 2019 to an estimated $XX billion in 2025, registering a CAGR of XX% during the historical period. This growth is expected to continue, with the market projected to reach $XX billion by 2033, driven by factors such as increased adoption of cloud-based services, growth in big data analytics, and increasing demand for agile and scalable IT infrastructure. Technological disruptions, such as the rise of serverless computing and edge computing, are significantly shaping the market landscape. Consumer behavior shifts towards cloud-based services and on-demand solutions continue to bolster market growth.
Dominant Regions, Countries, or Segments in Open Source Infrastructure
North America currently dominates the Open Source Infrastructure market, holding approximately XX% of the global market share in 2025, followed by Europe and Asia-Pacific. This dominance is driven by factors such as higher adoption rates of cloud computing, strong technological infrastructure, and the presence of several major players. The US specifically benefits from robust venture capital funding, supporting innovation and the expansion of open-source projects. However, the Asia-Pacific region is experiencing the fastest growth, fueled by rapid digital transformation across various sectors, rising internet penetration and supportive government initiatives.
- Key Drivers in North America: Strong technological infrastructure, high adoption rates of cloud computing, presence of major players.
- Key Drivers in Asia-Pacific: Rapid digital transformation, rising internet penetration, supportive government initiatives.
- Key Drivers in Europe: Growing adoption of cloud-native technologies, increasing focus on data privacy regulations.
Open Source Infrastructure Product Landscape
The Open Source Infrastructure market offers a diverse range of products and solutions, including operating systems (e.g., Linux distributions), databases (e.g., MySQL, PostgreSQL), virtualization technologies (e.g., VMware vSphere), container orchestration platforms (e.g., Kubernetes), and cloud platforms (e.g., OpenStack). These solutions are characterized by their flexibility, scalability, and cost-effectiveness, enabling organizations to build robust and adaptable IT infrastructures. Recent innovations include advancements in serverless computing, edge computing, and AI/ML integration, enhancing the capabilities and functionalities of open-source infrastructure platforms.
Key Drivers, Barriers & Challenges in Open Source Infrastructure
Key Drivers:
- Increasing adoption of cloud-native applications.
- Growing demand for cost-effective and flexible IT solutions.
- Rise of DevOps and Agile methodologies.
- Increased focus on security and compliance.
Challenges & Restraints:
- Security concerns and vulnerabilities in open-source software.
- Lack of centralized support and maintenance for certain open-source projects.
- Integration complexities with existing IT infrastructures.
- Difficulty in attracting and retaining skilled open-source developers. This leads to approximately XX million dollars in lost productivity annually.
Emerging Opportunities in Open Source Infrastructure
Emerging opportunities include the growing adoption of serverless computing, edge computing, and AI/ML integration within open-source infrastructure. Untapped markets exist in developing economies with rapidly growing digital adoption rates. Furthermore, innovative applications in areas such as IoT and blockchain are creating significant demand for flexible and scalable open-source solutions.
Growth Accelerators in the Open Source Infrastructure Industry
The long-term growth of the Open Source Infrastructure market will be propelled by technological breakthroughs, strategic partnerships between open-source communities and commercial vendors, and market expansion into emerging economies. The continued development of robust open-source platforms and related services will be crucial for sustained growth.
Key Players Shaping the Open Source Infrastructure Market
Notable Milestones in Open Source Infrastructure Sector
- 2020: Kubernetes surpasses Docker as the most popular container orchestration platform.
- 2021: Significant increase in investments in open-source security initiatives.
- 2022: Launch of several serverless computing platforms based on open-source technologies.
- 2023: Increased adoption of AI/ML within open-source infrastructure.
- 2024: Major cloud providers further integrate open-source technologies into their offerings.
In-Depth Open Source Infrastructure Market Outlook
The Open Source Infrastructure market is poised for continued robust growth, driven by ongoing technological advancements, increasing enterprise adoption, and expanding market penetration in developing economies. Strategic opportunities exist for companies focusing on security, AI/ML integration, and specialized open-source solutions catering to specific industry needs. The market's long-term potential is substantial, promising significant returns for innovative players and strategic investors alike.
Open Source Infrastructure Segmentation
-
1. Application
- 1.1. Cloud Computation
- 1.2. Edge Computing
- 1.3. Embedded
- 1.4. Others
-
2. Type
- 2.1. Linux
- 2.2. Fedora
- 2.3. Ubuntu
- 2.4. React OS
- 2.5. Solus
- 2.6. Chrome OS
Open Source Infrastructure Segmentation By Geography
-
1. North America
- 1.1. United States
- 1.2. Canada
- 1.3. Mexico
-
2. South America
- 2.1. Brazil
- 2.2. Argentina
- 2.3. Rest of South America
-
3. Europe
- 3.1. United Kingdom
- 3.2. Germany
- 3.3. France
- 3.4. Italy
- 3.5. Spain
- 3.6. Russia
- 3.7. Benelux
- 3.8. Nordics
- 3.9. Rest of Europe
-
4. Middle East & Africa
- 4.1. Turkey
- 4.2. Israel
- 4.3. GCC
- 4.4. North Africa
- 4.5. South Africa
- 4.6. Rest of Middle East & Africa
-
5. Asia Pacific
- 5.1. China
- 5.2. India
- 5.3. Japan
- 5.4. South Korea
- 5.5. ASEAN
- 5.6. Oceania
- 5.7. Rest of Asia Pacific
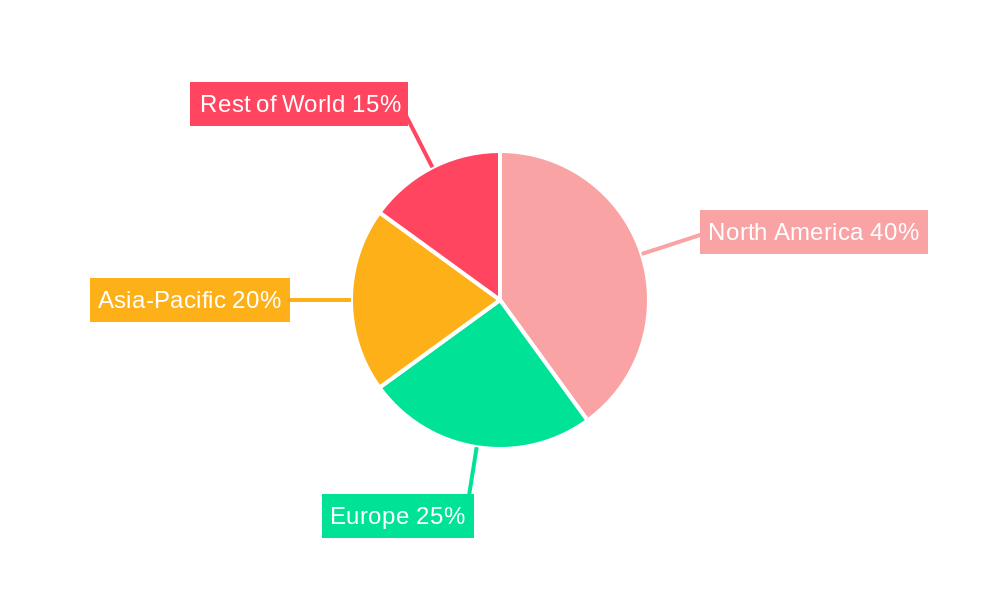
Open Source Infrastructure Regional Market Share
Geographic Coverage of Open Source Infrastructure
Open Source Infrastructure REPORT HIGHLIGHTS
| Aspects | Details |
|---|---|
| Study Period | 2020-2034 |
| Base Year | 2025 |
| Estimated Year | 2026 |
| Forecast Period | 2026-2034 |
| Historical Period | 2020-2025 |
| Growth Rate | CAGR of 19.5% from 2020-2034 |
| Segmentation |
|
Table of Contents
- 1. Introduction
- 1.1. Research Scope
- 1.2. Market Segmentation
- 1.3. Research Methodology
- 1.4. Definitions and Assumptions
- 2. Executive Summary
- 2.1. Introduction
- 3. Market Dynamics
- 3.1. Introduction
- 3.2. Market Drivers
- 3.3. Market Restrains
- 3.4. Market Trends
- 4. Market Factor Analysis
- 4.1. Porters Five Forces
- 4.2. Supply/Value Chain
- 4.3. PESTEL analysis
- 4.4. Market Entropy
- 4.5. Patent/Trademark Analysis
- 5. Global Open Source Infrastructure Analysis, Insights and Forecast, 2020-2032
- 5.1. Market Analysis, Insights and Forecast - by Application
- 5.1.1. Cloud Computation
- 5.1.2. Edge Computing
- 5.1.3. Embedded
- 5.1.4. Others
- 5.2. Market Analysis, Insights and Forecast - by Type
- 5.2.1. Linux
- 5.2.2. Fedora
- 5.2.3. Ubuntu
- 5.2.4. React OS
- 5.2.5. Solus
- 5.2.6. Chrome OS
- 5.3. Market Analysis, Insights and Forecast - by Region
- 5.3.1. North America
- 5.3.2. South America
- 5.3.3. Europe
- 5.3.4. Middle East & Africa
- 5.3.5. Asia Pacific
- 5.1. Market Analysis, Insights and Forecast - by Application
- 6. North America Open Source Infrastructure Analysis, Insights and Forecast, 2020-2032
- 6.1. Market Analysis, Insights and Forecast - by Application
- 6.1.1. Cloud Computation
- 6.1.2. Edge Computing
- 6.1.3. Embedded
- 6.1.4. Others
- 6.2. Market Analysis, Insights and Forecast - by Type
- 6.2.1. Linux
- 6.2.2. Fedora
- 6.2.3. Ubuntu
- 6.2.4. React OS
- 6.2.5. Solus
- 6.2.6. Chrome OS
- 6.1. Market Analysis, Insights and Forecast - by Application
- 7. South America Open Source Infrastructure Analysis, Insights and Forecast, 2020-2032
- 7.1. Market Analysis, Insights and Forecast - by Application
- 7.1.1. Cloud Computation
- 7.1.2. Edge Computing
- 7.1.3. Embedded
- 7.1.4. Others
- 7.2. Market Analysis, Insights and Forecast - by Type
- 7.2.1. Linux
- 7.2.2. Fedora
- 7.2.3. Ubuntu
- 7.2.4. React OS
- 7.2.5. Solus
- 7.2.6. Chrome OS
- 7.1. Market Analysis, Insights and Forecast - by Application
- 8. Europe Open Source Infrastructure Analysis, Insights and Forecast, 2020-2032
- 8.1. Market Analysis, Insights and Forecast - by Application
- 8.1.1. Cloud Computation
- 8.1.2. Edge Computing
- 8.1.3. Embedded
- 8.1.4. Others
- 8.2. Market Analysis, Insights and Forecast - by Type
- 8.2.1. Linux
- 8.2.2. Fedora
- 8.2.3. Ubuntu
- 8.2.4. React OS
- 8.2.5. Solus
- 8.2.6. Chrome OS
- 8.1. Market Analysis, Insights and Forecast - by Application
- 9. Middle East & Africa Open Source Infrastructure Analysis, Insights and Forecast, 2020-2032
- 9.1. Market Analysis, Insights and Forecast - by Application
- 9.1.1. Cloud Computation
- 9.1.2. Edge Computing
- 9.1.3. Embedded
- 9.1.4. Others
- 9.2. Market Analysis, Insights and Forecast - by Type
- 9.2.1. Linux
- 9.2.2. Fedora
- 9.2.3. Ubuntu
- 9.2.4. React OS
- 9.2.5. Solus
- 9.2.6. Chrome OS
- 9.1. Market Analysis, Insights and Forecast - by Application
- 10. Asia Pacific Open Source Infrastructure Analysis, Insights and Forecast, 2020-2032
- 10.1. Market Analysis, Insights and Forecast - by Application
- 10.1.1. Cloud Computation
- 10.1.2. Edge Computing
- 10.1.3. Embedded
- 10.1.4. Others
- 10.2. Market Analysis, Insights and Forecast - by Type
- 10.2.1. Linux
- 10.2.2. Fedora
- 10.2.3. Ubuntu
- 10.2.4. React OS
- 10.2.5. Solus
- 10.2.6. Chrome OS
- 10.1. Market Analysis, Insights and Forecast - by Application
- 11. Competitive Analysis
- 11.1. Global Market Share Analysis 2025
- 11.2. Company Profiles
- 11.2.1 Amazon Web Services
- 11.2.1.1. Overview
- 11.2.1.2. Products
- 11.2.1.3. SWOT Analysis
- 11.2.1.4. Recent Developments
- 11.2.1.5. Financials (Based on Availability)
- 11.2.2 The Apache Software Foundation
- 11.2.2.1. Overview
- 11.2.2.2. Products
- 11.2.2.3. SWOT Analysis
- 11.2.2.4. Recent Developments
- 11.2.2.5. Financials (Based on Availability)
- 11.2.3 Box
- 11.2.3.1. Overview
- 11.2.3.2. Products
- 11.2.3.3. SWOT Analysis
- 11.2.3.4. Recent Developments
- 11.2.3.5. Financials (Based on Availability)
- 11.2.4 Builder.Io
- 11.2.4.1. Overview
- 11.2.4.2. Products
- 11.2.4.3. SWOT Analysis
- 11.2.4.4. Recent Developments
- 11.2.4.5. Financials (Based on Availability)
- 11.2.5 Cloud Native Computing Foundation
- 11.2.5.1. Overview
- 11.2.5.2. Products
- 11.2.5.3. SWOT Analysis
- 11.2.5.4. Recent Developments
- 11.2.5.5. Financials (Based on Availability)
- 11.2.6 Databricks
- 11.2.6.1. Overview
- 11.2.6.2. Products
- 11.2.6.3. SWOT Analysis
- 11.2.6.4. Recent Developments
- 11.2.6.5. Financials (Based on Availability)
- 11.2.7 Docker
- 11.2.7.1. Overview
- 11.2.7.2. Products
- 11.2.7.3. SWOT Analysis
- 11.2.7.4. Recent Developments
- 11.2.7.5. Financials (Based on Availability)
- 11.2.8 Google
- 11.2.8.1. Overview
- 11.2.8.2. Products
- 11.2.8.3. SWOT Analysis
- 11.2.8.4. Recent Developments
- 11.2.8.5. Financials (Based on Availability)
- 11.2.9 H2O.Ai
- 11.2.9.1. Overview
- 11.2.9.2. Products
- 11.2.9.3. SWOT Analysis
- 11.2.9.4. Recent Developments
- 11.2.9.5. Financials (Based on Availability)
- 11.2.10 HashiCorp
- 11.2.10.1. Overview
- 11.2.10.2. Products
- 11.2.10.3. SWOT Analysis
- 11.2.10.4. Recent Developments
- 11.2.10.5. Financials (Based on Availability)
- 11.2.11 IBM
- 11.2.11.1. Overview
- 11.2.11.2. Products
- 11.2.11.3. SWOT Analysis
- 11.2.11.4. Recent Developments
- 11.2.11.5. Financials (Based on Availability)
- 11.2.12 Intel
- 11.2.12.1. Overview
- 11.2.12.2. Products
- 11.2.12.3. SWOT Analysis
- 11.2.12.4. Recent Developments
- 11.2.12.5. Financials (Based on Availability)
- 11.2.13 Microsoft
- 11.2.13.1. Overview
- 11.2.13.2. Products
- 11.2.13.3. SWOT Analysis
- 11.2.13.4. Recent Developments
- 11.2.13.5. Financials (Based on Availability)
- 11.2.14 Meta
- 11.2.14.1. Overview
- 11.2.14.2. Products
- 11.2.14.3. SWOT Analysis
- 11.2.14.4. Recent Developments
- 11.2.14.5. Financials (Based on Availability)
- 11.2.15 Oracle
- 11.2.15.1. Overview
- 11.2.15.2. Products
- 11.2.15.3. SWOT Analysis
- 11.2.15.4. Recent Developments
- 11.2.15.5. Financials (Based on Availability)
- 11.2.16 OpenAI
- 11.2.16.1. Overview
- 11.2.16.2. Products
- 11.2.16.3. SWOT Analysis
- 11.2.16.4. Recent Developments
- 11.2.16.5. Financials (Based on Availability)
- 11.2.17 Red Hat
- 11.2.17.1. Overview
- 11.2.17.2. Products
- 11.2.17.3. SWOT Analysis
- 11.2.17.4. Recent Developments
- 11.2.17.5. Financials (Based on Availability)
- 11.2.18 SAP
- 11.2.18.1. Overview
- 11.2.18.2. Products
- 11.2.18.3. SWOT Analysis
- 11.2.18.4. Recent Developments
- 11.2.18.5. Financials (Based on Availability)
- 11.2.19 Strata IO
- 11.2.19.1. Overview
- 11.2.19.2. Products
- 11.2.19.3. SWOT Analysis
- 11.2.19.4. Recent Developments
- 11.2.19.5. Financials (Based on Availability)
- 11.2.20 VMware
- 11.2.20.1. Overview
- 11.2.20.2. Products
- 11.2.20.3. SWOT Analysis
- 11.2.20.4. Recent Developments
- 11.2.20.5. Financials (Based on Availability)
- 11.2.1 Amazon Web Services
List of Figures
- Figure 1: Global Open Source Infrastructure Revenue Breakdown (undefined, %) by Region 2025 & 2033
- Figure 2: North America Open Source Infrastructure Revenue (undefined), by Application 2025 & 2033
- Figure 3: North America Open Source Infrastructure Revenue Share (%), by Application 2025 & 2033
- Figure 4: North America Open Source Infrastructure Revenue (undefined), by Type 2025 & 2033
- Figure 5: North America Open Source Infrastructure Revenue Share (%), by Type 2025 & 2033
- Figure 6: North America Open Source Infrastructure Revenue (undefined), by Country 2025 & 2033
- Figure 7: North America Open Source Infrastructure Revenue Share (%), by Country 2025 & 2033
- Figure 8: South America Open Source Infrastructure Revenue (undefined), by Application 2025 & 2033
- Figure 9: South America Open Source Infrastructure Revenue Share (%), by Application 2025 & 2033
- Figure 10: South America Open Source Infrastructure Revenue (undefined), by Type 2025 & 2033
- Figure 11: South America Open Source Infrastructure Revenue Share (%), by Type 2025 & 2033
- Figure 12: South America Open Source Infrastructure Revenue (undefined), by Country 2025 & 2033
- Figure 13: South America Open Source Infrastructure Revenue Share (%), by Country 2025 & 2033
- Figure 14: Europe Open Source Infrastructure Revenue (undefined), by Application 2025 & 2033
- Figure 15: Europe Open Source Infrastructure Revenue Share (%), by Application 2025 & 2033
- Figure 16: Europe Open Source Infrastructure Revenue (undefined), by Type 2025 & 2033
- Figure 17: Europe Open Source Infrastructure Revenue Share (%), by Type 2025 & 2033
- Figure 18: Europe Open Source Infrastructure Revenue (undefined), by Country 2025 & 2033
- Figure 19: Europe Open Source Infrastructure Revenue Share (%), by Country 2025 & 2033
- Figure 20: Middle East & Africa Open Source Infrastructure Revenue (undefined), by Application 2025 & 2033
- Figure 21: Middle East & Africa Open Source Infrastructure Revenue Share (%), by Application 2025 & 2033
- Figure 22: Middle East & Africa Open Source Infrastructure Revenue (undefined), by Type 2025 & 2033
- Figure 23: Middle East & Africa Open Source Infrastructure Revenue Share (%), by Type 2025 & 2033
- Figure 24: Middle East & Africa Open Source Infrastructure Revenue (undefined), by Country 2025 & 2033
- Figure 25: Middle East & Africa Open Source Infrastructure Revenue Share (%), by Country 2025 & 2033
- Figure 26: Asia Pacific Open Source Infrastructure Revenue (undefined), by Application 2025 & 2033
- Figure 27: Asia Pacific Open Source Infrastructure Revenue Share (%), by Application 2025 & 2033
- Figure 28: Asia Pacific Open Source Infrastructure Revenue (undefined), by Type 2025 & 2033
- Figure 29: Asia Pacific Open Source Infrastructure Revenue Share (%), by Type 2025 & 2033
- Figure 30: Asia Pacific Open Source Infrastructure Revenue (undefined), by Country 2025 & 2033
- Figure 31: Asia Pacific Open Source Infrastructure Revenue Share (%), by Country 2025 & 2033
List of Tables
- Table 1: Global Open Source Infrastructure Revenue undefined Forecast, by Application 2020 & 2033
- Table 2: Global Open Source Infrastructure Revenue undefined Forecast, by Type 2020 & 2033
- Table 3: Global Open Source Infrastructure Revenue undefined Forecast, by Region 2020 & 2033
- Table 4: Global Open Source Infrastructure Revenue undefined Forecast, by Application 2020 & 2033
- Table 5: Global Open Source Infrastructure Revenue undefined Forecast, by Type 2020 & 2033
- Table 6: Global Open Source Infrastructure Revenue undefined Forecast, by Country 2020 & 2033
- Table 7: United States Open Source Infrastructure Revenue (undefined) Forecast, by Application 2020 & 2033
- Table 8: Canada Open Source Infrastructure Revenue (undefined) Forecast, by Application 2020 & 2033
- Table 9: Mexico Open Source Infrastructure Revenue (undefined) Forecast, by Application 2020 & 2033
- Table 10: Global Open Source Infrastructure Revenue undefined Forecast, by Application 2020 & 2033
- Table 11: Global Open Source Infrastructure Revenue undefined Forecast, by Type 2020 & 2033
- Table 12: Global Open Source Infrastructure Revenue undefined Forecast, by Country 2020 & 2033
- Table 13: Brazil Open Source Infrastructure Revenue (undefined) Forecast, by Application 2020 & 2033
- Table 14: Argentina Open Source Infrastructure Revenue (undefined) Forecast, by Application 2020 & 2033
- Table 15: Rest of South America Open Source Infrastructure Revenue (undefined) Forecast, by Application 2020 & 2033
- Table 16: Global Open Source Infrastructure Revenue undefined Forecast, by Application 2020 & 2033
- Table 17: Global Open Source Infrastructure Revenue undefined Forecast, by Type 2020 & 2033
- Table 18: Global Open Source Infrastructure Revenue undefined Forecast, by Country 2020 & 2033
- Table 19: United Kingdom Open Source Infrastructure Revenue (undefined) Forecast, by Application 2020 & 2033
- Table 20: Germany Open Source Infrastructure Revenue (undefined) Forecast, by Application 2020 & 2033
- Table 21: France Open Source Infrastructure Revenue (undefined) Forecast, by Application 2020 & 2033
- Table 22: Italy Open Source Infrastructure Revenue (undefined) Forecast, by Application 2020 & 2033
- Table 23: Spain Open Source Infrastructure Revenue (undefined) Forecast, by Application 2020 & 2033
- Table 24: Russia Open Source Infrastructure Revenue (undefined) Forecast, by Application 2020 & 2033
- Table 25: Benelux Open Source Infrastructure Revenue (undefined) Forecast, by Application 2020 & 2033
- Table 26: Nordics Open Source Infrastructure Revenue (undefined) Forecast, by Application 2020 & 2033
- Table 27: Rest of Europe Open Source Infrastructure Revenue (undefined) Forecast, by Application 2020 & 2033
- Table 28: Global Open Source Infrastructure Revenue undefined Forecast, by Application 2020 & 2033
- Table 29: Global Open Source Infrastructure Revenue undefined Forecast, by Type 2020 & 2033
- Table 30: Global Open Source Infrastructure Revenue undefined Forecast, by Country 2020 & 2033
- Table 31: Turkey Open Source Infrastructure Revenue (undefined) Forecast, by Application 2020 & 2033
- Table 32: Israel Open Source Infrastructure Revenue (undefined) Forecast, by Application 2020 & 2033
- Table 33: GCC Open Source Infrastructure Revenue (undefined) Forecast, by Application 2020 & 2033
- Table 34: North Africa Open Source Infrastructure Revenue (undefined) Forecast, by Application 2020 & 2033
- Table 35: South Africa Open Source Infrastructure Revenue (undefined) Forecast, by Application 2020 & 2033
- Table 36: Rest of Middle East & Africa Open Source Infrastructure Revenue (undefined) Forecast, by Application 2020 & 2033
- Table 37: Global Open Source Infrastructure Revenue undefined Forecast, by Application 2020 & 2033
- Table 38: Global Open Source Infrastructure Revenue undefined Forecast, by Type 2020 & 2033
- Table 39: Global Open Source Infrastructure Revenue undefined Forecast, by Country 2020 & 2033
- Table 40: China Open Source Infrastructure Revenue (undefined) Forecast, by Application 2020 & 2033
- Table 41: India Open Source Infrastructure Revenue (undefined) Forecast, by Application 2020 & 2033
- Table 42: Japan Open Source Infrastructure Revenue (undefined) Forecast, by Application 2020 & 2033
- Table 43: South Korea Open Source Infrastructure Revenue (undefined) Forecast, by Application 2020 & 2033
- Table 44: ASEAN Open Source Infrastructure Revenue (undefined) Forecast, by Application 2020 & 2033
- Table 45: Oceania Open Source Infrastructure Revenue (undefined) Forecast, by Application 2020 & 2033
- Table 46: Rest of Asia Pacific Open Source Infrastructure Revenue (undefined) Forecast, by Application 2020 & 2033
Frequently Asked Questions
1. What is the projected Compound Annual Growth Rate (CAGR) of the Open Source Infrastructure?
The projected CAGR is approximately 19.5%.
2. Which companies are prominent players in the Open Source Infrastructure?
Key companies in the market include Amazon Web Services, The Apache Software Foundation, Box, Builder.Io, Cloud Native Computing Foundation, Databricks, Docker, Google, H2O.Ai, HashiCorp, IBM, Intel, Microsoft, Meta, Oracle, OpenAI, Red Hat, SAP, Strata IO, VMware.
3. What are the main segments of the Open Source Infrastructure?
The market segments include Application, Type.
4. Can you provide details about the market size?
The market size is estimated to be USD XXX N/A as of 2022.
5. What are some drivers contributing to market growth?
N/A
6. What are the notable trends driving market growth?
N/A
7. Are there any restraints impacting market growth?
N/A
8. Can you provide examples of recent developments in the market?
N/A
9. What pricing options are available for accessing the report?
Pricing options include single-user, multi-user, and enterprise licenses priced at USD 3950.00, USD 5925.00, and USD 7900.00 respectively.
10. Is the market size provided in terms of value or volume?
The market size is provided in terms of value, measured in N/A.
11. Are there any specific market keywords associated with the report?
Yes, the market keyword associated with the report is "Open Source Infrastructure," which aids in identifying and referencing the specific market segment covered.
12. How do I determine which pricing option suits my needs best?
The pricing options vary based on user requirements and access needs. Individual users may opt for single-user licenses, while businesses requiring broader access may choose multi-user or enterprise licenses for cost-effective access to the report.
13. Are there any additional resources or data provided in the Open Source Infrastructure report?
While the report offers comprehensive insights, it's advisable to review the specific contents or supplementary materials provided to ascertain if additional resources or data are available.
14. How can I stay updated on further developments or reports in the Open Source Infrastructure?
To stay informed about further developments, trends, and reports in the Open Source Infrastructure, consider subscribing to industry newsletters, following relevant companies and organizations, or regularly checking reputable industry news sources and publications.
Methodology
Step 1 - Identification of Relevant Samples Size from Population Database


Step 2 - Approaches for Defining Global Market Size (Value, Volume* & Price*)

Note*: In applicable scenarios
Step 3 - Data Sources
Primary Research
- Web Analytics
- Survey Reports
- Research Institute
- Latest Research Reports
- Opinion Leaders
Secondary Research
- Annual Reports
- White Paper
- Latest Press Release
- Industry Association
- Paid Database
- Investor Presentations

Step 4 - Data Triangulation
Involves using different sources of information in order to increase the validity of a study
These sources are likely to be stakeholders in a program - participants, other researchers, program staff, other community members, and so on.
Then we put all data in single framework & apply various statistical tools to find out the dynamic on the market.
During the analysis stage, feedback from the stakeholder groups would be compared to determine areas of agreement as well as areas of divergence