

Key Insights
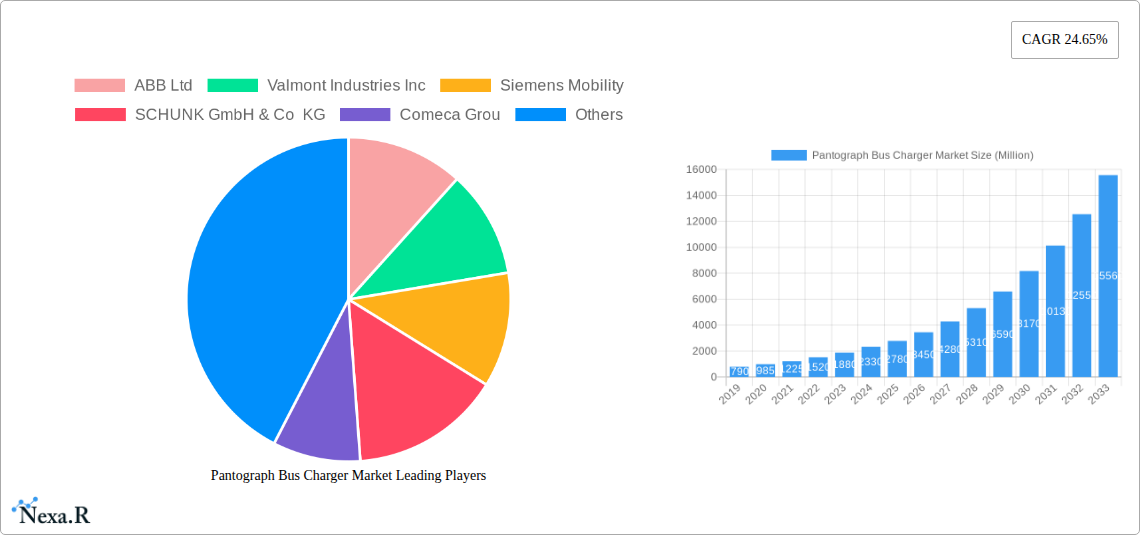
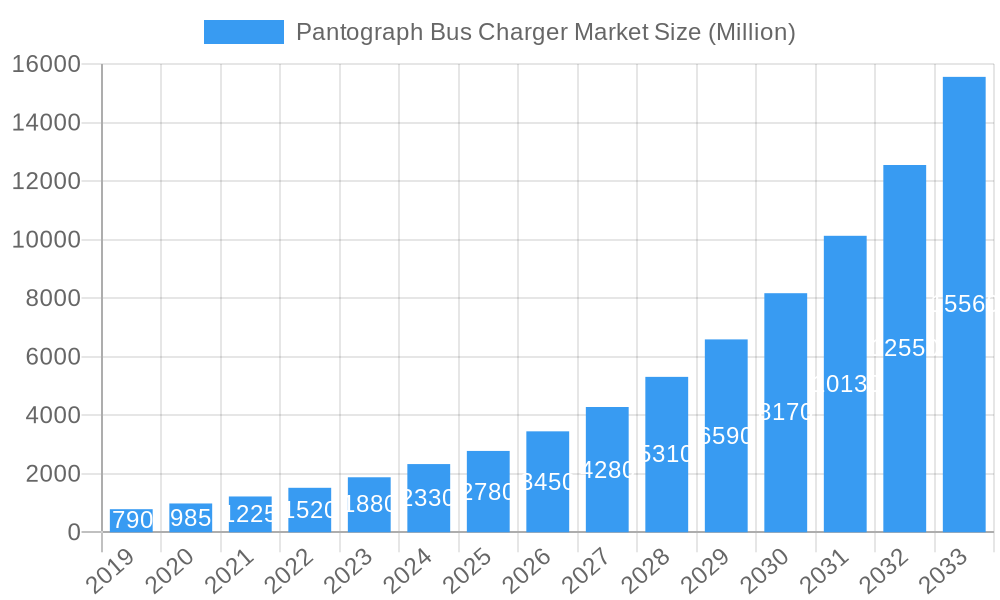
The global Pantograph Bus Charger Market is poised for exceptional growth, projected to reach an estimated USD 2.78 billion by 2025, with a remarkable Compound Annual Growth Rate (CAGR) of 24.65% expected to persist through 2033. This surge is primarily fueled by the escalating adoption of electric buses worldwide, driven by stringent government regulations aimed at reducing emissions and promoting sustainable urban transportation. The inherent efficiency and speed of pantograph charging systems, especially for high-capacity buses and in busy urban environments, make them a preferred choice over traditional plug-in methods. The market is experiencing significant expansion in segments such as Direct Current Fast Charging, reflecting the demand for rapid turnaround times at bus depots and terminals. Furthermore, the increasing integration of sophisticated software for grid management and charging optimization, alongside robust hardware components, are key growth enablers. Leading players are investing heavily in research and development to enhance charging speeds, improve interoperability, and reduce costs, further accelerating market penetration.
Pantograph Bus Charger Market Market Size (In Million)
The market's trajectory is further shaped by critical trends including the shift towards smart charging solutions that optimize energy consumption and integrate with renewable energy sources. Advancements in battery technology for electric buses are also contributing to the demand for high-power charging infrastructure like pantographs. While the market exhibits robust growth, certain restraints, such as the high initial investment cost for infrastructure deployment and the need for standardized charging protocols across different regions and manufacturers, present challenges. However, these are being steadily addressed through technological innovation and strategic partnerships. Geographically, Asia Pacific, particularly China and India, is emerging as a dominant force due to aggressive government initiatives and rapid urbanization. North America and Europe are also significant markets, driven by strong environmental mandates and a proactive approach to electrifying public transport fleets. The development of both off-board and on-board pantograph systems caters to diverse operational needs, ensuring continued market diversification and expansion.
Pantograph Bus Charger Market Company Market Share
Pantograph Bus Charger Market Report Description:
Unlocking the Future of Electric Mobility: A Comprehensive Analysis of the Global Pantograph Bus Charger Market (2019-2033)
This in-depth report provides a definitive analysis of the burgeoning Pantograph Bus Charger Market, a critical component in the global transition to sustainable public transportation. With a study period spanning from 2019 to 2033, and a focused forecast period of 2025-2033, this report offers unparalleled insights into market dynamics, growth trends, regional dominance, and the competitive landscape. Explore the intricate interplay of technological advancements, regulatory shifts, and evolving consumer demands that are shaping the future of electric bus charging. This report is essential for industry professionals, stakeholders, and investors seeking to understand the significant opportunities within this rapidly expanding sector, with all quantitative values presented in Million units.
Pantograph Bus Charger Market Market Dynamics & Structure
The Pantograph Bus Charger Market is characterized by a moderate to high level of concentration, with key players like ABB Ltd, Valmont Industries Inc, Siemens Mobility, SCHUNK GmbH & Co KG, Comeca Group, Schunk Transit Systems GmBH, Wabtech Corporation, Vector Informatik GmbH, and SETEC Power actively driving innovation and market penetration. Technological innovation remains a primary driver, with ongoing advancements in charging speeds, energy efficiency, and grid integration solutions. Robust regulatory frameworks, particularly those promoting electric vehicle adoption and emission reduction targets, are further bolstering market growth. While competitive product substitutes exist, such as slower charging solutions, the inherent speed and efficiency of pantograph charging position it favorably for high-demand public transport operations. End-user demographics are predominantly public transit authorities and fleet operators prioritizing operational efficiency and sustainability. Mergers and acquisitions (M&A) trends, though not extensively prevalent, indicate strategic consolidation aimed at expanding product portfolios and geographical reach.
- Market Concentration: Moderate to High
- Key Innovation Drivers: Increased charging speed, enhanced energy efficiency, smart grid integration, automation.
- Regulatory Influence: Government incentives for EV adoption, emission reduction mandates, infrastructure development policies.
- Competitive Landscape: Limited direct substitutes for rapid depot and opportunity charging, but alternatives like slower plug-in charging exist.
- End-User Focus: Public transit agencies, urban mobility operators, fleet management companies.
- M&A Activity: Strategic acquisitions for market expansion and technology integration.
Pantograph Bus Charger Market Growth Trends & Insights
The global Pantograph Bus Charger Market is poised for exponential growth, driven by an accelerated adoption rate of electric buses worldwide. The market size is projected to witness a significant surge, fueled by increasing investments in public transportation electrification and supportive government policies. Technological disruptions, including the development of higher power charging capabilities and smarter grid connectivity, are redefining operational efficiency for bus fleets. Consumer behavior is shifting towards environmentally conscious choices, with a growing preference for cleaner and quieter urban transit. The forecast period (2025–2033) is expected to see a Compound Annual Growth Rate (CAGR) of XX%, indicating substantial market expansion. The market penetration of pantograph charging solutions is anticipated to increase dramatically as cities worldwide commit to decarbonizing their public transport.
Dominant Regions, Countries, or Segments in Pantograph Bus Charger Market
The Direct Current Fast Charging segment, particularly the Off-board top-down pantograph infrastructure type, is currently dominating the Pantograph Bus Charger Market. This dominance is driven by the critical need for rapid charging solutions in high-utilization public transport environments, allowing buses to be recharged quickly during layover periods or at termini. Europe, led by countries like Germany, the United Kingdom, and Norway, is a frontrunner in adopting pantograph charging due to stringent emission regulations and proactive government initiatives promoting electric mobility. North America, with key markets in the United States and Canada, is rapidly catching up, spurred by significant investments in electric bus fleets and charging infrastructure. Asia-Pacific, particularly China, is also a major contributor, driven by its massive scale of public transportation and ambitious environmental goals. The Hardware component type forms the larger share of the market, encompassing the physical pantograph systems and associated power electronics.
- Dominant Charging Type: Direct Current Fast Charging
- Dominant Charging Infrastructure Type: Off-board top-down pantograph
- Key Regional Leaders: Europe (Germany, UK, Norway), North America (USA, Canada), Asia-Pacific (China).
- Dominant Component Type: Hardware
- Growth Drivers in Dominant Segments:
- Europe: Strict emission standards, government subsidies, established transit networks.
- North America: Growing EV bus orders, federal and state-level funding for charging infrastructure, corporate sustainability goals.
- Asia-Pacific: Large-scale public transit projects, government support for green technology, urban population growth.
- Off-board Top-Down Pantographs: Suitability for high-frequency charging, efficiency in depot operations, scalability for fleet expansion.
Pantograph Bus Charger Market Product Landscape
The Pantograph Bus Charger Market is witnessing a surge in product innovations focused on enhancing charging speed, reliability, and user-friendliness. Manufacturers are developing advanced pantograph systems capable of delivering higher DC charging power, such as 150 kW and even up to 450 kW for opportunity charging, as highlighted by First Bus's order. These innovations aim to minimize bus downtime and maximize operational uptime. Furthermore, smart charging capabilities are being integrated, allowing for optimized charging schedules based on grid load and electricity pricing. Unique selling propositions include hands-free, automated charging mechanisms, improving safety and operational efficiency, as exemplified by the Schunk SLS 301 series Depot Charging Pantograph. The performance metrics emphasize reduced charging times, increased energy transfer efficiency, and enhanced durability for demanding public transport environments.
Key Drivers, Barriers & Challenges in Pantograph Bus Charger Market
Key Drivers: The Pantograph Bus Charger Market is propelled by a confluence of powerful drivers. Governmental mandates and incentives aimed at decarbonizing public transportation are paramount, encouraging transit authorities to transition to electric buses. The falling costs of battery technology and electric buses are making this transition more economically viable. Technological advancements in pantograph charging systems, offering rapid and efficient charging, are addressing operational concerns. Growing environmental awareness among the public and a demand for cleaner urban air quality further fuel the adoption of electric buses and their associated charging infrastructure.
Barriers & Challenges: Despite its robust growth, the market faces several hurdles. The high initial capital investment for pantograph charging infrastructure can be a significant barrier for some transit agencies. Grid capacity limitations in certain areas might necessitate costly upgrades to support high-power charging demands. The standardization of charging protocols and connectors is still evolving, which can create interoperability challenges. Supply chain disruptions for critical components and a shortage of skilled labor for installation and maintenance also pose significant challenges. Intense competition from slower, but potentially lower-cost, charging solutions can also impact market penetration.
Emerging Opportunities in Pantograph Bus Charger Market
Emerging opportunities within the Pantograph Bus Charger Market lie in the integration of advanced smart grid technologies, enabling bi-directional power flow and vehicle-to-grid (V2G) capabilities. This can transform charging depots into distributed energy resources, offering grid stability and revenue generation potential for transit operators. The expansion of pantograph charging solutions into new geographical markets, particularly in developing economies with growing urban populations and increasing environmental consciousness, presents significant untapped potential. Furthermore, the development of automated and robotic pantograph systems for enhanced safety and efficiency in depot operations, and the application of pantograph charging for other heavy-duty electric vehicles beyond buses, represent promising avenues for future growth.
Growth Accelerators in the Pantograph Bus Charger Market Industry
Several catalysts are accelerating the long-term growth of the Pantograph Bus Charger Market. Continuous technological breakthroughs in battery energy density and charging power, coupled with further reductions in the cost of electric buses, will significantly boost adoption rates. Strategic partnerships between bus manufacturers, charging infrastructure providers, and energy utilities are crucial for creating integrated e-mobility ecosystems. Market expansion strategies, including the development of charging solutions tailored for diverse operational needs and geographical conditions, will open new revenue streams. The increasing global commitment to climate action and the United Nations' Sustainable Development Goals will continue to drive policies and investments favoring electric public transportation, acting as a powerful growth accelerator.
Key Players Shaping the Pantograph Bus Charger Market Market
- ABB Ltd
- Valmont Industries Inc
- Siemens Mobility
- SCHUNK GmbH & Co KG
- Comeca Group
- Schunk Transit Systems GmBH
- Wabtech Corporation
- Vector Informatik GmbH
- SETEC Power
Notable Milestones in Pantograph Bus Charger Market Sector
- August 2022: First Bus orders 193 electric buses from Wrightbus, specifying 150 kW DC charging and optional 450 kW pantograph opportunity charging.
- May 2022: San Diego Metropolitan System begins construction of a USD 8.5 million overhead electric bus charging system for 24 buses, installing Schunk SLS 301 series Depot Charging Pantographs.
- April 2022: Transports Metropolitans de Barcelona (TMB) tenders for up to 83 battery-powered electric buses, with provisions for night load pantograph charging for both standard (12m) and articulated (18m) units.
- April 2022: Miejski Zakład Komunikacji in Grudziądz contracts Solaris Bus & Coach Sp. z o.o. for 17 electric buses and associated pantograph chargers, with delivery expected in Q1 2023.
- November 2021: Moscow's Department of Transport and Road Infrastructure Development and FSUE NAMI State Research Center launch a pilot project for a bus-down pantograph charging station with two electric buses equipped with special contact rails.
In-Depth Pantograph Bus Charger Market Market Outlook
The future outlook for the Pantograph Bus Charger Market is exceptionally bright, driven by sustained investments in electric public transportation infrastructure globally. Growth accelerators such as ongoing advancements in charging technology, leading to faster and more efficient power delivery, will continue to be pivotal. Strategic collaborations between major industry players and transit authorities will streamline the deployment of charging solutions and foster innovation. The increasing recognition of pantograph charging as a vital solution for high-demand, high-utilization bus fleets will fuel market expansion into new regions and applications. The market is poised for robust growth, driven by environmental imperatives, technological advancements, and supportive policy frameworks, presenting significant opportunities for stakeholders across the value chain.
Pantograph Bus Charger Market Segmentation
-
1. Charging Type
- 1.1. Level 1
- 1.2. Level 2
- 1.3. Direct Current Fast Charging
-
2. Pcomponent Type
- 2.1. Hardware
- 2.2. Software
-
3. Charging Infrastructure Type
- 3.1. Off-board top-down pantograph
- 3.2. On-Board Bottom-Up Pantograph
Pantograph Bus Charger Market Segmentation By Geography
-
1. North America
- 1.1. United States
- 1.2. Canada
- 1.3. Rest of North America
-
2. Europe
- 2.1. Germany
- 2.2. United Kingdom
- 2.3. France
- 2.4. Italy
- 2.5. Spain
- 2.6. Rest of Europe
-
3. Asia Pacific
- 3.1. India
- 3.2. China
- 3.3. South Korea
- 3.4. Japan
- 3.5. Rest of Asia Pacific
-
4. South America
- 4.1. Brazil
- 4.2. Aegentina
- 4.3. Rest of the South America
-
5. Middle East and Africa
- 5.1. Saudi Arabia
- 5.2. South Africa
- 5.3. Rest of the Middle East and Africa
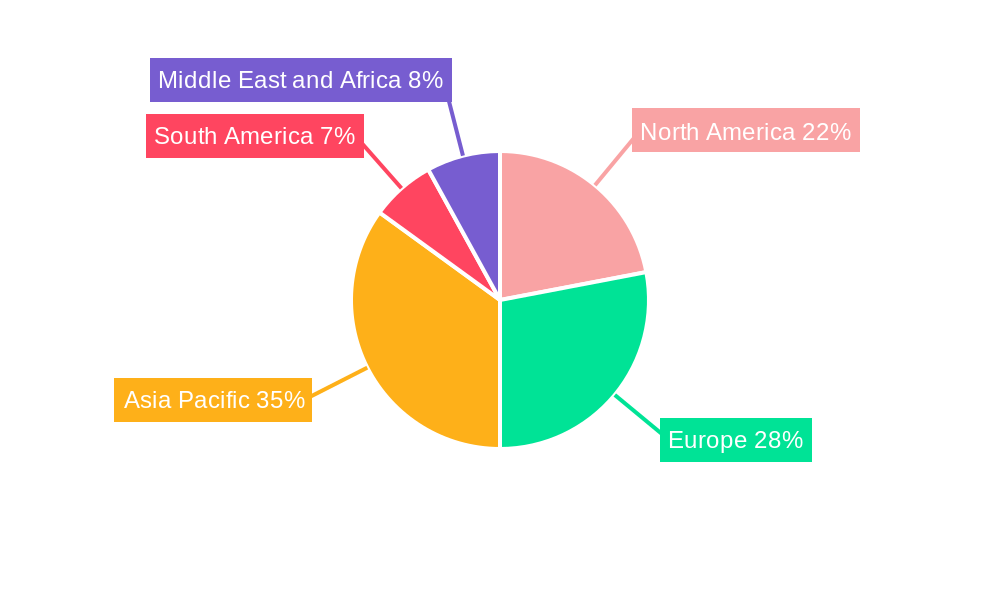
Pantograph Bus Charger Market Regional Market Share
Geographic Coverage of Pantograph Bus Charger Market
Pantograph Bus Charger Market REPORT HIGHLIGHTS
| Aspects | Details |
|---|---|
| Study Period | 2020-2034 |
| Base Year | 2025 |
| Estimated Year | 2026 |
| Forecast Period | 2026-2034 |
| Historical Period | 2020-2025 |
| Growth Rate | CAGR of 24.65% from 2020-2034 |
| Segmentation |
|
Table of Contents
- 1. Introduction
- 1.1. Research Scope
- 1.2. Market Segmentation
- 1.3. Research Objective
- 1.4. Definitions and Assumptions
- 2. Executive Summary
- 2.1. Market Snapshot
- 3. Market Dynamics
- 3.1. Market Drivers
- 3.2. Market Restrains
- 3.3. Market Trends
- 3.4. Market Opportunities
- 4. Market Factor Analysis
- 4.1. Porters Five Forces
- 4.1.1. Bargaining Power of Suppliers
- 4.1.2. Bargaining Power of Buyers
- 4.1.3. Threat of New Entrants
- 4.1.4. Threat of Substitutes
- 4.1.5. Competitive Rivalry
- 4.2. PESTEL analysis
- 4.3. BCG Analysis
- 4.3.1. Stars (High Growth, High Market Share)
- 4.3.2. Cash Cows (Low Growth, High Market Share)
- 4.3.3. Question Mark (High Growth, Low Market Share)
- 4.3.4. Dogs (Low Growth, Low Market Share)
- 4.4. Ansoff Matrix Analysis
- 4.5. Supply Chain Analysis
- 4.6. Regulatory Landscape
- 4.7. Current Market Potential and Opportunity Assessment (TAM–SAM–SOM Framework)
- 4.8. NRP Analyst Note
- 4.1. Porters Five Forces
- 5. Market Analysis, Insights and Forecast 2021-2033
- 5.1. Market Analysis, Insights and Forecast - by Charging Type
- 5.1.1. Level 1
- 5.1.2. Level 2
- 5.1.3. Direct Current Fast Charging
- 5.2. Market Analysis, Insights and Forecast - by Pcomponent Type
- 5.2.1. Hardware
- 5.2.2. Software
- 5.3. Market Analysis, Insights and Forecast - by Charging Infrastructure Type
- 5.3.1. Off-board top-down pantograph
- 5.3.2. On-Board Bottom-Up Pantograph
- 5.4. Market Analysis, Insights and Forecast - by Region
- 5.4.1. North America
- 5.4.2. Europe
- 5.4.3. Asia Pacific
- 5.4.4. South America
- 5.4.5. Middle East and Africa
- 5.1. Market Analysis, Insights and Forecast - by Charging Type
- 6. Global Pantograph Bus Charger Market Analysis, Insights and Forecast, 2021-2033
- 6.1. Market Analysis, Insights and Forecast - by Charging Type
- 6.1.1. Level 1
- 6.1.2. Level 2
- 6.1.3. Direct Current Fast Charging
- 6.2. Market Analysis, Insights and Forecast - by Pcomponent Type
- 6.2.1. Hardware
- 6.2.2. Software
- 6.3. Market Analysis, Insights and Forecast - by Charging Infrastructure Type
- 6.3.1. Off-board top-down pantograph
- 6.3.2. On-Board Bottom-Up Pantograph
- 6.1. Market Analysis, Insights and Forecast - by Charging Type
- 7. North America Pantograph Bus Charger Market Analysis, Insights and Forecast, 2020-2032
- 7.1. Market Analysis, Insights and Forecast - by Charging Type
- 7.1.1. Level 1
- 7.1.2. Level 2
- 7.1.3. Direct Current Fast Charging
- 7.2. Market Analysis, Insights and Forecast - by Pcomponent Type
- 7.2.1. Hardware
- 7.2.2. Software
- 7.3. Market Analysis, Insights and Forecast - by Charging Infrastructure Type
- 7.3.1. Off-board top-down pantograph
- 7.3.2. On-Board Bottom-Up Pantograph
- 7.1. Market Analysis, Insights and Forecast - by Charging Type
- 8. Europe Pantograph Bus Charger Market Analysis, Insights and Forecast, 2020-2032
- 8.1. Market Analysis, Insights and Forecast - by Charging Type
- 8.1.1. Level 1
- 8.1.2. Level 2
- 8.1.3. Direct Current Fast Charging
- 8.2. Market Analysis, Insights and Forecast - by Pcomponent Type
- 8.2.1. Hardware
- 8.2.2. Software
- 8.3. Market Analysis, Insights and Forecast - by Charging Infrastructure Type
- 8.3.1. Off-board top-down pantograph
- 8.3.2. On-Board Bottom-Up Pantograph
- 8.1. Market Analysis, Insights and Forecast - by Charging Type
- 9. Asia Pacific Pantograph Bus Charger Market Analysis, Insights and Forecast, 2020-2032
- 9.1. Market Analysis, Insights and Forecast - by Charging Type
- 9.1.1. Level 1
- 9.1.2. Level 2
- 9.1.3. Direct Current Fast Charging
- 9.2. Market Analysis, Insights and Forecast - by Pcomponent Type
- 9.2.1. Hardware
- 9.2.2. Software
- 9.3. Market Analysis, Insights and Forecast - by Charging Infrastructure Type
- 9.3.1. Off-board top-down pantograph
- 9.3.2. On-Board Bottom-Up Pantograph
- 9.1. Market Analysis, Insights and Forecast - by Charging Type
- 10. South America Pantograph Bus Charger Market Analysis, Insights and Forecast, 2020-2032
- 10.1. Market Analysis, Insights and Forecast - by Charging Type
- 10.1.1. Level 1
- 10.1.2. Level 2
- 10.1.3. Direct Current Fast Charging
- 10.2. Market Analysis, Insights and Forecast - by Pcomponent Type
- 10.2.1. Hardware
- 10.2.2. Software
- 10.3. Market Analysis, Insights and Forecast - by Charging Infrastructure Type
- 10.3.1. Off-board top-down pantograph
- 10.3.2. On-Board Bottom-Up Pantograph
- 10.1. Market Analysis, Insights and Forecast - by Charging Type
- 11. Middle East and Africa Pantograph Bus Charger Market Analysis, Insights and Forecast, 2020-2032
- 11.1. Market Analysis, Insights and Forecast - by Charging Type
- 11.1.1. Level 1
- 11.1.2. Level 2
- 11.1.3. Direct Current Fast Charging
- 11.2. Market Analysis, Insights and Forecast - by Pcomponent Type
- 11.2.1. Hardware
- 11.2.2. Software
- 11.3. Market Analysis, Insights and Forecast - by Charging Infrastructure Type
- 11.3.1. Off-board top-down pantograph
- 11.3.2. On-Board Bottom-Up Pantograph
- 11.1. Market Analysis, Insights and Forecast - by Charging Type
- 12. Competitive Analysis
- 12.1. Company Profiles
- 12.1.1 ABB Ltd
- 12.1.1.1. Company Overview
- 12.1.1.2. Products
- 12.1.1.3. Company Financials
- 12.1.1.4. SWOT Analysis
- 12.1.2 Valmont Industries Inc
- 12.1.2.1. Company Overview
- 12.1.2.2. Products
- 12.1.2.3. Company Financials
- 12.1.2.4. SWOT Analysis
- 12.1.3 Siemens Mobility
- 12.1.3.1. Company Overview
- 12.1.3.2. Products
- 12.1.3.3. Company Financials
- 12.1.3.4. SWOT Analysis
- 12.1.4 SCHUNK GmbH & Co KG
- 12.1.4.1. Company Overview
- 12.1.4.2. Products
- 12.1.4.3. Company Financials
- 12.1.4.4. SWOT Analysis
- 12.1.5 Comeca Grou
- 12.1.5.1. Company Overview
- 12.1.5.2. Products
- 12.1.5.3. Company Financials
- 12.1.5.4. SWOT Analysis
- 12.1.6 Schunk Transit Systems GmBH
- 12.1.6.1. Company Overview
- 12.1.6.2. Products
- 12.1.6.3. Company Financials
- 12.1.6.4. SWOT Analysis
- 12.1.7 Wabtech Corporation
- 12.1.7.1. Company Overview
- 12.1.7.2. Products
- 12.1.7.3. Company Financials
- 12.1.7.4. SWOT Analysis
- 12.1.8 Vector Informatik GmbH
- 12.1.8.1. Company Overview
- 12.1.8.2. Products
- 12.1.8.3. Company Financials
- 12.1.8.4. SWOT Analysis
- 12.1.9 SETEC Power
- 12.1.9.1. Company Overview
- 12.1.9.2. Products
- 12.1.9.3. Company Financials
- 12.1.9.4. SWOT Analysis
- 12.1.1 ABB Ltd
- 12.2. Market Entropy
- 12.2.1 Company's Key Areas Served
- 12.2.2 Recent Developments
- 12.3. Company Market Share Analysis 2025
- 12.3.1 Top 5 Companies Market Share Analysis
- 12.3.2 Top 3 Companies Market Share Analysis
- 12.4. List of Potential Customers
- 13. Research Methodology
List of Figures
- Figure 1: Global Pantograph Bus Charger Market Revenue Breakdown (Million, %) by Region 2025 & 2033
- Figure 2: North America Pantograph Bus Charger Market Revenue (Million), by Charging Type 2025 & 2033
- Figure 3: North America Pantograph Bus Charger Market Revenue Share (%), by Charging Type 2025 & 2033
- Figure 4: North America Pantograph Bus Charger Market Revenue (Million), by Pcomponent Type 2025 & 2033
- Figure 5: North America Pantograph Bus Charger Market Revenue Share (%), by Pcomponent Type 2025 & 2033
- Figure 6: North America Pantograph Bus Charger Market Revenue (Million), by Charging Infrastructure Type 2025 & 2033
- Figure 7: North America Pantograph Bus Charger Market Revenue Share (%), by Charging Infrastructure Type 2025 & 2033
- Figure 8: North America Pantograph Bus Charger Market Revenue (Million), by Country 2025 & 2033
- Figure 9: North America Pantograph Bus Charger Market Revenue Share (%), by Country 2025 & 2033
- Figure 10: Europe Pantograph Bus Charger Market Revenue (Million), by Charging Type 2025 & 2033
- Figure 11: Europe Pantograph Bus Charger Market Revenue Share (%), by Charging Type 2025 & 2033
- Figure 12: Europe Pantograph Bus Charger Market Revenue (Million), by Pcomponent Type 2025 & 2033
- Figure 13: Europe Pantograph Bus Charger Market Revenue Share (%), by Pcomponent Type 2025 & 2033
- Figure 14: Europe Pantograph Bus Charger Market Revenue (Million), by Charging Infrastructure Type 2025 & 2033
- Figure 15: Europe Pantograph Bus Charger Market Revenue Share (%), by Charging Infrastructure Type 2025 & 2033
- Figure 16: Europe Pantograph Bus Charger Market Revenue (Million), by Country 2025 & 2033
- Figure 17: Europe Pantograph Bus Charger Market Revenue Share (%), by Country 2025 & 2033
- Figure 18: Asia Pacific Pantograph Bus Charger Market Revenue (Million), by Charging Type 2025 & 2033
- Figure 19: Asia Pacific Pantograph Bus Charger Market Revenue Share (%), by Charging Type 2025 & 2033
- Figure 20: Asia Pacific Pantograph Bus Charger Market Revenue (Million), by Pcomponent Type 2025 & 2033
- Figure 21: Asia Pacific Pantograph Bus Charger Market Revenue Share (%), by Pcomponent Type 2025 & 2033
- Figure 22: Asia Pacific Pantograph Bus Charger Market Revenue (Million), by Charging Infrastructure Type 2025 & 2033
- Figure 23: Asia Pacific Pantograph Bus Charger Market Revenue Share (%), by Charging Infrastructure Type 2025 & 2033
- Figure 24: Asia Pacific Pantograph Bus Charger Market Revenue (Million), by Country 2025 & 2033
- Figure 25: Asia Pacific Pantograph Bus Charger Market Revenue Share (%), by Country 2025 & 2033
- Figure 26: South America Pantograph Bus Charger Market Revenue (Million), by Charging Type 2025 & 2033
- Figure 27: South America Pantograph Bus Charger Market Revenue Share (%), by Charging Type 2025 & 2033
- Figure 28: South America Pantograph Bus Charger Market Revenue (Million), by Pcomponent Type 2025 & 2033
- Figure 29: South America Pantograph Bus Charger Market Revenue Share (%), by Pcomponent Type 2025 & 2033
- Figure 30: South America Pantograph Bus Charger Market Revenue (Million), by Charging Infrastructure Type 2025 & 2033
- Figure 31: South America Pantograph Bus Charger Market Revenue Share (%), by Charging Infrastructure Type 2025 & 2033
- Figure 32: South America Pantograph Bus Charger Market Revenue (Million), by Country 2025 & 2033
- Figure 33: South America Pantograph Bus Charger Market Revenue Share (%), by Country 2025 & 2033
- Figure 34: Middle East and Africa Pantograph Bus Charger Market Revenue (Million), by Charging Type 2025 & 2033
- Figure 35: Middle East and Africa Pantograph Bus Charger Market Revenue Share (%), by Charging Type 2025 & 2033
- Figure 36: Middle East and Africa Pantograph Bus Charger Market Revenue (Million), by Pcomponent Type 2025 & 2033
- Figure 37: Middle East and Africa Pantograph Bus Charger Market Revenue Share (%), by Pcomponent Type 2025 & 2033
- Figure 38: Middle East and Africa Pantograph Bus Charger Market Revenue (Million), by Charging Infrastructure Type 2025 & 2033
- Figure 39: Middle East and Africa Pantograph Bus Charger Market Revenue Share (%), by Charging Infrastructure Type 2025 & 2033
- Figure 40: Middle East and Africa Pantograph Bus Charger Market Revenue (Million), by Country 2025 & 2033
- Figure 41: Middle East and Africa Pantograph Bus Charger Market Revenue Share (%), by Country 2025 & 2033
List of Tables
- Table 1: Global Pantograph Bus Charger Market Revenue Million Forecast, by Charging Type 2020 & 2033
- Table 2: Global Pantograph Bus Charger Market Revenue Million Forecast, by Pcomponent Type 2020 & 2033
- Table 3: Global Pantograph Bus Charger Market Revenue Million Forecast, by Charging Infrastructure Type 2020 & 2033
- Table 4: Global Pantograph Bus Charger Market Revenue Million Forecast, by Region 2020 & 2033
- Table 5: Global Pantograph Bus Charger Market Revenue Million Forecast, by Charging Type 2020 & 2033
- Table 6: Global Pantograph Bus Charger Market Revenue Million Forecast, by Pcomponent Type 2020 & 2033
- Table 7: Global Pantograph Bus Charger Market Revenue Million Forecast, by Charging Infrastructure Type 2020 & 2033
- Table 8: Global Pantograph Bus Charger Market Revenue Million Forecast, by Country 2020 & 2033
- Table 9: United States Pantograph Bus Charger Market Revenue (Million) Forecast, by Application 2020 & 2033
- Table 10: Canada Pantograph Bus Charger Market Revenue (Million) Forecast, by Application 2020 & 2033
- Table 11: Rest of North America Pantograph Bus Charger Market Revenue (Million) Forecast, by Application 2020 & 2033
- Table 12: Global Pantograph Bus Charger Market Revenue Million Forecast, by Charging Type 2020 & 2033
- Table 13: Global Pantograph Bus Charger Market Revenue Million Forecast, by Pcomponent Type 2020 & 2033
- Table 14: Global Pantograph Bus Charger Market Revenue Million Forecast, by Charging Infrastructure Type 2020 & 2033
- Table 15: Global Pantograph Bus Charger Market Revenue Million Forecast, by Country 2020 & 2033
- Table 16: Germany Pantograph Bus Charger Market Revenue (Million) Forecast, by Application 2020 & 2033
- Table 17: United Kingdom Pantograph Bus Charger Market Revenue (Million) Forecast, by Application 2020 & 2033
- Table 18: France Pantograph Bus Charger Market Revenue (Million) Forecast, by Application 2020 & 2033
- Table 19: Italy Pantograph Bus Charger Market Revenue (Million) Forecast, by Application 2020 & 2033
- Table 20: Spain Pantograph Bus Charger Market Revenue (Million) Forecast, by Application 2020 & 2033
- Table 21: Rest of Europe Pantograph Bus Charger Market Revenue (Million) Forecast, by Application 2020 & 2033
- Table 22: Global Pantograph Bus Charger Market Revenue Million Forecast, by Charging Type 2020 & 2033
- Table 23: Global Pantograph Bus Charger Market Revenue Million Forecast, by Pcomponent Type 2020 & 2033
- Table 24: Global Pantograph Bus Charger Market Revenue Million Forecast, by Charging Infrastructure Type 2020 & 2033
- Table 25: Global Pantograph Bus Charger Market Revenue Million Forecast, by Country 2020 & 2033
- Table 26: India Pantograph Bus Charger Market Revenue (Million) Forecast, by Application 2020 & 2033
- Table 27: China Pantograph Bus Charger Market Revenue (Million) Forecast, by Application 2020 & 2033
- Table 28: South Korea Pantograph Bus Charger Market Revenue (Million) Forecast, by Application 2020 & 2033
- Table 29: Japan Pantograph Bus Charger Market Revenue (Million) Forecast, by Application 2020 & 2033
- Table 30: Rest of Asia Pacific Pantograph Bus Charger Market Revenue (Million) Forecast, by Application 2020 & 2033
- Table 31: Global Pantograph Bus Charger Market Revenue Million Forecast, by Charging Type 2020 & 2033
- Table 32: Global Pantograph Bus Charger Market Revenue Million Forecast, by Pcomponent Type 2020 & 2033
- Table 33: Global Pantograph Bus Charger Market Revenue Million Forecast, by Charging Infrastructure Type 2020 & 2033
- Table 34: Global Pantograph Bus Charger Market Revenue Million Forecast, by Country 2020 & 2033
- Table 35: Brazil Pantograph Bus Charger Market Revenue (Million) Forecast, by Application 2020 & 2033
- Table 36: Aegentina Pantograph Bus Charger Market Revenue (Million) Forecast, by Application 2020 & 2033
- Table 37: Rest of the South America Pantograph Bus Charger Market Revenue (Million) Forecast, by Application 2020 & 2033
- Table 38: Global Pantograph Bus Charger Market Revenue Million Forecast, by Charging Type 2020 & 2033
- Table 39: Global Pantograph Bus Charger Market Revenue Million Forecast, by Pcomponent Type 2020 & 2033
- Table 40: Global Pantograph Bus Charger Market Revenue Million Forecast, by Charging Infrastructure Type 2020 & 2033
- Table 41: Global Pantograph Bus Charger Market Revenue Million Forecast, by Country 2020 & 2033
- Table 42: Saudi Arabia Pantograph Bus Charger Market Revenue (Million) Forecast, by Application 2020 & 2033
- Table 43: South Africa Pantograph Bus Charger Market Revenue (Million) Forecast, by Application 2020 & 2033
- Table 44: Rest of the Middle East and Africa Pantograph Bus Charger Market Revenue (Million) Forecast, by Application 2020 & 2033
Frequently Asked Questions
1. What is the projected Compound Annual Growth Rate (CAGR) of the Pantograph Bus Charger Market?
The projected CAGR is approximately 24.65%.
2. Which companies are prominent players in the Pantograph Bus Charger Market?
Key companies in the market include ABB Ltd, Valmont Industries Inc, Siemens Mobility, SCHUNK GmbH & Co KG, Comeca Grou, Schunk Transit Systems GmBH, Wabtech Corporation, Vector Informatik GmbH, SETEC Power.
3. What are the main segments of the Pantograph Bus Charger Market?
The market segments include Charging Type, Pcomponent Type, Charging Infrastructure Type.
4. Can you provide details about the market size?
The market size is estimated to be USD 2.78 Million as of 2022.
5. What are some drivers contributing to market growth?
Rise in Vehicle Sale.
6. What are the notable trends driving market growth?
Rising Emphasis of Government on Eco-Friendly Buses.
7. Are there any restraints impacting market growth?
Increase in demand for Electric Vehicles.
8. Can you provide examples of recent developments in the market?
August 2022: British bus company First Bus ordered 193 electric buses worth GBP 81 million (~USD 96.4 million) from Northern Irish bus manufacturer Wrightbus. Furthermore, the company initially specifies the DC charging power at 150 kW and optional opportunity charging at 450 kW through pantograph options.
9. What pricing options are available for accessing the report?
Pricing options include single-user, multi-user, and enterprise licenses priced at USD 4750, USD 5250, and USD 8750 respectively.
10. Is the market size provided in terms of value or volume?
The market size is provided in terms of value, measured in Million.
11. Are there any specific market keywords associated with the report?
Yes, the market keyword associated with the report is "Pantograph Bus Charger Market," which aids in identifying and referencing the specific market segment covered.
12. How do I determine which pricing option suits my needs best?
The pricing options vary based on user requirements and access needs. Individual users may opt for single-user licenses, while businesses requiring broader access may choose multi-user or enterprise licenses for cost-effective access to the report.
13. Are there any additional resources or data provided in the Pantograph Bus Charger Market report?
While the report offers comprehensive insights, it's advisable to review the specific contents or supplementary materials provided to ascertain if additional resources or data are available.
14. How can I stay updated on further developments or reports in the Pantograph Bus Charger Market?
To stay informed about further developments, trends, and reports in the Pantograph Bus Charger Market, consider subscribing to industry newsletters, following relevant companies and organizations, or regularly checking reputable industry news sources and publications.
Methodology
Step 1 - Identification of Relevant Samples Size from Population Database


Step 2 - Approaches for Defining Global Market Size (Value, Volume* & Price*)

Note*: In applicable scenarios
Step 3 - Data Sources
Primary Research
- Web Analytics
- Survey Reports
- Research Institute
- Latest Research Reports
- Opinion Leaders
Secondary Research
- Annual Reports
- White Paper
- Latest Press Release
- Industry Association
- Paid Database
- Investor Presentations

Step 4 - Data Triangulation
Involves using different sources of information in order to increase the validity of a study
These sources are likely to be stakeholders in a program - participants, other researchers, program staff, other community members, and so on.
Then we put all data in single framework & apply various statistical tools to find out the dynamic on the market.
During the analysis stage, feedback from the stakeholder groups would be compared to determine areas of agreement as well as areas of divergence